Dublin (European Parliament constituency)
| Dublin | |
|---|---|
| European Parliament constituency | |
 Location among the 2014 constituencies | |
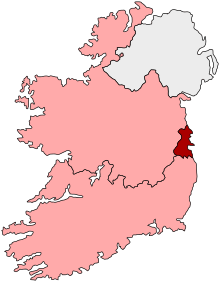 Dublin shown within Ireland | |
| Member state | Ireland |
| Created | 1979 |
| MEPs |
4 (1979–2009) 3 (2009–) |
| Sources | |
Dublin is a constituency of the European Parliament in Ireland. It elects 3 Members of the European Parliament (MEPs) using the single transferable vote form of proportional representation (PR-STV).
History and boundaries
The constituency was created in 1979 for the first direct elections to the European Parliament.[1] From 1979 to 2004, it elected 4 MEPs; this was reduced to 3 for the 2009 election. It comprises the city of Dublin and the counties of Dún Laoghaire–Rathdown, Fingal and South Dublin.[2]
MEPs
| Members of the European Parliament (MEPs) for Dublin 1979– | |||||||||
|---|---|---|---|---|---|---|---|---|---|
|
Key to parties
| |||||||||
| Parl. | Election | Member (Party) | Member (Party) | Member (Party) | Member (Party) | ||||
| 1st | 1979[3] | John O'Connell (Lab) |
Richie Ryan (FG) |
Michael O'Leary (Lab) |
Síle de Valera (FF) | ||||
| 1981[nb 1] | John Horgan (Lab) | ||||||||
| 1981[nb 2] | Frank Cluskey (Lab) | ||||||||
| 1983[nb 1] | Flor O'Mahony (Lab) | ||||||||
| 1983[nb 2] | Brendan Halligan (Lab) | ||||||||
| 2nd | 1984[4] | Eileen Lemass (FF) |
Mary Banotti (FG) |
Niall Andrews (FF) | |||||
| 1986[nb 3] | Chris O'Malley (FG) | ||||||||
| 3rd | 1989[5] | Proinsias De Rossa (WP) |
Barry Desmond (Lab) | ||||||
| 1992[nb 4] | Des Geraghty (DL) | ||||||||
| 4th | 1994[6] | Patricia McKenna (GP) |
Bernie Malone (Lab) | ||||||
| 5th | 1999[7] | Proinsias De Rossa (Lab) | |||||||
| 6th | 2004[8] | Mary Lou McDonald (SF) |
Gay Mitchell (FG) |
Eoin Ryan (FF) | |||||
| 7th | 2009[9] | Joe Higgins (SP) |
3 seats from 2009 | ||||||
| 2011[nb 5] | Paul Murphy (SP) | ||||||||
| 2012[nb 6] | Emer Costello (Lab) | ||||||||
| 8th | 2014[10] | Lynn Boylan (SF) |
Nessa Childers (Ind) |
Brian Hayes (FG) | |||||
Note: The columns in this table are used only for presentational purposes, and no significance should be attached to the order of columns. For details of the order in which seats were won at each election, see the detailed results of that election.
2014 election
| 2014 European Parliament election: Dublin[10] | ||||||||||
|---|---|---|---|---|---|---|---|---|---|---|
| Party | Candidate | % 1st Pref | Count 1 | Count 2 | Count 3 | Count 4 | Count 5 | Count 6 | Count 7 | |
| Sinn Féin | Lynn Boylan | 23.6 | 83,264 | 84,289 | 89,764 | |||||
| Independent | Nessa Childers | 10.2 | 35,939 | 37,706 | 41,787 | 46,531 | 59,955 | 72,413 | 73,598 | |
| Fine Gael | Brian Hayes | 15.5 | 54,676 | 55,132 | 55,656 | 63,591 | 65,132 | 73,317 | 73,405 | |
| Green Party | Eamon Ryan | 12.5 | 44,078 | 45,173 | 47,256 | 53,179 | 59,803 | 71,909 | 72,256 | |
| Fianna Fáil | Mary Fitzpatrick | 12.6 | 44,283 | 44,954 | 45,779 | 48,360 | 50,585 | |||
| Socialist Party | Paul Murphy | 8.5 | 29,953 | 31,310 | 39,313 | 41,373 | ||||
| Labour Party | Emer Costello | 7.4 | 25,961 | 26,232 | 27,194 | |||||
| People Before Profit | Bríd Smith | 6.8 | 23,875 | 25,539 | ||||||
| Direct Democracy | Tom D'Arcy | 1.1 | 4,022 | |||||||
| Direct Democracy | Raymond Whitehead | 0.9 | 3,133 | |||||||
| Independent | Jim Tallon | 0.6 | 2,244 | |||||||
| Fís Nua | Damon Wise | 0.3 | 1,147 | |||||||
| Electorate: 820,668 Valid: 352,575 Spoilt: 6,368 (1.8%) Quota: 88,144 Turnout: 358,943 (43.7%) | ||||||||||
2009 election
| 2009 European Parliament election: Dublin[9][11] | ||||||||||
|---|---|---|---|---|---|---|---|---|---|---|
| Party | Candidate | % 1st Pref | Count 1 | Count 2 | Count 3 | Count 4 | Count 5 | Count 6 | Count 7 | |
| Fine Gael | Gay Mitchell | 23.8 | 96,715 | 99,098 | 100,810 | 104,413 | ||||
| Labour Party | Proinsias De Rossa[nb 6] | 20.5 | 83,471 | 85,217 | 87,274 | 94,306 | 95,636 | 103,225 | ||
| Socialist Party | Joe Higgins[nb 5] | 12.4 | 50,510 | 52,457 | 53,038 | 55,116 | 55,351 | 60,165 | 82,366 | |
| Fianna Fáil | Eoin Ryan | 13.6 | 55,346 | 56,317 | 66,205 | 68,517 | 69,122 | 71,530 | 76,956 | |
| Sinn Féin | Mary Lou McDonald | 11.8 | 47,928 | 50,097 | 50,980 | 52,447 | 52,529 | 55,429 | ||
| Independent | Patricia McKenna | 4.3 | 17,521 | 21,523 | 22,380 | 25,213 | 25,636 | |||
| Green Party | Déirdre de Búrca | 4.7 | 19,086 | 20,226 | 21,991 | |||||
| Fianna Fáil | Eibhlin Byrne | 4.7 | 18,956 | 19,448 | ||||||
| Libertas | Caroline Simons | 3.3 | 13,514 | |||||||
| Independent | Emmanuel Sweeney | 0.9 | 3,583 | |||||||
| Electorate: 812,465 Valid: 406,630 Spoilt: 6,054 (1.5%) Quota: 101,658 Turnout: 412,684 (50.8%) | ||||||||||
For the 2009 election, the constituency was reduced from 4 seats to 3.
2004 election
| 2004 European Parliament election: Dublin[8] | |||||||||
|---|---|---|---|---|---|---|---|---|---|
| Party | Candidate | % 1st Pref | Count 1 | Count 2 | Count 3 | Count 4 | Count 5 | Count 6 | |
| Fine Gael | Gay Mitchell | 21.5 | 90,749 | ||||||
| Fianna Fáil | Eoin Ryan | 14.6 | 61,681 | 62,939 | 64,876 | 65,923 | 85,810 | ||
| Labour Party | Proinsias De Rossa | 12.9 | 54,344 | 56,243 | 57,466 | 62,424 | 66,570 | 96,094 | |
| Sinn Féin | Mary Lou McDonald | 14.3 | 60,395 | 60,689 | 62,030 | 68,355 | 72,153 | 76,543 | |
| Green Party | Patricia McKenna | 9.6 | 40,445 | 41,506 | 44,684 | 49,101 | 51,892 | 59,543 | |
| Labour Party | Ivana Bacik | 9.7 | 40,707 | 41,703 | 42,624 | 45,413 | 47,520 | ||
| Fianna Fáil | Royston Brady | 8.6 | 36,269 | 36,593 | 37,423 | 38,324 | |||
| Socialist Party | Joe Higgins | 5.5 | 23,218 | 23,460 | 24,541 | ||||
| Christian Solidarity | Barry Despard | 1.3 | 5,352 | 5,443 | |||||
| Independent | Brendan Price | 1.1 | 4,813 | 4,931 | |||||
| Independent | Tom Prendeville | 0.5 | 2,071 | 2,124 | |||||
| Independent | Paul Doonan | 0.4 | 1,853 | 1,886 | |||||
| Electorate: 821,723 Valid: 421,897 Spoilt: 13,239 (3.0%) Quota: 84,380 Turnout: 435,136 (52.9%) | |||||||||
1999 election
| 1999 European Parliament election: Dublin[7] | |||||||||||
|---|---|---|---|---|---|---|---|---|---|---|---|
| Party | Candidate | % 1st Pref | Count 1 | Count 2 | Count 3 | Count 4 | Count 5 | Count 6 | Count 7 | Count 8 | |
| Fine Gael | Mary Banotti | 20.2 | 56,593 | ||||||||
| Fianna Fáil | Niall Andrews | 15.7 | 44,176 | 44,731 | 45,967 | 46,481 | 47,931 | 50,439 | 71,423 | ||
| Green Party | Patricia McKenna | 12.7 | 35,659 | 37,988 | 39,818 | 43,662 | 48,299 | 54,883 | 56,992 | ||
| Labour Party | Proinsias De Rossa | 10.2 | 28,748 | 29,522 | 29,882 | 31,849 | 37,820 | 41,605 | 43,536 | 47,018 | |
| Fine Gael | Jim Mitchell | 9.9 | 27,873 | 28,483 | 30,402 | 31,296 | 33,845 | 34,942 | 37,051 | 41,489 | |
| Fianna Fáil | Ben Briscoe | 8.9 | 25,065 | 25,457 | 26,917 | 27,322 | 27,727 | 29,616 | |||
| Sinn Féin | Seán Crowe | 6.6 | 18,633 | 19,070 | 19,735 | 21,147 | 21,703 | ||||
| Labour Party | Bernie Malone | 5.7 | 15,890 | 16,570 | 16,982 | 18,272 | |||||
| Socialist Party | Joe Higgins | 3.8 | 10,619 | 11,360 | 11,697 | ||||||
| Christian Solidarity | Gerard Casey | 3.4 | 9,425 | 9,867 | |||||||
| Independent | Ciaran Goulding | 2.0 | 5,546 | ||||||||
| Independent | Adam Goodwin | 0.5 | 1,438 | ||||||||
| Natural Law | John Burns | 0.4 | 1,006 | ||||||||
| Electorate: 793,200 Valid: 280,671 Spoilt: 6,013 (2.1%) Quota: 56,135 Turnout: 286,684 (36.1%) | |||||||||||
1994 election
| 1994 European Parliament election: Dublin[6] | ||||||
|---|---|---|---|---|---|---|
| Party | Candidate | 1st Pref | % | Seat | Count | |
| Green Party | Patricia McKenna | 40,388 | 14.5 | 1 | 10 | |
| Fianna Fáil | Niall Andrews | 36,877 | 13.3 | 2 | 10 | |
| Fine Gael | Mary Banotti | 38,053 | 13.7 | 3 | 12 | |
| Labour Party | Bernie Malone | 22,419 | 8.1 | 4 | 12 | |
| Fine Gael | Jim Mitchell | 28,116 | 10.1 | |||
| Democratic Left | Pat Rabbitte | 24,133 | 8.7 | |||
| Labour Party | Orla Guerin | 16,674 | 6.0 | |||
| Workers' Party | Tomás Mac Giolla | 15,830 | 5.7 | |||
| Fianna Fáil | John Stafford | 12,811 | 4.6 | |||
| Independent | Eamonn Murphy | 9,296 | 3.4 | |||
| Progressive Democrats | Stephen O'Byrnes | 8,212 | 3.0 | |||
| Fianna Fáil | Olive Braiden | 8,237 | 3.0 | |||
| Sinn Féin | Larry O'Toole | 8,190 | 3.0 | |||
| Independent | Paddy Madigan | 6,903 | 2.5 | |||
| Natural Law | John Burns | 1,705 | 0.6 | |||
| Electorate: 755,486 Valid: 277,844 Spoilt: 2,917 (1.0%) Quota: 55,569 Turnout: 280,761 (37.2%) | ||||||
1989 election
| 1989 European Parliament election: Dublin[5] | ||||||
|---|---|---|---|---|---|---|
| Party | Candidate | 1st Pref | % | Seat | Count | |
| Workers' Party | Proinsias De Rossa[nb 4] | 71,041 | 15.8 | 1 | 6 | |
| Fine Gael | Mary Banotti | 50,666 | 11.3 | 2 | 6 | |
| Fianna Fáil | Niall Andrews | 72,057 | 16.1 | 3 | 6 | |
| Labour Party | Barry Desmond | 57,225 | 12.8 | 4 | 12 | |
| Fianna Fáil | Eileen Lemass | 58,345 | 13.0 | |||
| Green Party | Trevor Sargent | 37,317 | 8.3 | |||
| Progressive Democrats | Mary Harney | 36,402 | 8.1 | |||
| Independent | Raymond Crotty | 25,525 | 5.7 | |||
| Fine Gael | Chris O'Malley | 26,574 | 5.9 | |||
| Sinn Féin | Ann Speed | 11,582 | 2.6 | |||
| Independent | Tim Cahill | 1,668 | 0.4 | |||
| Electorate: 711,416 Valid: 448,402 Spoilt: 7,137 (1.6%) Quota: 89,681 Turnout: 455,539 (64.0%) | ||||||
1984 election
| 1984 European Parliament election: Dublin[4] | ||||||
|---|---|---|---|---|---|---|
| Party | Candidate | 1st Pref | % | Seat | Count | |
| Fine Gael | Richie Ryan[nb 3] | 47,014 | 16.6 | 1 | 8 | |
| Fianna Fáil | Eileen Lemass | 31,350 | 11.1 | 2 | 8 | |
| Fine Gael | Mary Banotti | 42,660 | 15.1 | 3 | 8 | |
| Fianna Fáil | Niall Andrews | 32,512 | 11.5 | 4 | 8 | |
| Labour Party | Frank Cluskey | 28,384 | 10.0 | |||
| Fianna Fáil | Jim Tunney | 30,488 | 10.8 | |||
| Workers' Party | Des Geraghty | 19,590 | 6.9 | |||
| Independent | Seán Loftus | 17,385 | 6.2 | |||
| Sinn Féin | John Noonan | 14,604 | 5.2 | |||
| Independent | Shane Ross | 8,099 | 2.9 | |||
| Democratic Socialist Party | John de Courcy Ireland | 5,350 | 1.9 | |||
| Green Party | Christopher Fettes | 5,242 | 1.9 | |||
| Electorate: 704,873 Valid: 282,678 Spoilt: 6,153 (2.1%) Quota: 56,536 Turnout: 288,831 (41.0%) | ||||||
1979 election
| 1979 European Parliament election: Dublin[3] | ||||||
|---|---|---|---|---|---|---|
| Party | Candidate | 1st Pref | % | Seat | Count | |
| Labour Party | John O'Connell[nb 1] | 44,832 | 15.2 | 1 | 8 | |
| Fine Gael | Richie Ryan | 48,411 | 16.4 | 2 | 8 | |
| Labour Party | Michael O'Leary[nb 2] | 34,511 | 11.7 | 3 | 10 | |
| Fianna Fáil | Síle de Valera | 41,357 | 14.0 | 4 | 10 | |
| Fine Gael | Nuala Fennell | 26,951 | 9.1 | |||
| Fianna Fáil | Ruairí Brugha | 21,758 | 7.4 | |||
| Independent | Seán Loftus | 21,769 | 7.4 | |||
| Fine Gael | Maurice Manning | 14,296 | 4.8 | |||
| Fianna Fáil | Michael Yeats | 12,715 | 4.3 | |||
| Sinn Féin (Workers' Party) | Tomás Mac Giolla | 11,915 | 4.0 | |||
| Fianna Fáil | Joe Fox | 8,178 | 2.8 | |||
| Labour Party | Jane Dillon Byrne | 7,807 | 2.6 | |||
| Independent | Kevin Clear | 915 | 0.3 | |||
| Electorate: 618,454 Valid: 295,415 Spoilt: 8,653 (2.9%) Quota: 59,084 Turnout: 304,068 (49.2%) | ||||||
See also
Notes
- 1 2 3 John O'Connell was substituted by John Horgan (LAB / PES) on 21 October 1981. John Horgan resigned on 1 January 1983 and was substituted by Flor O'Mahony (LAB / PES) on 2 March 1983.
- 1 2 3 Michael O'Leary was substituted by Frank Cluskey (LAB / PES) on 1 July 1981. Frank Cluskey was substituted by Brendan Halligan (LAB / PES) on 2 March 1983.
- 1 2 Richie Ryan was substituted by Chris O'Malley (FG / EPP) on 3 June 1986.
- 1 2 Proinsias De Rossa was substituted by Des Geraghty (DL / EUL) on 18 February 1992.
- 1 2 Joe Higgins was substituted by Paul Murphy (SP / GUE/NGL) on 1 April 2011.
- 1 2 Proinsias De Rossa was substituted by Emer Costello (LAB / S&D) in February 2012.
References
- ↑ "European Assembly Elections Act, 1977: Schedule (Constituencies)". Irish Statute Book database. Retrieved 22 November 2011.
- ↑ "European Parliament Elections (Amendment) Act 2014". Irish Statute Book database. Retrieved 14 December 2015.
- 1 2 "1979 European Parliament election – Dublin constituency". ElectionsIreland.org. Retrieved 23 August 2010.
- 1 2 "1984 European Parliament election – Dublin constituency". ElectionsIreland.org. Retrieved 23 August 2010.
- 1 2 "1989 European Parliament election – Dublin constituency". ElectionsIreland.org. Retrieved 23 August 2010.
- 1 2 "1994 European Parliament election – Dublin constituency". ElectionsIreland.org. Retrieved 23 August 2010.
- 1 2 "1999 European Parliament election – Dublin constituency". ElectionsIreland.org. Retrieved 3 January 2010.
- 1 2 "2004 European Parliament election – Dublin constituency". ElectionsIreland.org. Retrieved 22 March 2009.
- 1 2 "2009 European Parliament election – Dublin constituency". ElectionsIreland.org. Retrieved 21 April 2009.
- 1 2 "2014 European Parliament election – Dublin constituency". ElectionsIreland.org. Retrieved 29 April 2014.
- ↑ "Nominations close for Europe elections". RTÉ News. 11 May 2009. Retrieved 12 May 2009.