North Allegheny School District
| North Allegheny School District | |
|---|---|
 | |
| Address | |
|
200 Hillvue Lane Pittsburgh, Pennsylvania, Allegheny County 15237-5344 United States | |
| Information | |
| Type | Public |
| School board | 9 locally elected members |
| Superintendent |
Current:Dr. Robert J Scherrer, Former:Dr. Raymond Gualteri(contr act 2011-July 2013) salary $174,942 (2012)[1] |
| School number | 412-366-2100 |
| Administrator |
Dr. Tammy A Andreyko, Asst Super. Academic Advancement (2013-18) |
| Principal | Sieminski, Walter, SHS salary $119,561 (2012) |
| Staff | 551 non teaching staff (2011) |
| Faculty | 581 teachers 2011[2] |
| Grades | K-12 |
| Age | 5 years old to 21 years special education |
| Enrollment | 8,187 pupils 2013, 8,190 pupils (2012),[3] 8,047 (2009-10),[4] 8,012 pupils (2007)[5] |
| • Kindergarten | 494 |
| • Grade 1 | 615 |
| • Grade 2 | 591 |
| • Grade 3 | 638 |
| • Grade 4 | 593 |
| • Grade 5 | 605 |
| • Grade 6 | 661 |
| • Grade 7 | 638 |
| • Grade 8 | 679 |
| • Grade 9 | 696 |
| • Grade 10 | 699 |
| • Grade 11 | 629 |
| • Grade 12 | 649 |
| • Other | Enrollment projected to be 7,747 pupils in 2020[6] |
| Budget | $126.4 million 2012-13 [7] |
| Per pupil spending | $15,710 (2008) |
| Per pupil spending | $14,585.70 (2011) |
| Website | northallegheny.org |
 | |
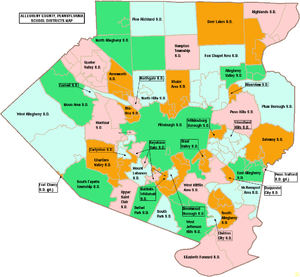
North Allegheny School District (NA or NASD) is a large, suburban public school district located in Wexford, Allegheny County, Pennsylvania, United States, about 12 miles (19 km) north of Pittsburgh. It serves an area of 48 square miles (120 km2), including Marshall Township, McCandless Township, and the boroughs of Bradford Woods and Franklin Park. According to 2000 federal census data, it serves a resident population of 47,531. By 2010, the District's population increased to 50,023 people.[8] In 2009, the District residents' per capita income was $35,130, while the median family income was $81,636.[9] In the Commonwealth, the median family income was $49,501 [10] and the United States median family income was $49,445, in 2010.[11] By 2013, the median household income in the United States rose to $52,100.[12]
According to District officials, in school year 2009-10, North Allegheny School District provided basic educational services to 8,064 pupils. It employed: 637 teachers, 431 full-time and part-time support personnel, and 37 administrators. North Allegheny School District received more than $21.4 million in state funding in school year 2009-10. In school year 2007–08, the District provided basic educational services to 8,054 pupils through the employment of 622 teachers, 408 full-time and part-time support personnel, and 38 administrators. The North Allegheny School District received more than $19.8 million in state funding in school year 2007–08.
Schools in the North Allegheny School District include:
- 7 Elementary schools (K-5)
- Bradford Woods Elementary School
- Franklin Elementary School
- Hosack Elementary School
- Ingomar Elementary School
- Marshall Elementary School
- McKnight Elementary School
- Peebles Elementary School
- 5 Secondary schools
- Carson Middle School (6-8)
- Ingomar Middle School
- Marshall Middle School
- North Allegheny Intermediate High School (9 & 10)
- North Allegheny Senior High School (11 & 12)
North Allegheny School District operates a Cyber Academy which is an online alternative open to students in grades 3rd through 8th.
Six of North Allegheny School District's schools (both high schools, all three middle schools, and an elementary school) have received the National Blue Ribbon School of Excellence award. The Senior High School offers 17 Advanced Placement courses, and both high schools offer a combined 32 honors courses. The class of 2008 had 19 National Merit Finalists.[13] In 2014 North Allegheny was ranked by Niche as the 9th best school district in America and the 3rd best in Pennsylvania. North Allegheny Senior High School was ranked by Niche as the 33rd best public high school in America and 2nd best in the state.
North Allegheny Senior High school students may choose to attend A W Beattie Career Center for training in the vocational trades. The Allegheny Intermediate Unit IU3 provides the district with a wide variety of services like specialized education for disabled students and hearing, speech and visual disability services and professional development for staff and faculty.
Governance
As with most other Pennsylvania public school districts, North Allegheny School District is governed by 9 individually elected board members (serve without compensation for a term of four years), the Pennsylvania State Board of Education, the Pennsylvania Department of Education and the Pennsylvania General Assembly.[14] The federal government controls programs it funds like: Title I funding for low income children in the Elementary and Secondary Education Act and the No Child Left Behind Act, which mandates the district focus resources on student success in acquiring reading and math skills. The Superintendent and Business Manager are appointed by the school board. The Superintendent is the chief administrative officer with overall responsibility for all aspects of operations, including education and finance. The Business Manager is responsible for budget and financial operations. Neither of these officials are voting members of the School Board. The School Board enters into individual employment contracts for these positions. In Pennsylvania, public school districts are required to give 150 days notice to the Superintendent regarding renewal of the employment contract.
The Commonwealth Foundation for Public Policy Alternatives Sunshine Review gave the school board and district administration a "D-" for transparency based on a review of "What information can people find on their school district's website". It examined the school district's website for information regarding; taxes, the current budget, meetings, school board members names and terms, contracts, audits, public records information and more.[15]
Academic achievement
- Statewide school district ranking (from national website, based solely on PSSA test scores)[16]
2015- 11th of 587
- Statewide high school ranking (from national website, based solely on PSSA test scores)[17]
2015- 19th of 681
- Statewide SAT ranking[18]
- 2015- 13th, average score of 1715
- 2014- 12th, average score of 1712
AYP History
Each year from 2003 through 2012, North Allegheny School District achieved Adequate Yearly Progress (AYP) status.[19] In 2011, 94 percent of the 500 Pennsylvania public school districts achieved the No Child Left Behind Act progress level of 72% of students reading on grade level and 67% of students demonstrating on grade level math. In 2011, 46.9 percent of Pennsylvania school districts achieved Adequate Yearly Progress (AYP) based on student performance. An additional 37.8 percent of school districts made AYP based on a calculated method called safe harbor, 8.2 percent on the growth model and 0.8 percent on a two-year average performance.
Graduation rate
In 2013, the graduation rate at North Allegheny School District was 98.9%.[20] In 2012, the graduation rate at North Allegheny School District was 97%.[21] In 2011, North Allegheny School District's graduation rate was 99%.[22] In 2010, the Pennsylvania Department of Education issued a new, 4-year cohort graduation rate. North Allegheny School District's rate was 98% for 2010.[23]
According to traditional graduation rate calculations:
- US News and World Report national ranking
In 2013, US News and World Report ranked 21,000 public high schools, in the United States, based on three factors. First, the schools were analyzed for the number of students who achieved above the state average on the reading and math tests in 2008. Then they considered how the economically disadvantaged students performed against the state average. Finally, they considered the participation rate and the performance of students in college readiness by examining Advanced Placement (AP) and International Baccalaureate test data. Seventy Pennsylvania high schools achieved ranking bronze, silver or gold rating. In 2013, North Allegheny Senior High School achieved a rank of 605th out of 21,035 United States high schools. North Allegheny Senior High School was rated silver and was 12th among 168 Pennsylvania high schools which achieved listing status.[27] In 2008, fifty three Pennsylvania high schools achieved bronze.[28] North Allegheny Senior High School achieved Silver ranking in 2009.
- School Performance Profile
In 2013, North Allegheny Senior High School achieved 94.1 out of 100. Reflects on grade level reading, mathematics and science achievement. In reading/literature - 95% were on grade level. In Algebra 1, 90% showed on grade level skills. In Biology, 69% showed on grade level science understanding.[29] According to the Pennsylvania Department of Education, 2,181 public schools (less than 73 percent of Pennsylvania public schools), achieved an academic score of 70 or higher. Pennsylvania 11th grade students no longer take the PSSAs. Instead, they now take the Keystone Exams at the end of the associated course.
Science in Motion North Allegheny Senior High School did not take advantage of a state program called Science in Motion which brought college professors and sophisticated science equipment to the school to raise science awareness and to provide inquiry-based experiences for the students. The Science in Motion program was funded by a state appropriation and cost the school nothing to participate.[30] Westminster College provided the science enrichment experiences to schools in the region.
SAT scores
In 2013, North Allegheny School District students took the SAT exams. The District's Verbal Average Score was 571. The Math average score was 588. The Writing average score was 568. The College Board reported that statewide scores were: 494 in reading, 504 in math and 482 in writing. The nationwide SAT results were the same as in 2012.[31]
In 2012, 572 North Allegheny School District students took the SAT exams. The District's Verbal Average Score was 566. The Math average score was 582. The Writing average score was 557. The statewide Verbal SAT exams results were: Verbal 491, Math 501, Writing 480. In the USA, 1.65 million students took the exams achieving scores: Verbal 496, Math 514, Writing 488. According to the College Board the maximum score on each section was 800, and 360 students nationwide scored a perfect 2,400.
In 2011, 567 students at North Allegheny School District took the SAT exams. The district's Verbal Average Score was 563. The Math average score was 577. The Writing average score was 554.[32] Pennsylvania ranked 40th among states with SAT scores: Verbal - 493, Math - 501, Writing - 479.[33] In the United States, 1.65 million students took the exam in 2011. They averaged 497 (out of 800) verbal, 514 math and 489 in writing.[34]
AP Courses
In 2013, North Allegheny Senior High School offered 18 Advanced Placement (AP) courses at a higher cost than regular courses. Students have the option of taking College Board approved courses and then taking the College Board's examination in the Spring. Students, who achieve a 3 or better on the exam, may be awarded college credits at US universities and colleges. Each higher education institution sets its own standards about what level of credits are awarded to a student based on their AP exam score. Most higher education give credits for scores of 4 or 5. Some schools also give credits for scores of 3. High schools give credits towards graduation to students who take the school's AP class. At North Allegheny Senior High School 100% of students who took an AP course earned a 3 or better on the exam.[35]
Intermediate High School
North Allegheny Intermediate High School is located at 350 Cumberland Road, Pittsburgh. According to the National Center for Education Statistics, in 2014, the school reported an enrollment of 1,415 pupils in grades 9th and 10th, with 46 pupils eligible for a federal free or reduced-price lunch. The school employed 95 teachers, yielding a student–teacher ratio of 13:1.[36] According to a report by the Pennsylvania Department of Education, 100% of its teachers were rated "Highly Qualified" under No Child Left Behind.[37]
In 2010 and 2011, North Allegheny Intermediate High School achieved AYP status. This school is a "Feeder School", which means it contains only grades below 3rd grade or only untested grades (9-10, 12), and does not get tested for AYP. As this school feeds into schools that are held accountable because of their 11th grade PSSA results, this school receives AYP results based on the district's results. Since the district's 11th grade met the thresholds in math and reading, then this feeder school was identified as having met AYP.[38]
Marshall Middle School
Marshall Middle School is located at 5145 Wexford Run Road, Wexford. According to the National Center for Education Statistics, in 2010, the school reported an enrollment of 647 pupils in grades 6th through 8th, with 12 pupils receiving a federal free or reduced-price lunch due to family poverty. The school employed 52 teachers, yielding a student–teacher ratio of 12:1.[39] According to a report by the Pennsylvania Department of Education, 2 teachers were rated "Non‐Highly Qualified" under No Child Left Behind.[40]
In 2009, the 8th grade was ranked 2nd out of 141 western Pennsylvania middle schools based on three years of student academic achievement in PSSAs in: reading, math writing and one year of science.[41] (Includes schools in: Allegheny County, Beaver County, Butler County, Fayette County, Westmoreland County, and Washington County
In 2012, Marshal Middle School declined to Warning status due to lagging achievement among special education students.[42] In 2010 and 2011, Marshall Middle School achieved AYP status.[43]
- PSSA Results
- 8th Grade Reading:
- 2012 - 100% on grade level (92% advanced). In Pennsylvania, 79% of 8th graders on grade level.[44]
- 2011 - 98% (91% advanced). State - 81.8% [45]
- 2010 – 96% (85% advanced) (2% below basic). State - 81% [46]
- 2009 – 98%, 86% advanced (1% below basic), State – 80% [47]
- 8th Grade Math:
- 2012 - 94% on grade level (81% advanced). State - 76% [48]
- 2011 - 94%, 74% advanced (3% below basic). State - 76.9%
- 2010 – 96%, 78% advanced (1% below basic). State - 75% [49]
- 2009 – 94%, 77% advanced (1% below basic), State – 71% [50]
- 8th Grade Science:
- 2012 - 90% on grade level 50% advanced. State - 59%
- 2011 - 90%, 50% advanced (4% below basic). State – 58.3%
- 2010 – 85%, 49% advanced (4% below basic). State – 57%
- 2009 – 92%, 54% advanced (3% below basic), State – 55% [51]
|
|
|
|
Ingomar Middle School
Ingomar Middle School is located at 1521 Ingomar Heights Road, Pittsburgh. According to the National Center for Education Statistics, in 2010, the school reported an enrollment of 569 pupils in grades 6th through 8th, with 19 pupils receiving a federal free or reduced-price lunch due to family poverty. The school employed 45 teachers, yielding a student–teacher ratio of 12:1.[52] According to a report by the Pennsylvania Department of Education, 100% of its teachers were rated "Highly Qualified" under No Child Left Behind.[53]
In 2009, the 8th grade was ranked 4th out of 141 western Pennsylvania middle schools based on three years of student academic achievement in PSSAs in: reading, math writing and one year of science.[41] (Includes schools in: Allegheny County, Beaver County, Butler County, Fayette County, Westmoreland County, and Washington County

In 2010 through 2012, Ingomar Middle School achieved AYP status.[54]
- PSSA Results
- 8th Grade Reading:
- 2012 - 99%, 91% advanced. State - 79% [44]
- 2011 - 100%, 90% advanced. State - 81.8% [55]
- 2010 – 95%, 87% advanced (3% below basic). State - 81% [56]
- 2009 – 97%, 86% advanced (2% below basic), State – 80% [57]
- 8th Grade Math:
- 2012 - 97% on grade level83% advanced. State - 76% [58]
- 2011 - 95%, 79% advanced. State - 76.9%
- 2010 – 95%, 81% advanced. State - 75% [49]
- 2009 – 93% (4% below basic). State – 71% [50]
- 8th Grade Science:
- 2012 - 89%, 56% advanced. State - 59%
- 2011 - 89%, 57% advanced (3% below basic). State – 58.3%
- 2010 – 87%, 53% advanced (6% below basic). State – 57%
- 2009 – 81%, 49% advanced (6% below basic), State – 55%
|
|
|
|
Carson Middle School
Carson Middle School is located at 200 Hillvue Lane, Pittsburgh. According to the National Center for Education Statistics, in 2010, the school reported an enrollment of 720 pupils in grades 6th through 8th, with 55 pupils receiving a federal free or reduced-price lunch due to family poverty. The school employed 57 teachers, yielding a student–teacher ratio of 12:1.[59] According to a report by the Pennsylvania Department of Education, 100% of its teachers were rated "Highly Qualified" under No Child Left Behind.[60]
In 2009, the 8th grade was ranked 7th out of 141 western Pennsylvania middle schools based on three years of student academic achievement in PSSAs in: reading, math writing and one year of science.[41] (Includes schools in: Allegheny County, Beaver County, Butler County, Fayette County, Westmoreland County, and Washington County

In 2010 and 2011, Carson Middle School achieved AYP status.[61]
- PSSA Results
- 8th Grade Reading:
- 2011 - 98% on grade level, 85% advanced (1% below basic). State - 81.8% [62]
- 2010 – 98%, 85% advanced (1% below basic). State - 81% [63]
- 2009 – 97%, 84% advanced (2% below basic), State – 80% [64]
- 8th Grade Math:
- 2011 - 90%, 71% advanced (3% below basic). State - 76.9%
- 2010 – 95%, 75% advanced (1% below basic). State - 75% [49]
- 2009 – 92%, 76% advanced (2% below basic), State – 71% [50]
- 8th Grade Science:
- 2011 - 78%, 42% advanced (9% below basic). State – 58.3% of 8th graders were on grade level.
- 2010 – 84%, 38% advanced (5% below basic). State – 57%
- 2009 – 86%, 48% advanced (6% below basic), State – 55% [51]
|
|
|
|
Special education
In December 2010, North Allegheny School District administration reported that 763 pupils or 9.4% of the district's pupils received Special Education services, with 42% of identified students having a specific learning disability. In December 2009, the district administration reported that 781 pupils or 9.7% of the district's pupils received Special Education services.[65]
In 2010, the state of Pennsylvania provided $1,026,815,000 for special education services. The funds were distributed to districts based on a state policy which estimates that 16% of the district's pupils are receiving special education services. This funding is in addition to the state's basic education per pupil funding, as well as, all other state and federal funding.[66]
North Allegheny School District received a $3,633,946 supplement for special education services in 2010.[67] For the 2011-12 and 2012-13 school year, all Pennsylvania public school districts received the same level of funding for special education that they received in 2010-11. This level funding is provided regardless of changes in the number of pupils who need special education services and regardless of the level of services the respective students required.[68][69]
Gifted education
North Allegheny School District Administration reported that 1,246 or 15.54% of its students were gifted in 2009. This was the highest percentage of gifted students reported among all 500 school districts and 100 public charter schools in Pennsylvania. The second highest percentage of gifted students were enrolled at Radnor Township School District at 12.95% of students.[70] By law, the district must provide mentally gifted programs at all grade levels. The referral process for a gifted evaluation can be initiated by teachers or parents by contacting the student’s building principal and requesting an evaluation. All requests must be made in writing. To be eligible for mentally gifted programs in Pennsylvania, a student must have a cognitive ability of at least 130 as measured on a standardized ability test by a certified school psychologist. Other factors that indicate giftedness will also be considered for eligibility.[71][72]
Budget
Pennsylvania public school districts budget and expend funds according to procedures mandated by the General Assembly and the Pennsylvania Department of Education (PDE). An annual operating budget is prepared by school district administrative officials. A uniform form is furnished by the PDE and submitted to the board of school directors for approval prior to the beginning of each fiscal year on July 1.
Under Pennsylvania’s Taxpayer Relief Act, Act 1 of the Special Session of 2006, all school districts of the first class A, second class, third class and fourth class must adopt a preliminary budget proposal. The proposal must include estimated revenues and expenditures and the proposed tax rates. This proposed budget must be considered by the Board no later than 90 days prior to the date of the election immediately preceding the fiscal year. The preliminary budget proposal must also be printed and made available for public inspection at least 20 days prior to its adoption. The board of school directors may hold a public hearing on the budget, but are not required to do so. The board must give at least 10 days’ public notice of its intent to adopt the final budget according to Act 1 of 2006.[73]
In 2012, the average teacher salary in North Allegheny School District was $72,831.99 a year, while the cost of the benefits teachers received was $23,581 per employee, for a total annual average teacher compensation of $96,413.96.[74] The District employed 658 teachers with a top salary of $174,942.[75]
In 2011, the average teacher salary in North Allegheny School District was $71,430 a year, while the cost of the benefits teachers receive was $20,075 per employee, for a total annual average teacher compensation of $91,506.[76]
In 2009, North Allegheny School District reported employing 807 teachers and administrators with a median salary of $71,547 and a top salary of $184,875.[77] The teacher’s work day is seven hours forty five minutes, for 195 days (184 teaching days) in the contract year. Additionally, the teachers receive a defined benefit pension, health insurance (employee pays up to $125 per month), dental insurance, vision insurance, life insurance, disability insurance, professional development reimbursement, 3 paid personal days, 10 paid sick days, and other benefits. Teachers who contract a communicable childhood disease (even when employee is unvaccinated) will receive full pay and benefits with no deduction of sick days while out sick. Teachers are paid $35 per hour for required work out side of regular work day.[78][79] In 2011, the average teacher salary in North Allegheny School District was $71,430.68 a year, while the cost of the benefits teachers receive was $20,076.42 per employee, for a total annual average teacher compensation of $91,506.11.[80] According to a study conducted at the American Enterprise Institute, in 2011, public school teachers’ total compensation is roughly 50 percent higher than they would likely receive in the private sector. The study found that the most generous benefits that teachers receive are not accounted for in many studies of compensation, including: pension, retiree health benefits and job security.[81]
In 2007, the average teacher salary in the district was $71,181 for 180 days worked. The North Allegheny School District ranked first in Allegheny County for average teacher salary in 2007. The average teacher salary in the commonwealth was $54,977.[82]
Per pupil spending North Allegheny School District's administrative costs, in 2008, were $910 per pupil which ranked 96th out of Pennsylvania's 501 public school districts. The lowest administrative cost per pupil in Pennsylvania was $398 per pupil.[83] In June 2012, the school board eliminated the position of coordinator of academic technology to lower administrative costs.[84]
In 2008, the North Allegheny School District administration reported that per pupil spending was $15,710 which ranked 47th among Pennsylvania's 501 school districts. In 2010, the per pupil spending was $14,455.09.[85] Among the states, Pennsylvania’s total per pupil revenue (including all sources) ranked 11th at $15,023 per student, in 2008-09.[86] In 2007, the Pennsylvania per pupil total expenditures was $12,759.[87] The U.S. Census Bureau reports that Pennsylvania spent $8,191 per pupil in school year 2000-01.[88]
Reserves In 2008, North Allegheny School District reported an unreserved designated fund balance of $5,922,836.00 and an unreserved-undesignated fund balance of $10,985,345.[89] In 2010, North Allegheny Administration reported an increase to $7,283,157 in the unreserved-undesignated fund balance and $6,552,164 in its unreserved designated fund for a total of over $13.8 million in reserves. By 2013, the District's reserves had grown to $14,886,568.[90] Pennsylvania school district reserve funds are divided into two categories – designated and undesignated. The undesignated funds are not committed to any planned project. Designated funds and any other funds, such as capital reserves, are allocated to specific projects. School districts are required by state law to keep 5 percent of their annual spending in the undesignated reserve funds to preserve bond ratings. According to the Pennsylvania Department of Education, from 2003 to 2010, as a whole, Pennsylvania school districts amassed nearly $3 billion in reserved funds.[91]
Audits In January 2013, the Pennsylvania Auditor General conducted a performance audit of the North Allegheny School District. The findings were reported to the School Board and the District’s administration. It noted that the Board and administration had address citations noted in previous audits.[92] In January 2010, the Pennsylvania Auditor General conducted a performance audit of the North Allegheny School District. The findings were reported to the School Board and the District’s administration.[93]
Tuition Students who live in the North Allegheny School District's attendance area may choose to attend one of Pennsylvania's 157 public charter schools. A student living in a neighboring public school district or a foreign exchange student may seek admission to Area School District. For these cases, the Pennsylvania Department of Education sets an annual tuition rate for each school district. It is the amount the public school district pays to a charter school for each resident student that attends the charter and it is the amount a nonresident student's parents must pay to attend the District's schools. The 2012 tuition rates are Elementary Schools - $11,420.60, Middle/High Schools - $11,375.94.[94]
The North Allegheny School District is funded by a combination of: a local earned income tax 1/2%, a property tax, a real estate transfer tax 0.5%, coupled with substantial funding from the Commonwealth of Pennsylvania and the federal government.[95] Interest earnings on reserved accounts also provide nontax income to the district. In the Commonwealth of Pennsylvania, pension income and Social Security income are exempted from state personal income tax and local earned income tax, regardless of the level of the individual’s personal wealth.[96]
State basic education funding
According to a report from Representative Todd Stephens office, School District receives 14.4% of its annual revenue from the state.[97]
For the 2013-14 school year, the North Allegheny School District received a 3.6% increase or $8,777,694 in Pennsylvania Basic Education Funding. This is $309,082 more than its 2012-13 state BEF to the District. Additionally, North Allegheny School District received $147,087 in Accountability Block Grant funding to focus on academic achievement and level funding for special education services. Among the public school districts in Allegheny County, South Fayette Township School District received the highest percentage increase in BEF at 5.5%. The District has the option of applying for several other state and federal grants to increase revenues. The Commonwealth’s budget increased Basic Education Funding statewide by $123 million to over $5.5 billion. Most of Pennsylvania’s 500 public school districts received an increase of Basic Education Funding in a range of 0.9% to 4%. Eight public school districts received exceptionally high funding increases of 10% to 16%. The highest increase in state funding was awarded to Austin Area School District which received a 22.5% increase in Basic Education Funding.[98] The highest percent of state spending per student is in the Chester-Upland district, where roughly 78 percent comes from state coffers. In Philadelphia, it is nearly 49 percent.[99] As a part of the education budget, the state provided the PSERS (Pennsylvania school employee pension fund) with $1,017,000,000 and Social Security payments for school employees of $495 million.[100]
For the 2012-13 school year, North Allegheny School District received $8,615,699.[101] The Governor's Executive Budget for 2012-2013 includes $9.34 billion for kindergarten through 12th grade public education, including $5.4 billion in basic education funding, which is an increase of $49 million over the 2011-12 budget. The state also provides $100 million for the Accountability Block grant. North Allegheny School District received $147,087 in Accountability Block Grant funding to focus on academic achievement. The state provided $544.4 million for School Employees’ Social Security and $856 million for School Employees’ Retirement fund called PSERS.[102] This amount is a $21,823,000 increase (0.34%) over the 2011-2012 appropriations for Basic Education Funding, School Employees' Social Security, Pupil Transportation, Nonpublic and Charter School Pupil Transportation. Since taking office, Corbett’s first two budgets have restored more than $918 million in support of public schools, compensating for the $1 billion in federal stimulus dollars lost at the end of the 2010-11 school year.
In 2011-12, North Allegheny School District received a $8,468,612 allocation, of state Basic Education Funding.[103][104] Additionally, the North Allegheny School District received $147,087 in Accountability Block Grant funding. The enacted Pennsylvania state Education budget included $5,354,629,000 for the 2011-2012 Basic Education Funding appropriation. This amount is a $233,290,000 increase (4.6%) over the enacted State appropriation for 2010-2011.[105] The highest increase in state basic education funding was awarded to Duquesne City School District, which got a 49% increase in state funding for 2011-12.[106]
In the 2010-11 budget year, the Commonwealth of Pennsylvania provided a 2% increase in Basic Education Funding (BEF) for a total of $8,810,745 to North Allegheny School District. Among Allegheny County's 43 public school districts, the highest increase went to South Fayette Township School District an 11.32% increase in BEF. One hundred fifty Pennsylvania school districts received the base 2% increase. The highest increase in 2010-11 went to Kennett Consolidated School District in Chester County which received a 23.65% increase in state funding.[107] The state's hold harmless policy regarding state basic education funding continued where each district received at least the same amount as it received the prior school year, even where enrollment had significantly declined. The amount of increase each school district received was set by Governor Edward Rendell and then Secretary of Education Gerald Zahorchak, as a part of the state budget proposal given each February. This was the second year of Governor Rendell’s policy to fund some districts at a far greater rate than others.
In the 2009–10 budget year, the Commonwealth of Pennsylvania provided a 2% increase in Basic Education Funding to North Allegheny School District, for a total of $8,637,984. This was the lowest percentage point increase, in Basic Education Funding, for the school districts in Allegheny County and in the Commonwealth of Pennsylvania. Four Allegheny County public school districts received increases of over 6% in Basic Education Funding in 2009–10. Chartiers Valley School District received an 8.17% increase. In Pennsylvania, over 15 school districts received Basic Education Funding increases in excess of 10% in 2009. Muhlenberg School District in Berks County received the highest with a 22.31% increase in funding. The amount of increase each school district received was determined by Governor Edward G. Rendell and the Secretary of Education Gerald Zahorchak through the allocation made in the budget proposal made in February each year.[108]
The state Basic Education Funding to the North Allegheny School District in 2008-09 was $8,468,612.46.[109] According to the Pennsylvania Department of Education, 243 district students received free or reduced- price lunches due to low family income in the 2007–2008 school year.[110] According to the U.S. Census Bureau, Pennsylvania spent $7,824 Per Pupil in the year 2000. This amount increased up to $12,085 by the year 2008.[111][112] In 2007-08, the District received $8,221,953.84 from the state in Basic Education Funding.
Accountability Block Grants
Beginning in 2004-2005, the state launched the Accountability Block Grant school funding. This program has provided $1.5 billion to Pennsylvania’s school districts. The Accountability Block Grant program requires that its taxpayer dollars are focused on specific interventions that are most likely to increase student academic achievement. These interventions include: teacher training, all-day kindergarten, lower class size K-3rd grade, literacy and math coaching programs that provide teachers with individualized job-embedded professional development to improve their instruction, before or after school tutoring assistance to struggling students. For 2010-11, North Allegheny School District applied for and received $399,231 in addition to all other state and federal funding. The district uses the funding to implement Research-Based Improvement Strategies for the 7th year.[113][114]
Classrooms for the Future grant
The Classroom for the Future state program provided districts with hundreds of thousands of extra state funding to buy laptop computers for each core curriculum high school class (English, Science, History, Math) and paid for teacher training to optimize the computers use. The program was funded from 2006-2009. North Allegheny School District did not apply to participate in the grant program in 2006-07. In 2007-08 the district received $427,158. The district received $77,938 in 2008-09 for a total funding of $505,096[115] In Allegheny County, the highest award $835,286 was given to Highlands School District. The highest funding statewide was awarded to Philadelphia City School District in Philadelphia County - $9,409,073. In 2010, Classrooms for the Future funding was curtailed statewide due to a massive state financial crisis.
Safe Schools Grant
In 2014, North Allegheny School District received a Safe Schools Initiative Targeted Grant of $25,000, which was used to offset costs for ongoing security upgrades at its 14 buildings.[116] According to the Pennsylvania Department of Education, North Allegheny School District is one of 110 public school districts and public charter schools sharing $2.6 million in competitive grants, to be used to prevent and reduce violence. The Districts has completed a $368,845 safety upgrade project which included videophones for building-access.
Other grants
The North Allegheny School District did not participate in: Pennsylvania Department of Environmental Protection's Environmental Education annual grants, PA Science Its Elementary grants (discontinued effective with 2009-10 budget by Governor Rendell), Education Assistance Grants, 2012 Striving Readers Comprehensive Literacy grant, 2012 and 2013 nor Pennsylvania Hybrid Learning Grants,[117] nor the federal 21st Century Learning grants.
Federal Stimulus grant
North Allegheny School District received $2,132,150 in ARRA – Federal Stimulus money to be used in specific programs like special education and meeting the academic needs of low-income students.[118] The funding was limited to the 2009-10 and 2010-2011 school years.[119] Due to the temporary nature of the funding, schools were repeatedly advised to use the funds for one-time expenditures like acquiring equipment, making repairs to buildings, training teachers to provide more effective instruction or purchasing books and software.
Race to the Top grant
North Allegheny School District officials did not apply for the federal Race to the Top grant which would have provided additional federal funding to improve student academic achievement.[120] Participation required the administration, the school board and the local teachers' union to sign an agreement to prioritize improving student academic success. In Pennsylvania, 120 public school districts and 56 charter schools agreed to participate.[121] Pennsylvania was not approved for the grant. The failure of districts to agree to participate was cited as one reason that Pennsylvania was not approved.[122][123][124]
Real estate taxes
Property tax rates in 2013-14 were set by the school board at 17.4039 mills. A mill is $1 of tax for every $1,000 of a property's assessed value. Irregular property reassessments have become a serious issue in the commonwealth as it creates a significant disparity in taxation within a community and across a region.[125] Property taxes, in the Commonwealth of Pennsylvania, apply only to real estate - land and buildings. The property tax is not levied on cars, business inventory, or other personal property. Certain types of property are exempt from property taxes, including: places of worship, places of burial, private social clubs, charitable and educational institutions and government property. Additionally, service related, disabled US military veterans may seek an exemption from paying property taxes. Pennsylvania school district revenues are dominated by two main sources: 1) Property tax collections, which account for the vast majority (between 75-85%) of local revenues; and 2) Act 511 tax collections, which are around 15% of revenues for school districts.[126] When the school district includes municipalities in two counties, each of which has different rates of property tax assessment, a state board equalizes the tax rates between the counties.[127] In 2010, miscalculations by the State Tax Equalization Board (STEB) were widespread in the Commonwealth and adversely impacted funding for many school districts, including those that did not cross county borders.[128]
The average yearly property tax paid by Allegheny County residents amounts to about 4.09% of their yearly income. Allegheny County ranked 209th out of the 3143 United States counties for property taxes as a percentage of median income.[135] According to a report prepared by the Pennsylvania Department of Education, the total real estate taxes collected by all school districts in Pennsylvania rose from $6,474,133,936 in 1999-00 to $10,438,463,356 in 2008-09 and to $11,153,412,490 in 2011.[136] Property taxes in Pennsylvania are relatively high on a national scale. According to the Tax Foundation, Pennsylvania ranked 11th in the U.S. in 2008 in terms of property taxes paid as a percentage of home value (1.34%) and 12th in the country in terms of property taxes as a percentage of income (3.55%).[137]
Act 1 Adjusted Index
The Act 1 of 2006 Index regulates the rates at which each school district can raise property taxes in Pennsylvania. Districts are not allowed to raise taxes above that index unless they allow voters to vote by referendum, or they seek an exception from the state Department of Education. The base index for the 2011-2012 school year is 1.4 percent, but the Act 1 Index can be adjusted higher, depending on a number of factors, such as property values and the personal income of district residents. Act 1 included 10 exceptions, including: increasing pension costs, increases in special education costs, a catastrophe like a fire or flood, increase in health insurance costs for contracts in effect in 2006 or dwindling tax bases. The base index is the average of the percentage increase in the statewide average weekly wage, as determined by the PA Department of Labor and Industry, for the preceding calendar year and the percentage increase in the Employment Cost Index for Elementary and Secondary Schools, as determined by the Bureau of Labor Statistics in the U.S. Department of Labor, for the previous 12-month period ending June 30. For a school district with a market value/personal income aid ratio (MV/PI AR) greater than 0.4000, its index equals the base index multiplied by the sum of .75 and its MV/PI AR for the current year.[138] In June 2011, the Pennsylvania General Assembly eliminated six of the ten exceptions to the Act 1 Index.[139] Several exceptions were maintained: 1) costs to pay interest and principal on indebtedness incurred prior to September 4, 2004 for Act 72 schools and prior to June 27, 2006 for non-Act 72 schools; 2) costs to pay interest and principal on electoral debt; 3) costs incurred in providing special education programs and services (beyond what is already paid by the State); and 4) costs due to increases of more than the Index in the school’s share of payments to PSERS (PA school employees pension fund) taking into account the state mandated PSERS contribution rate.[140][141]
A specific timeline for Act I Index decisions is published annually, by the Pennsylvania Department of Education.[142]
The School District Adjusted Index for the North Allegheny School District 2006-2007 through 2011-2012.[143]
|
For the 2013-14 budget year, North Allegheny School Board applied for two exceptions to exceed their Act 1 Index limit: rapidly escalating pension income and special education costs. For the school budget year 2013-14, 311 Pennsylvania public school districts adopted a resolution certifying that tax rates would not be increased above their index. Another 171 school districts adopted a preliminary budget leaving open the option of exceeded the Index limit. For the exception for pension costs, 89 school districts received approval to exceed the Index in full while others received a partial approval of their request. For special education costs, 75 districts received approval to exceed their tax limit. For the pension costs exception, 169 school districts received approval to exceed the Index. Eleven Pennsylvania public school districts received an approval for grandfathered construction debts.[147]
For the 2012-13 budget year, North Allegheny School Board applied for 2 exceptions to exceed the Act 1 Index: special education costs and pension costs. For 2012-2013, 274 school districts adopted a resolution certifying that tax rates would not be increased above their index; 223 school districts adopted a preliminary budget leaving open the option of exceeded the Index limit. For the exception for pension costs, 194 school districts received approval to exceed the Index. For special education costs, 129 districts received approval to exceed the tax limit. For the exception for pension costs, 194 school districts received approval to exceed the Index. For special education costs, 129 districts received approval to exceed the tax limit.[148]
For the 2011-12 school year, the North Allegheny School Board applied for three exceptions to exceed the Act 1 Index: Maintenance of Selected Revenue, special education costs and teacher pension costs. Each year, the North Allegheny School Board has the option of adopting either 1) a resolution in January certifying they will not increase taxes above their index or 2) a preliminary budget in February. A school district adopting the resolution may not apply for referendum exceptions or ask voters for a tax increase above the inflation index. A specific timeline for these decisions is published annually, by the Pennsylvania Department of Education.[142]
According to a state report, for the 2011-2012 school year budgets, 247 school districts adopted a resolution certifying that tax rates would not be increased above their index; 250 school districts adopted a preliminary budget. Of the 250 school districts that adopted a preliminary budget, 231 adopted real estate tax rates that exceeded their index. Tax rate increases in the other 19 school districts that adopted a preliminary budget did not exceed the school district’s index. Of the districts who sought exceptions: 221 used the pension costs exemption and 171 sought a Special Education costs exemption. Only 1 school district sought an exemption for Nonacademic School Construction Project, while 1 sought an exception for Electoral debt for school construction.[149]
North Allegheny School Board apply for an exception to exceed the Act 1 index for the budget in 2011 due to escalating teacher pension costs.[150] For 2009-10 school budget, the board did not apply for exceptions to exceed the Index.[151] In the Spring of 2010, 135 Pennsylvania school boards asked to exceed their adjusted index. Approval was granted to 133 of them and 128 sought an exception for pension costs increases.[152]
Property tax relief
In 2012, North Allegheny School District approved homestead residents received $148 for 15,077 approved residences.[153] In 2010, property tax relief for 14,552 approved residents of North Allegheny School District was set at $153.[154] In 2009, the Homestead/Farmstead Property Tax Relief from gambling for the North Allegheny School District was also $154 per approved permanent primary residence. In the district, 14,348 property owners applied for the tax relief. In Allegheny County, the highest tax relief went to Duquesne City School District which was set at $346.[155] The highest property tax relief, among Pennsylvania school districts, went to the homesteads of Chester Upland School District of Delaware County which received $632 per approved homestead in 2010. Chester-Upland School District has consistently been the top recipient since the programs inception.[156] The relief was subtracted from the total annual school property tax bill. Property owners apply for the relief through the county Treasurer's office. Farmers can qualify for a farmstead exemption on building used for agricultural purposes. The farm must be at least 10 contiguous acres (40,000 m2) and must be the primary residence of the owner. Farmers can qualify for both the homestead exemption and the farmstead exemption. In Beaver County, 62% of eligible property owners applied for property tax relief in 2009.[157]
Property taxes in Pennsylvania are relatively high on a national scale. According to the Tax Foundation, Pennsylvania ranked 11th in the U.S. in 2008 in terms of property taxes paid as a percentage of home value (1.34%) and 12th in the country in terms of property taxes as a percentage of income (3.55%).[137]
Extracurriculars
The North Allegheny School District offers a variety of clubs, activities and an extensive, costly sports program. Eligibility for participation is determined by school board policy and in compliance with standards set by the Pennsylvania Interscholastic Athletic Association (PIAA).
By Pennsylvania law, all K-12 students in the district, including those who attend a private nonpublic school, cyber charter school, charter school and those homeschooled, are eligible to participate in the extracurricular programs, including all athletics. They must meet the same eligibility rules as the students enrolled in the district's schools.[158]
Athletics, Facilities, and Activities
The school district offers 24 varsity sports. During the 2004–2005 school year, nine of these sports took WPIAL titles, 18 took section titles, one took a PIAA title. Additionally, the inline hockey team won the 2005 Pennsylvania Interscholastic Roller Hockey League "Penguin Cup".
The 2005–2006 school year heralded the following WPIAL wins for the Tigers: Cross-Country, Swimming, and Softball, in addition to a PIRHL championship for Inline Hockey.
In the 2006–2007 School Year, North Allegheny Cross-Country and Field Hockey teams both won the WPIAL. Winter sports such as Gymnastics and Swimming also captured WPIAL titles, with Swimming taking 3rd in the PIAA. In addition, the Ice Hockey team captured the WPIHL and PIHL Championships. For the 2007 Spring, Boys Volleyball took the WPIAL Championship.
The 2007–2008 resulted in four WPIAL Titles: Boys Cross-Country, Field Hockey, Boys Swimming, and Boys Volleyball.
North Allegheny's primary athletic rival is neighboring district North Hills, and this rivalry has often become extremely intense.
The school district owns Newman Stadium which seats 7,500, and a $5.1 million multi-purpose athletic facility called the Baierl Center. In addition, North Allegheny has 31 playing fields, a 6-lane 25 yard pool, 2 400 meter tracks, and 14 tennis courts.
North Allegheny also has an Air Force Junior Reserve Officer Training Corps (AFJROTC) unit.
Between 2010-2012, football won 2 PIAA titles and 3 WPIAL titles. The Tigers are the first team in WPIAL history to win three straight Quad A Championships.
Between 2005-2013, boys cross country won 1 PIAA title and 9 WPIAL titles. Since the program's inception in 1960, the team has won 27 WPIAL championships – the most of any team in any sport in the WPIAL.
In addition to the school sponsored sports, there are also boys and girls student run Ultimate Frisbee teams. In 2015, the boys team won the Pennsylvania High School Championship.
Transportation
W.L. Roenigk, Inc operates the North Allegheny fleet. North Allegheny transportation fleet is based at the Marshall campus and the NA Transportation Department on Hillvue Lane. Their fleet transports over 9,200 students to 16 different schools and consists of 128 vehicles used to pick up students living throughout the district.
Notable alumni
- Melissa Hart (1980) – former United States Representative[159]
- Mason Jennings (1993) singer-songwriter [160]
- Robert James – band member of The Clarks[161]
- Greg Joseph (1981) – band member of The Clarks[161]
- Frank Nicotero (1987) – comedian[162]
- Tim Manoa – former professional American football player, Cleveland Browns, Indianapolis Colts[163]
- Thomas Keiser – professional National Football League player, Defensive End for the Carolina Panthers
- Gregg Garrity – former Penn State, Steelers, and Eagles wide-receiver
- Christina Aguilera – singer-songwriter
- Mike McMahon - former quarterback for various teams of the NFL, CFL and UFL
References
- ↑ Pennsylvania Department of Education (2013). "EDNA - Education Names and Addresses PA".
- ↑ National Center for Education Statistics, Common Core of Data - North Allegheny School District, 0212
- ↑ Pennsylvania Department of Education (December 5, 2013). "North Allegheny School District School Performance report fast facts".
- ↑ Pennsylvania Department of Education, Enrollment and Projections by LEA, 2010
- ↑ Pennsylvania Department of Education, Projected Birth and Enrollment by LEA, 2011
- ↑ Pennsylvania Department of Education (July 2011). "Enrollment and Projections by school district".
- ↑ Chute, Eleanor and Niederberger, Mary., 16 of 43 school districts in Allegheny County hike taxes, July 15, 2012
- ↑ US Census Bureau, 2010 Census Poverty Data by Local Education Agency, 2011
- ↑ American Fact Finder, US Census Bureau, 2009
- ↑ US Census Bureau (2010). "American Fact Finder, State and County quick facts".
- ↑ US Census Bureau (September 2011). "Income, Poverty, and Health Insurance Coverage in the United States: 2010" (PDF).
- ↑ Michael Sauter & Alexander E.M. Hess, (August 31, 2013). "America's most popular six-figure jobs". USA Today.
- ↑ NASH School Profile. northallegheny.org
- ↑ Pennsylvania Public School Code Governance 2010
- ↑ The Commonwealth Foundation for Public Policy Alternatives. "The Pennsylvania Project". Retrieved May 20, 2010.
- ↑ EL. "Best School Districts". SchoolDigger.com. Retrieved 7 September 2016.
- ↑ EL. "Best Schools in PA...". SchoolDigger.com. Retrieved 7 September 2016.
- ↑ EL. "SAT and ACT". Education.PA.GOV. Retrieved 7 September 2016.
- ↑ Pennsylvania Department of Education, North Allegheny School District AYP Overview, September 29, 2011
- ↑ Pennsylvania Department of Education (October 4, 2013). "North Allegheny High School - School Performance report 2013".
- ↑ Pennsylvania Department of Education (September 21, 2012). "North Allegheny School District Academic Achievement Report Card 2012" (PDF).
- ↑ Pennsylvania Department of Education, North Allegheny School District AYP overview, September 29, 2011
- ↑ Pennsylvania Department of Education (March 15, 2011). "New 4-year Cohort Graduation Rate Calculation Now Being Implemented".
- ↑ Pennsylvania Partnerships for Children. "High School Graduation rate 2007". Retrieved January 31, 2011.
- ↑ North Allegheny School District Academic Achievement Report Card 2009
- ↑ Pennsylvania Department of Education (2010). "NORTH ALLEGHENY SD – District AYP Data Table".
- ↑ US News & World Report (2013). "Best High Schools in the USA".
- ↑ Best High Schools 2008, US News and World Report. December 9, 2009
- ↑ Pennsylvania Department of Education (October 4, 2013). "North Allegheny Senior High School Academic Performance Data 2013".
- ↑ The Pennsylvania Basic Education/Higher Education Science and Technology Partnership, Science in Motion annual report, 2012
- ↑ College Board (2013). "The 2013 SAT Report on College & Career Readiness".
- ↑ Pennsylvania Department of Education (2011). "Public School SAT Scores 2011".
- ↑ College Board (September 2011). "SAT Scores State By State - Pennsylvania".
- ↑ "While U.S. SAT scores dip across the board, N.J. test-takers hold steady". September 2011.
- ↑ PDE, Academic Performance Data - North Allegheny Senior High School, December 2013
- ↑ National Center for Education Statistics, Common Care Data - North Allegheny Intermediate High School, 2010
- ↑ Pennsylvania Department of Education, (September 29, 2011). "North Allegheny Intermediate High School Report Card 2011 - Professional Qualifications of Teachers" (PDF).
- ↑ Pennsylvania Department of Education, North Allegheny Intermediate High School AYP Overview, September 29, 2011
- ↑ National Center for Education Statistics, Common Care Data – Marshall Middle School, 2010
- ↑ Pennsylvania Department of Education, Professional Qualifications of Teachers Marshall Middle School, September 29, 2011
- 1 2 3 The Rankings: Eighth grade, Pittsburgh Business Times, May 15th, 2009.
- ↑ Pennsylvania Department of Education, Marshall Middle School AYP Overview, September 21, 2012
- ↑ Pennsylvania Department of Education, Marshall Middle School AYP Overview, April 6, 2011
- 1 2 Pittsburgh Post Gazette (October 15, 2012). "How is your school doing?".
- ↑ Pennsylvania Department of Education (2011). "Marshall Middle School Academic Achievement Report Card 2011" (PDF).
- ↑ Pennsylvania Department of Education, Marshall Middle School Academic Achievement Report Card 2010, October 20, 2010
- ↑ Pennsylvania Department of Education, Marshall Middle School Academic Achievement Report Card 2009, September 14, 2009
- ↑ Pennsylvania Department of Education (September 21, 2012). "Marshall Middle School Academic Achievement Report Card 2012" (PDF).
- 1 2 3 Pennsylvania Department of Education Report (September 14, 2010). "2010 PSSAs: Reading, Math, Writing and Science Results".
- 1 2 3 2009 PSSAs: Reading, Math, Writing and Science Results Pennsylvania Department of Education Report. Portal.state.pa.us (2011-11-22). Retrieved on 2012-05-29.
- 1 2 Pennsylvania Department of Education Report (August 2009). "Science PSSA 2009 by Schools".
- ↑ National Center for Education Statistics, Common Care Data – Ingomar Middle School, 2010
- ↑ Pennsylvania Department of Education, Professional Qualifications of Teachers Ingomar Middle School, September 29, 2011
- ↑ Pennsylvania Department of Education, Ingomar Middle School AYP Overview, April 6, 2011
- ↑ Pennsylvania Department of Education, Ingomar Middle School Academic Achievement Report Card 2011, September 29, 2011
- ↑ Pennsylvania Department of Education, Ingomar Middle School Academic Achievement Report Card 2010, October 20, 2010
- ↑ Pennsylvania Department of Education, Ingomar Middle School Academic Achievement Report Card 2009, September 14, 2009
- ↑ Pennsylvania Department of Education (September 21, 2012). "Ingomar Middle School Academic Achievement Report Card 2012" (PDF).
- ↑ National Center for Education Statistics, Common Care Data – Carson Middle School, 2010
- ↑ Pennsylvania Department of Education, Professional Qualifications of Teachers Carson Middle School, September 29, 2011
- ↑ Pennsylvania Department of Education, Carson Middle School AYP Overview, April 6, 2011
- ↑ Pennsylvania Department of Education (2011). "Carson Middle School Academic Achievement Report Card 2011" (PDF).
- ↑ Pennsylvania Department of Education, Carson Middle School Academic Achievement Report Card 2010, October 20, 2010
- ↑ Pennsylvania Department of Education, Carson Middle School Academic Achievement Report Card 2009, September 14, 2009
- ↑ Pennsylvania Bureau of Special Education (January 31, 2011). "North Allegheny School District Special Education Data Report LEA Performance on State Performance Plan (SPP) Targets School Year 2008–2009" (PDF).
- ↑ Pennsylvania Department of Education (2010). "Pennsylvania Special Education Funding".
- ↑ Pennsylvania Department of Education (July 2010). "Special Education Funding from Pennsylvania State_2010-2011".
- ↑ Pennsylvania Department of Education (2011). "Special Education Funding 2011-2012 Fiscal Year".
- ↑ Pennsylvania Department of Education, Investing in PA kids, April 2012
- ↑ Pennsylvania Department of Education (Revised December 1, 2009 Child Count (Collected July 2010)). "Gifted Students as Percentage of Total Enrollment by School District/Charter School" (PDF). Check date values in:
|date=(help) - ↑ Pennsylvania Department of Education and Pennsylvania School Board. "CHAPTER 16. Special Education For Gifted Students". Retrieved February 4, 2011.
- ↑ Pennsylvania Department of Education (March 26, 2010). "Special Education for Gifted Students Notice of Parental rights" (PDF).
- ↑ Pennsylvania General Assembly, Taxpayer Relief Act, Act 1 of the Special Session of 2006, June 27, 2006
- ↑ Pennsylvania Department of Education (2013). "Investing in Pennsylvania Students - North Allegheny School District".
- ↑ "North Allegheny School District Payroll report 2011". OpenPA Gov.org. 2013.
- ↑ Pennsylvania Department of Education (2012). "Investing in Pennsylvania Students".
- ↑ Asbury Park Press (2009). "PA. Public School Salaries".
- ↑ North Allegheny School Board. "North Allegheny School District Teacher Union Employment Contract 2010".
- ↑ "Pennsylvania Public Schools Teachers' Union Contracts". April 27, 2012.
- ↑ Pennsylvania Department of Education (2012). "Investing in Pennsylvania Students".
- ↑ American Enterprise Institute, (2011). "Assessing the Compensation of Public School Teachers".
- ↑ Fenton, Jacob, Average classroom teacher salary in Allegheny County, 2006–07. The Morning Call. Accessed March 2009.
- ↑ Fenton, Jacob. Pennsylvania School District Data: Will School Consolidation Save Money?, The Morning Call, Feb 2009.
- ↑ Trozzo, Sandy (July 6, 2012). "North Allegheny School District resignation leads to administrative restructuring". Pittsburgh Post-Gazette.
- ↑ Pennsylvania Department of Education (2010). "2009-10 Selected Data - 2009-10 Total Expenditures per ADM".
- ↑ United States Census Bureau (2009). "States Ranked According to Per Pupil Elementary-Secondary Public School System Finance Amounts: 2008-09" (PDF).
- ↑ US Census Bureau (2009). "Total and current expenditures per pupil in fall enrollment in public elementary and secondary education, by function and state or jurisdiction: 2006-07".
- ↑ "Public Education Finances 2000-01 Annual Survey of Local Government Finances - US Census Bureau" (PDF). March 2003.
- ↑ General Reserved Fund Balance by School District 1996–2008, Pennsylvania Department of Education Report 2008.
- ↑ Pennsylvania Department of Education, Investing in Pennsylvania Students 2013, 2014
- ↑ Murphy, Jan., Pennsylvania's public schools boost reserves, CentreDaily Times, September 22, 2010
- ↑ Pennsylvania Auditor General (January 2013). "North Allegheny School District Allegheny County, Pennsylvania Performance Audit Report".
- ↑ Pennsylvania Auditor General (January 2010). "North Allegheny School District Allegheny County, Pennsylvania Performance Audit Report".
- ↑ Pennsylvania Department of Education (May 2012). "Pennsylvania Public School District Tuition Rates".
- ↑ Penn State Cooperative Extension (2010). "What are the Local Taxes in Pennsylvania?, Local Tax Reform Education Project,".
- ↑ Pennsylvania Department of Revenue (April 2010). "Personal Income Taxation Guidelines".
- ↑ Pennsylvania Representative Todd Stephens (January 23, 2014). "LEEF Funding Chart 2014".
- ↑ Democrat Appropriations Committee, Report on Education funding by LEA, July 2, 2013
- ↑ Sam Wood & Brian X. McCrone (January 29, 2014). "Montgomery County lawmaker proposes using Pa. horse racing funds for education". Philadelphia Inquirer.
- ↑ Pennsylvania Office of the Budget, 2013-14 State Budget Highlights, 2013
- ↑ Senator Jake Corman (June 28, 2012). "Pennsylvania Education funding by Local School District" (PDF).
- ↑ Pennsylvania General Assembly Sen Jake Corman (June 29, 2012). "SB1466 of 2012 General Fund Appropriation".
- ↑ PA Senate Appropriations Committee (June 28, 2011). "School District 2011-12 Funding Report".
- ↑ Pennsylvania Department of Education (July 2011). "Basic Education Funding".
- ↑ Pennsylvania Department of Education (June 30, 2011). "Basic Education Funding".
- ↑ Pennsylvania Department of Education (June 30, 2011). "Basic Education Funding 2011-2012 Fiscal Year".
- ↑ Pennsylvania House Appropriations Committee Education Budget information (June 30, 2010). "PA Basic Education Funding-Printout2 2010-2011" (PDF).
- ↑ Pennsylvania Budget Proposal 2010, Office of Budget, February 2010
- ↑ Pennsylvania Department of Education Report on Funding by school district October 2009
- ↑ Pennsylvania Department of Education, Funding Report by LEA, 2009
- ↑ U.S. Census Bureau., Annual Survey of Local Government Finances., 2000
- ↑ U.S. Census Bureau., 2008 Survey of Local Government Finances – School Systems, 2010
- ↑ Pennsylvania Department of Education (2010). "Accountability Block Grant report Grantee list 2010".
- ↑ Pennsylvania Department of Education (2008). "Accountability Block Grant Mid Year report".
- ↑ Pennsylvania Auditor General (December 22, 2008). "Classrooms for the Future grants audit" (PDF).
- ↑ Tory N. Parrish (2014). "North Allegheny to use grant for safety upgrades". Pittsburgh Trib Live.
- ↑ Pennsylvania Department of Education Press Office (October 17, 2013). "Acting Secretary of Education Says Hybrid Learning Benefits Students; Highlights Success of First-Year Pilot Program".
- ↑ Allegheny County ARRA FUNDING Report Website. Accessed April 2010.
- ↑ "School stimulus money". Pittsburgh Post-Gazette. March 12, 2009.
- ↑ Pennsylvania Department of Education (December 9, 2009). "Race To The Top Webinar powerpoint for districts December 2009" (PDF).
- ↑ Governor's Press Office release (January 20, 2010). "Pennsylvania's 'Race to the Top' Fueled by Effective Reforms, Strong Local Support,".
- ↑ Race to the Top Fund, U.S. Department of Education, March 29, 2010.
- ↑ Gerald Zahorchak (December 2008). "Pennsylvania Race to the Top Letter to Superintendents" (PDF).
- ↑ Pennsylvania Department of Education (January 19, 2009). "Pennsylvania Race to the Top -School Districts Title I Allocations 2009-10".
- ↑ Pennsylvania Department of Education (2011). "Real Estate Tax Rates by School District 2011-12 Real Estate Mills".
- ↑ Pennsylvania Department of Education (2004). "Act 511 Tax Report".
- ↑ State Tax Equalization Board (2011). "State Tax Equalization Board About US".
- ↑ Pennsylvania Auditor General office - Bureau of Audits (February 2011). "A Special Performance Audit of the Pennsylvania State Tax Equalization Boards" (PDF).
- ↑ Pennsylvania Department of Education (2010). "Real Estate Tax Millage by School District,".
- ↑ Pennsylvania Department of Education (2010). "Financial Elements Reports".
- ↑ Pennsylvania Department of Education (2009). "Financial Elements Reports 2008-09 Real Estate Mills".
- ↑ Pennsylvania Department of Education (2008). "Real Estate Tax Millage by School District,".
- ↑ Pennsylvania Department of Education (2006). "Real Estate Tax Millage by School District,".
- ↑ Pennsylvania Department of Education, Real Estate Tax Millage by School District, 2005
- ↑ Tax-rates.org., The 2013 Tax Resource County Property Taxes 2012, 2012
- ↑ Pennsylvania Department of Education, Pennsylvania School Finances - Summaries of Annual Financial Report Data 2010-11, 2011
- 1 2 New Census Data on Property Taxes on Homeowners, Tax Foundation, September 22, 2009.
- ↑ Pennsylvania Department of Education (2010). "2010-11 Act 1 of 2006 Referendum Exception Guidelines".
- ↑ Kaitlynn Riely (August 4, 2011). "Law could restrict school construction projects". Pittsburgh Post-Gazette.
- ↑ Pennsylvania General Assembly (June 29, 2011). "SB330 of 2011".
- ↑ Eric Boehm (July 1, 2011). "Property tax reform final piece of state budget". PA Independent.
- 1 2 Pennsylvania Department of Education (2011). "Special Session Act 1 of 2006 the Taxpayer Relief Act information".
- ↑ Pennsylvania Department of Education (May 2010). "Special Session Act 1 of 2006 School District Adjusted Index for 2006-2007 through 2010-2011".
- ↑ Pennsylvania Department of Education, 2012-2013 School District Adjusted Index, May 2012
- ↑ Pennsylvania Department of Education, 2013-2014 School District Adjusted Index, September 2012
- ↑ Pennsylvania Department of Education, 2014-2015 School District Adjusted Index, September 2013
- ↑ Pennsylvania Department of Education, Report on Referendum Exceptions For School Year 2013-2014, April 2013
- ↑ Pennsylvania Department of Education, Report on Referendum Exceptions For School Year 2012-2013, March 30, 2012
- ↑ Pennsylvania Department of Education (April 2011). "Report on Exceptions".
- ↑ Pennsylvania Department of Education (May 2010). "Report on Referendum Exceptions for 2010-2011".
- ↑ Pennsylvania Department of Education (May 2009). "Report on Referendum Exceptions for 2009-2010".
- ↑ Scarcella, Frank & Pursell, Tricia (May 25, 2010). "Local school tax assessments exceed state averages". The Daily Item.
- ↑ Pennsylvania Department of Education (May 1, 2012). "2012-2013 Estimated State Property Tax Relief per Homestead".
- ↑ Pennsylvania Department of Education, Tax Relief per Homestead, May 1, 2010
- ↑ Pennsylvania Department of Education, Tax Relief per Homestead, May 1, 2009.
- ↑ Tax Relief per Homestead 2009, Pennsylvania Department of Education Report, May 1, 2009
- ↑ Pennsylvania Auditor General Office, Special Report Pennsylvania Property Tax Relief, 2-23-2010.
- ↑ Home-Schooled, Charter School Children Can Participate in School District Extracurricular Activities, Pennsylvania Office of the Governor Press Release, November 10, 2005
- ↑ "Hart, Melissa A.". Biographical Directory of the United States Congress. Retrieved 2007-06-20.
- ↑ TribLIVE: #(gSection.name)#. Pittsburghlive.com (2012-01-05). Retrieved on 2012-05-29.
- 1 2 Knavish, Brian (2005-12-15). "The Clarks still like rockin' in the North Hills". McKnight Journal. Trib Total Media. Retrieved 2007-01-17.
- ↑ Wilson, P.F (2005-03-24). "Game Show Over". Pittsburgh City Paper. Retrieved 2007-01-17.
- ↑ VanFossan, Brad (2009-06-09). "Interview with former Penn State Nittany Lion and Cleveland Browns' fullback Tim Manoa". Cleveland Leader.
External links
Coordinates: 40°34′03″N 80°01′52″W / 40.56751°N 80.03123°W