Mifflinburg Area School District
| Mifflinburg Area School District | |
|---|---|
|
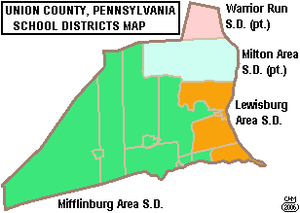
Shows district region in western Union County | |
| Address | |
|
178 Maple Street Mifflinburg, Pennsylvania, Union County 17844 United States | |
| Information | |
| Type | Public |
| Closed | Laurelton ES June 2011, New Berlin ES & Buffalo Crossroads ES June 2012, |
| School board | 9 members elected at large |
| Superintendent | Mr. Daniel R. Lichtel - 5 year contract beginning 2010, Salary $105,000 (2012) [1] Contract renewed for four years salary $118,200 (2015)[2] |
| Administrator | Thomas R Caruso, Business Manager |
| Principal | Mr Marion Lynn |
| Principal | Mrs Michelle L. Shearer |
| Principal | Mr Michael G. Lord |
| Principal | Mr Scott Zimmerman |
| Principal | Christopher Morrison, VP MAHS $64,000 (2014) |
| Staff | 175 non teaching staff members |
| Faculty | 164.5 teachers (2011)[3] |
| Grades | K-12 |
| Age | 5 years old to 21 years old for special education students |
| Pupils |
1,983 pupils (2016-17)[4] |
| • Kindergarten | 145 (2014),[11] 154 (2012),[12] 190 (2010) |
| • Grade 1 | 151 (2012), 157 (2010) |
| • Grade 2 | 173 (2012), 174 |
| • Grade 3 | 196 (2012), 167 |
| • Grade 4 | 158 (2012), 160 |
| • Grade 5 | 171 (2012), 166 |
| • Grade 6 | 171 (2012), 145 |
| • Grade 7 | 160 (2012), 160 |
| • Grade 8 | 169 (2012), 196 |
| • Grade 9 | 158 (2012), 183 |
| • Grade 10 | 153 (2012), 190 |
| • Grade 11 | 178 (2012), 187 (2010) |
| • Grade 12 | 97 (2012), 117 (2010) |
| • Other | Enrollment projected to decline to 1,927 by 2020 [13] |
| Medium of language | English |
| Color(s) | Blue and White |
| Mascot | Wildcat |
| Budget |
$28,231,057 (2015-16)[14] |
| School fees | $30 athletics and band |
| Per pupil spending | $9,649 (2008) |
| Per pupil spending | $10,534.83 (2010) |
| Website | http://www.mifflinburg.org/ |
The Mifflinburg Area School District is a small, rural, public school district serving western Union County, Pennsylvania. Centered on the borough of Mifflinburg, it also serves Buffalo Township, New Berlin, Limestone Township, West Buffalo Township, Lewis Township, Hartleton, and Hartley Township. Mifflinburg Area School District encompasses approximately 217 square miles (560 km2). According to 2000 United States Census data, the District served a resident population of 17,867. By 2010, Mifflinburg Area School District's population declined to 16,366 people.[20] The educational attainment levels for the Mifflinburg Area School District population (25 years old and over) were 81.5% high school graduates and 17.5% college graduates.[21] The region has a large Amish community who do not attend school past 8th grade. Most Amish children attend private schools operated by the amish community, rather than the local public schools. The District is one of the 500 public school districts of Pennsylvania and one of four full or partial public school districts operating in Union County.
According to the Pennsylvania Budget and Policy Center, 40% of the District’s pupils lived at 185% or below the Federal Poverty level as shown by their eligibility for the federal free or reduced price school meal programs in 2012.[22] In 2009, the per capita income was $16,987, while the median family income was reported as $42,418 a year.[23] In the Commonwealth, the median family income was $49,501[24] and the United States median family income was $49,445, in 2010.[25] In Union County, the median household income was $45,474.[26] By 2013, the median household income in the United States rose to $52,100.[27] In 2014, the median household income in the USA was $53,700.[28]
Per District officials, in school year 2007-08, Mifflinburg Area School District provided basic educational services to 2,310 pupils through the employment of 153 teachers, 55 full-time and part-time support personnel, and 17 administrators. In school year 2009-10, MASD enrollment had declined to 2,246 pupils. The District increased employment to: 175 teachers, 161 full-time and part-time support personnel, and 16 administrators. Mifflinburg Area School District received more than $11.1 million in state funding in school year 2009-10.[29] MASD enrollment declined to 2,211 pupils in 2011-12. The District employed: 160 teachers, 118 full-time and part-time support personnel, and fifteen (15) administrators during the 2011-12 school year. The District received $11.3 million in state funding in the 2011-12 school year.[30]
Mifflinburg Area School District operates: Mifflinburg Area Elementary School, Mifflinburg Area Intermediate School, Mifflinburg Area Middle School, and Mifflinburg Area High School which are all located in a cluster within the borough of Mifflinburg.
High school students may choose to attend the award winning SUN Area Technical Institute for training in the building trades, food service or allied health industry. The Central Susquehanna Intermediate Unit IU16 provides the District with a wide variety of services like specialized education for disabled students and hearing, speech and visual disability services and professional development for staff and faculty.
Governance
Mifflinburg Area School District is governed by 9 individually elected board members (serve without compensation for a term of four years), the Pennsylvania State Board of Education, the Pennsylvania Department of Education and the Pennsylvania General Assembly.[31] The federal government controls programs it funds like: Title I funding for low income children in the Elementary and Secondary Education Act and the No Child Left Behind Act (renamed Every Student Succeeds Act (ESSA) in December 2015) which mandates the district focus its resources on student success in acquiring reading and math skills.[32] The school board is required by state law to post a financial report on the district in its website by March of each school year.[33] The administration failed to comply in 2016.[34]
The Superintendent and Business Manager are appointed by the school board. The Superintendent is the chief administrative officer with overall responsibility for all aspects of operations, including education and finance. The Business Manager is responsible for budget and financial operations. Neither of these officials are voting members of the School Board. The School Board enters into individual employment contracts for these positions. In Pennsylvania, public school districts are required to give 150 days notice to the Superintendent regrading renewal of the employment contract. Pursuant to Act 141 of 2012 which amended the Pennsylvania School Code, all school districts that have hired superintendents on/after the fall of 2012 are required to develop objective performance standards and post them on the district’s website.[35]
The Commonwealth Foundation for Public Policy Alternatives Sunshine Review gave the school board and district administration a "F" for transparency based on a review of "What information can people find on their school district's website". It examined the school district's website for information regarding; taxes, the current budget, meetings, school board members names and terms, contracts, audits, public records information and more.[36] The District does not provide a copy of its budgets on its website in 2015 and 2016.[37]
Academic achievement
In 2016, Mifflinburg Area School District ranked 128th out of 496 Pennsylvania public school districts, by the Pittsburgh Business Times.[38] The ranking is based on the last 3 years of student academic achievement as demonstrated by PSSAs results in: reading, writing, math and science and the three Keystone Exams (literature, Algebra 1, Biology I) in high school.[39] Three public school districts were excluded from the review because they did not operate high schools (Saint Clair Area School District, Midland Borough School District, Duquesne City School District). The PSSAs are given to all children in grades 3rd through 8th. Adapted PSSA examinations are given to children in the special education programs. Writing exams were given to children in 5th and 8th grades.
- Overachiever statewide ranking
In 2013, the Pittsburgh Business Times also reported an Overachievers Ranking for 498 Pennsylvania school districts. Mifflinburg Area School District ranked 110th. In 2012, the District was 123rd.[48] The editor describes the ranking as: "a ranking answers the question - which school districts do better than expectations based upon economics? This rank takes the Honor Roll rank and adds the percentage of students in the district eligible for free and reduced-price lunch into the formula. A district finishing high on this rank is smashing expectations, and any district above the median point is exceeding expectations."[49]
Mifflinburg Area School District students academic achievement fells in the 69th percentile in Pennsylvania public school districts in 2009. Scale - (0-99; 100 is state best) [50]
District AYP status history
In 2012, Mifflinburg Area School District declined to Warning AYP status, due to lagging student achievement in reading and mathematics.[51] In 2011, Mifflinburg Area School District achieved Adequate Yearly Progress (AYP). In 2011, 94 percent of the 500 Pennsylvania public school districts achieved the No Child Left Behind Act progress level of 72% of students reading on grade level and 67% of students demonstrating on grade level math. In 2011, 46.9 percent of Pennsylvania school districts achieved Adequate Yearly Progress (AYP) based on student performance. An additional 37.8 percent of Pennsylvania public school districts made AYP based on a calculated method called safe harbor, 8.2 percent on the growth model and 0.8 percent on a two-year average performance.[52] Mifflinburg Area School District achieved AYP status each year from 2005 to 2010, while in 2004 the District was in Warning status due to lagging student achievement. In 2003, Mifflinburg Area School District achieved AYP status.[53]
Graduation rate
In 2016, Mifflinburg Area School District's graduation rate was 91.6%.[54]
- 2015 - 92.9%
- 2014 - 87.4%.[55]
- 2013 - 91.48%[56]
- 2012 - 88%.[57]
- 2011 - 92%.[58]
- 2010 - 92%, the Pennsylvania Department of Education issued a new, 4-year cohort graduation rate.[59]
- Former AYP graduation rate
According to a Pennsylvania Partnerships for Children Report, in 2006, 37.6% of Mifflinburg High School graduates did not score proficient or advanced on Math and English PSSAs. The district's graduation requirements are defined in the Strategic Plan and school board policy.
Mifflinburg Area High School does not offer a dual enrollment Program in 2009 or 2010.[65] Pennsylvania's Dual Enrollment permits high school students to attend college part-time while still enrolled at their high school. Pennsylvania high school juniors and seniors have access to deeply discounted college credits during the school year and in the summer at Bloomsburg University of Pennsylvania through the ACE program. The program was offered at over 400 Pennsylvania school districts during the 2009-10 school year.
High school
Mifflinburg Area High School is located at 75 Market Street, Mifflinburg. In 2013, the school's enrollment was reported as 586 pupils in 9th through 12th grades, with 32% of pupils eligible for a free or reduce priced lunch due to low family income. Additionally, 32% of pupils received special education services, while 3.4% of pupils were identified as being gifted.[66] The school employed 47 teachers.[67] Per the PA Department of Education 100% of the teachers were rated "Highly Qualified" under the federal No Child Left Behind Act.
In 2010, Mifflinburg Area High School enrolled 677 students in grades 9th through 12th with 164 students qualifying for a federal free or reduced-price lunch due to family poverty. By 2013, enrollment had declined to 586 students, with 32% being economically disadvantaged. In 2010, the School employed 51 teachers, yielding a student–teacher ratio of 13:1.[68] All of the teachers were rated Highly Qualified under the No Child Left Behind Law.[69]
- 2016 School Performance Profile
2016 SPP - 65.9 out of 100 points. Mifflinburg Area High School Keystone Exams mandated testing results were: 79.1% of students were on grade level in reading/literature and 78.4% of students demonstrated on grade level in Algebra I. In Biology I, 73% of pupils demonstrated on grade level science understanding at the end of the Biology course.[70] The requirement that pupils pass the Keystone Exams in reading, algebra I and bIology I in order to graduate was postponed until 2019 by the Pennsylvania General Assembly because less than 60% of 12 grade pupils statewide would have been eligible for graduation from high school due to failing one or more Keystone Exams.[71] Fifty-four percent of the 2,676 public schools in Pennsylvania achieved a passing score of 70 or better.[72]
- 2015 School Performance Profile
Mifflinburg Area HIgh School scored a 67.6 out of 100 on the state School Performance Profile in 2015. The PDE reported that 74.5% of the High School’s students were on grade level in reading/literature. In Algebra 1, 82.7% of students showed on grade level skills at the end of the course. In Biology I, 75% demonstrated on grade level science understanding at the end of the course.[73] Statewide, 53 percent of schools with an eleventh grade achieved an academic score of 70 or better. Five percent of the 2,033 schools with 11th grade were scored at 90 and above; 20 percent were scored between 80 and 89; 28 percent between 70 and 79; 25 percent between 60 and 69 and 22 percent below 60. The Keystone Exam results showed: 73 percent of students statewide scored at grade-level in English, 64 percent in Algebra I and 59 percent in biology.[74][75]
- 2014 School Performance Profile
Mifflinburg Area High School achieved 75 out of 100. Reflects on grade level reading, mathematics and science achievement. In reading/literature - 85% were on grade level. In Algebra 1, 79.5% showed on grade level skills. In Biology, 67.88% showed on grade level science understanding at the end of the course.[76] According to the Pennsylvania Department of Education, 2,134 of 2,947 Pennsylvania public schools (72 percent of Pennsylvania public schools), achieved an academic score of 70 or higher.[77] Fifty-three percent of schools statewide received lower SPP scores compared with last year's, while 46 percent improved. A handful were unchanged.[78]
- 2013 School Performance Profile
Mifflinburg Area High School achieved 84.7 out of 100. Reflects on grade level reading, mathematics and science achievement. In reading/literature - 86.67 were on grade level. In Algebra 1, 73.94% showed on grade level algebra skills. In Biology, 66.67% showed on grade level science understanding.[79]
- AYP History
In 2012, Mifflinburg Area High School remained in Warning status due to missing 3 targets under No Child Left Behind, including graduation rate and math achievement.[80] In 2011, the High School was also in Warning status due to lagging student achievement. In 2010 and 2009, the High School achieved AYP.[81]
- PSSA results:
Pennsylvania System of School Assessments, commonly called PSSAs are No Child Left Behind Act related examinations which were administered from 2003 through 2012 in all Pennsylvania public high schools. The exams were administered in the Spring of each school year. The goal was for 100% of students to be on grade level or better in reading and mathematics, by the Spring of 2014. The tests focused on the state's Academic Standards for reading, writing, mathematics and science. The Science exam included content in science, technology, ecology and the environmental studies. The mathematics exam included: algebra I, algebra II, geometry and trigonometry. The standards were first published in 1998 and are mandated by the Pennsylvania State Board of Education.[82]
- 11th Grade Mathematics:
- 2012 - 64% on grade level. (13% below basic). In Pennsylvania, 59% of 11th graders were on grade level in math.[83] Ranked 8th out of 18 IU16 high schools for math achievement.
- 2011 - 63% (10% below basic). State - 60%
- 2010 - 69%, State - 59% [84]
- 2009 - 64.1%, State - 56%. Ranked 6th out of 18 IU16 high schools for math.[85][86]
- 2008 - 55.2%, State - 56% [87]
- 2007 - 51.9%, State - 53.7%
- 2006 - 54%, State - 52% [88]
- 2005 - 53%, State - 51%
- 2004 - 41%, State - 49%
- 11th grade Science:
- 2012 - 60% on grade level. 4% below basic). State - 42% of 11th graders were on grade level.
- 2011 - 55% (5% below basic). State - 40% [89]
- 2010 - 47.5%, State - 39% [90]
- 2009 - 50.7%, State - 40% [91]
- 2008 - 42%, State - 39%
- 11th grade Reading:
- 2012 - 78% on grade level (8% below basic). State - 67% of 11th graders were reading on grade level. Ranked 6th in CSIU16 region 11th grades for 11th grade reading achievement.
- 2011 - 73.4% on grade level (13% below basic). State - 69% Ranked 8th in CSIU16 region 11th grades for 11th grade reading.[92]
- 2010 - 71%, State - 67%. Ranked 12th out of 18 high schools in IU16 region for reading.[93]
- 2009 - 88%, State - 65%. Ranked 1st of 18 high schools in CSIU16 region in Reading.[94]
- 2008 - 71.5%, State - 65% [95]
- 2007 - 75%, State - 65.4% [96]
- 2006 - 75%, State - 65.1% [97]
- 2005 - 80%, State - 65%
- 2004 - 67%, State - 61%
Science in Motion Mifflinburg Area Senior High School did not take advantage of a state program called Science in Motion which brought college professors and sophisticated science equipment to the school to raise science awareness and to provide inquiry-based experiences for the students. The Science in Motion program was funded by a state appropriation and cost the school nothing to participate.[98] Susquehanna University provided the science enrichment experiences to schools in the region.
College Remediation rate
In January 2009, research was presented to the Pennsylvania State Board of Education. The research examined course enrollment trends at the state’s 14 community colleges and the 14 institutions in the Pennsylvania State System of Higher Education. The data, provided by PASSHE and the community colleges, showed that during the 2007-08 school year 20% of Mifflinburg Area High School graduates required costly remediation in math and/or reading before they could take regular college courses.[99] This was the second highest remediation rate among the IU16 region's high schools.[100]
SAT scores
In 2014, Mifflinburg Area School District students took the SAT exams. The District's Verbal Average Score was 510. The Math average score was 503. The Writing average score was 484.[101] Statewide in Pennsylvania, Verbal Average Score was 497. The Math average score was 504. The Writing average score was 480. The College Board also reported that nationwide scores were: 497 in reading, 513 in math and 487 in writing.[102]
In 2013, Mifflinburg Area Senior High School students took the SAT exams. The School's Verbal Average Score was 504. The Math average score was 494. The Writing average score was 479. The College Board reported that statewide scores were: 494 in reading, 504 in math and 482 in writing. The nationwide SAT results were the same as in 2012.[103]
In 2012, 103 Mifflinburg Area School District students took the SAT exams. The District's Verbal Average Score was 502. The Math average score was 503. The Writing average score was 478. The statewide Verbal SAT exams results were: Verbal 491, Math 501, Writing 480. In the USA, 1.65 million students took the exams achieving scores: Verbal 496, Math 514, Writing 488. According to the College Board the maximum score on each section was 800, and 360 students nationwide scored a perfect 2,400.
In 2011, 108 Mifflinburg Area School District students took the SAT exams. The District's Verbal Average Score was 499. The Math average score was 506. The Writing average score was 471.[104] Pennsylvania ranked 40th among states with SAT scores: Verbal - 493, Math - 501, Writing - 479.[105] In the United States 1.65 million students took the exam in 2011. They averaged 497 (out of 800) verbal, 514 math and 489 in writing.[106]
AP Courses
In 2014, Mifflinburg Area High School offered 9 Advanced Placement (AP) courses at a higher cost than regular courses. The student pays the fee for the exam. The fee for each AP Exam is $91 (2014).[107] The school normally retains $9 of that fee as a rebate to help with administrative costs. In 2012, the fee was $89 per test per pupil. Students have the option of taking College Board approved courses and then taking the College Board's examination in the Spring. Students, who achieve a 3 or better on the exam, may be awarded college credits at US universities and colleges. Each higher education institution sets its own standards about what level of credits are awarded to a student based on their AP exam score. Most higher education give credits for scores of 4 or 5. Some schools also give credits for scores of 3. High schools give credits towards graduation to students who take the school's AP class. At Mifflinburg Area High School 33% of students who took an AP course earned a 3 or better on the exam.[108]
Middle school
Mifflinburg Area Middle School is located at 100 Mabel Street, Mifflinburg. In 2014, enrollment was 498 pupils, in grades 6th through 8th, with 33% of pupils eligible for a free lunch due to family poverty. Additionally, 14% of pupils received special education services, while 7.4% of pupils were identified as gifted.[109] According to a 2013 report by the Pennsylvania Department of Education, 100% of its teachers were rated "Highly Qualified" under No Child Left Behind.[110]
In 2010, the school enrolled 501 students in grades 5th through 8th with 165 students receiving for a federal free or reduced-price lunch due to family poverty. In 2010, the school employed 39 teachers, yielding a student–teacher ratio of 13:1.[111] All of the teachers were rated Highly Qualified under the No Child Left Behind Law.[112]
- 2016 School Performance Profile
SPP 2016 - 55.4 out of 100 points. Mifflinburg Area Middle School PSSA mandated testing results were: 56.5% of students in 8th grade were on grade level in reading, while 30.4% of students demonstrated on grade level in mathematics. In science, 61.8% of eighth grade pupils demonstrated on grade level science understanding.[113] In 7th grade, 61.9% of pupils were on grade level in reading, while just 34.6% demonstrated on grade level math skills. Among 6th graders, 60.9% were on grade level in reading and only 51.2% were on grade level in math.
- 2015 School Performance Profile
The PDE reported that 63% of 8th grade students at Mifflinburg Area Middle School students were on grade level in reading on the PSSAs given in April 2015. In math/Algebra 1, 40% of 8th grade students showed on grade level skills (21% below basic). In science, 75% of the school’s 8th graders demonstrated on grade level science understanding. No eighth grade writing scores were reported. In 7th grade, 55% were on grade level in reading, while 39% showed on grade level math skills. Among 6th graders, 59% were on grade level in reading and 51% were on grade level in mathematics.[114] Statewide 58% of eighth (8th) graders were on grade level in reading, while 29% demonstrated on grade level math skills. Pennsylvania 7th graders were58% on grade level in reading and 33% demonstrated on grade level math skills. Among sixth (6th) graders, 60.7% were reading on grade level, while 39.7% demonstrated on grade level math skills.[115]
- 2014 School Performance Profile
Mifflinburg Area Middle School achieved 73 out of 100. Reflects on grade level reading, mathematics and science achievement. In reading/literature - 79% were on grade level. In Algebra 1/Math, 89% showed on grade level mathematics skills. In Science, 72% of 8th graders showed on grade level science understanding. In writing, 74% of the 8th grade students demonstrated on grade level writing skills.[116]
- 2013 School Performance Profile
Mifflinburg Area Middle School achieved 83.2 out of 100. Reflects on grade level reading, mathematics, writing and science achievement. In reading, 78% of the students were on grade level. In Mathematics, 89.6% of the students showed on grade level skills. In Science, 64% of the 8th graders demonstrated n grade level understanding. In writing, 77.5% of the 8th grade students were on grade level.[117]
- AYP History
The Middle School achieved AYP status every year from 2003 through and 2012.[118]
- PSSA Results
|
8th Grade Reading |
8th Grade Math: |
8th Grade Science:
- 2012 - 72% on grade level (12% below basic). State – 59% of 8th graders were on grade level.
- 2011 - 69% (19% below basic). State - 58.3%
- 2010 - 60% (21% below basic). State - 57% [123]
- 2009 - 65% (14% below basic). State - 55%
|
7th Grade Reading:
|
7th Grade Math:
|
|
6th Grade Reading:
|
6th Grade Math:
|
Elementary schools
In 2014, Mifflinburg Area School District operates two elementary schools. The district operated four elementary schools, which scattered throughout the District, through the 2011-12 school year. In the spring of 2011, the Administration announced a plan to close three of the district's elementary schools, consolidating all pupils into a two buildings located in the borough of Mifflinburg.
Mifflinburg Area Intermediate School
Mifflinburg Area Intermediate School is located at 250 Mabel Street, Mifflinburg. In 2014, the school had 533 pupils in grades 3rd through 5th. In 2014, 40% of pupils received a free or reduced price lunch due to poverty, while 14% received special education services. Additionally, 5% were identified as gifted.[124] The school is a Title I school.
According to the National Center for Education Statistics, in 2012, Mifflinburg Area Intermediate School reported an enrollment of 525 pupils in grades 3rd through 5th, with 40% of pupils receiving a federal free or reduced price lunch due to family poverty. The school is a federally designated Title I school. The District's realignment shifted all 3rd grades to the building in 2012. According to a report by the Pennsylvania Department of Education, 100% of its teachers were rated "Highly Qualified" under No Child Left Behind.[125]
In 2011, Mifflinburg Area Intermediate School employed 22 teachers yielding a student-teacher ratio of 14:1. In 2011, the school served grades 4th and 5th [126] The school reported that in 2010 and 2009 was 95%.[127] The attendance rate was 96% in 2011.
- 2016 School Performance Profile
SPP 2016 - 77.8 out of 100 points. Mifflinburg Area Intermediate School PSSA mandated testing results were: 76.3% of students in 5th grade were on grade level in reading, while 68.3% of students demonstrated on grade level mathematics skills. In 4th grade, 63.2% were on grade level in reading, while 61.6% demonstrated on grade level math skills. In science, 82.7% of fourth grade pupils demonstrated on grade level understanding of science concepts in the state standards. Among the school's third graders, 67.6% were on grade level in reading and 61.8% showed on grade level mathematics skills.[128][129]
- 2015 School Performance Profile
According to the Pennsylvania Department of Education, 74% of 5th grade students at Mifflinburg Area Intermediate School were on grade level in reading on the PSSAs given in April 2015. In mathematics, 63% of 5th grade students showed on grade level skills. No fifth grade writing scores were reported. In 4th grade, 70% were on grade level in reading, while 59% showed on grade level math skills. In science, 86% of fourth graders showed on grade level understanding. Among third (3rd) graders, 67% were on grade level in reading and 64% were on grade level in mathematics.[130] Statewide 61.9% of fifth (5th) graders were on grade level in reading, while 42.8% demonstrated on grade level math skills. Pennsylvania 4th graders were 58.6% on grade level in reading and 44.4% demonstrated on grade level math skills. In science, 77.3% of fourth graders showed on grade level understanding. Among Pennsylvania third (3rd) graders, 62% were reading on grade level, while 48.5% demonstrated on grade level math skills.[131]
- 2014 School Performance Profile
Mifflinburg Intermediate School achieved a score of 84.9 out of 100. The score reflects on grade level: reading, science, writing and mathematics achievement. In 2013-14, only 75% of the students were reading on grade level in grades 3rd through 5th. In 3rd grade, 77.9% of the pupils were reading on grade level. In math, 81.8% were on grade level (3rd-5th grades). In 4th grade science, just 88.7% of the pupils demonstrated on grade level understanding. In writing, only 79% of 5th grade pupils demonstrated on grade level skills.[132]
- 2013 School Performance Profile
Mifflinburg Area Intermediate School achieved 92.2 out of 100. The score reflects on grade level: reading, science, writing and mathematics achievement. In 2012-13, 78% of the students were reading on grade level in grades 3rd through 5th. In 3rd grade, 84.8% of the pupils were reading on grade level. In math, 85.7% showed on grade level skills. In 4th grade science, 86% of the pupils demonstrated on grade level understanding. In writing, 80.9% of 5th grade pupils were on grade level.[133] The Mifflinburg Area Intermediate School received a Governor’s Award for Excellence in Academics for the 2012-13 school year, honoring the school’s 92.2 school performance profile.
- AYP History
In 2012, Mifflinburg Area Intermediate School declined to Warning AYP status due to lagging reading achievement. The school achieved AYP status in 2009, 2010 and 2011.[134]
- PSSA results
|
|
- 4th Science
- 2012 - 89% (47% Advanced). State - 82%
- 2011 - 90.5% (48.7% Advanced). State - 82.9%
- 2010 - 90% (56% advanced). State - 81%
- 2009 - 88% (49% advanced), State - 83%
- 2008 - 94% (48% below basic), State - 81%
|
|
Mifflinburg Elementary School
Mifflinburg Elementary School is located at 115 Shipton Street, Mifflinburg. n 2016, the School reported a declining enrollment of 429 students in grades kindergarten through second grade. The school remains a Title I school with 44.99% of its pupils receiving a free or reduced price lunch due to poverty, while 13.5% receive Special Education services. Additionally, 0.23% of pupils were identified as gifted. All of the teachers were rated Highly Qualified under the No Child Left Behind Law. The school continues to provide full day kindergarten.
In 2014, the School reported an enrollment of 460 students in grades kindergarten through second grade. The school remains a Title I school with 46.5% of its pupils receiving a free or reduced price lunch due to poverty, while 13% receive Special Education services. Additionally, less than 1% of pupils were identified as gifted. All of the teachers were rated Highly Qualified under the No Child Left Behind Law.[143] The district has offered full day kindergarten since 2003.[144][145]
In 2013, Mifflinburg Elementary School reported an enrollment of 479 students in grades kindergarten through second grade. The school is a Title I school with 42.8% of its pupils receiving a free or reduced price lunch due to poverty. The District's realignment of schools meant no students in the Mifflinburg Elementary School were tested through the PSSAs which begin in 3rd grade. All of the teachers were rated Highly Qualified under the No Child Left Behind Law.[143] The School offers full day kindergarten.[146] The school also offers taxpayer funded PreK Counts preschool program in a cooperative program with a locally based child care company.[147]
In 2010, Mifflinburg Elementary School enrolled 471 students in grades kindergarten through 4th, with 185 students receiving a federal free or reduced-price lunch due to family poverty. In 2010, the school employed 40 teachers, yielding a student–teacher ratio of 11:1.[148] All of the teachers were rated Highly Qualified under the No Child Left Behind Law.[149]
- School Performance Profile
In 2015 and 2016, the Mifflinburg Elementary School's School Performance Profile score was withheld by the Pennsylvania Department of Education.[150]
- 2014 School Performance Profile
Mifflinburg Elementary School achieved a score of 85.1 out of 100. The score reflects on grade level: reading and mathematics achievement. In 2013-14, 77.9% of the students were reading on grade level. In math, 79.7% demonstrated on grade level mathematics skills.[151]
- 2013 School Performance Profile
Mifflinburg Elementary School achieved a score of 87 out of 100. The score reflects on grade level: reading and mathematics achievement. In 2012-13, 84.8% of the students were reading on grade level. In math, 83% demonstrated on grade level mathematics skills.[152]
- AYP History
In 2004 through 2012, Mifflinburg Area Elementary School achieved Adequate Yearly Progress (AYP') status each year.[153] The attendance rate was: 95% in 2011, 96% In 2010 and 95% in 2009.[154]
- PSSA Results
Each year, in the Spring, the 3rd graders took the PSSAs in math and reading.
- 3rd graders Math
- 2012 - 87% on grade level (44% advanced). State - 80%
- 2011 - 86.6% (37% advanced), State - 83.5% [155]
- 2010 - 91.1%, State - 84% [156]
- 2009 - 86.2%, State - 81.3% [157]
- 2008 - 92.3%, State - 81% [158]
- 2007 - 80.3%, State - 78%
- 3rd Graders Math low income pupils on grade level
- 2012: 83% on grade level, Advanced - 35% | Proficient - 48%, State - 66%
- 2011: 75%, Advanced - 23% | Proficient - 52%, State - 73%
- 2010: 84.8%, Advanced - 37% | Proficient – 47.8%, State - 74.7%
- 3rd graders Reading on grade level
- 2012 - 73% (13% below basic). State - 74%
- 2011 - 71.4% (14% below basic). State - 77%
- 2010 - 79.5% (11% below basic). State - 75%
- 2009 - 78.4%, State - 77%[159]
- 2008 - 70.9%, State - 77%
- 2007 - 64.9%, State - 72%
- 3rd Graders Reading low income pupils on grade level
- 2012: 67%, Advanced - 22% | Proficient - 44%, State - 59%
- 2011: 65%, Advanced - 13% | Proficient - 52%, State - 64%
- 2010: 71.8%, Advanced - 19.6% | Proficient – 52.2%, State – 61.2%
Special education
In December 2015, the District administration reported that 283 pupils or 14.2% of the district's pupils received Special Education services, with 39.9% of the identified students having a specific learning disability. Eight percent (8%) of pupils were reported as having autism.[160]
In December 2012, Mifflinburg Area School District administration reported that 361 pupils or 16.7% of the District's pupils received Special Education services. Of the identified students 45% had specific learning disabilities. In December 2010, the District administration reported that 372 pupils or 16% of the District's pupils received Special Education services. Of the identified students 48% had specific learning disabilities. In December 2009, the District administration reported that 374 pupils or 17% of the district's pupils received Special Education services.[161] Special education services in the Commonwealth are provided to students from ages three years to 21 years old. In the 2010-2011 school year, the total student enrollment was more than 1.78 million students with approximately 275,000 students eligible for special education services. Among these students 18,959 were identified with mental retardation and 21,245 students with autism.[162] The largest group of students are identified as Specific Learning Disabilities 126,026 students (46.9 percent) and Speech or Language Impairments with 43,542 students (16.2 percent).
In 2007, Pennsylvania Secretary of Education Gerald Zahorchak testified before the Pennsylvania House Education Committee regarding full day kindergarten. He claimed that districts which offered the program would see a significant decrease in special education students due to early identification and early intervention. He asserted the high cost of full day kindergarten would be recouped by Districts in lower special education costs.[163] Mifflinburg Area School District has seen a minimal decrease in the percentage of special education students it serves, yielding no savings.[164]
The District engages in identification procedures to ensure that eligible students receive an appropriate educational program consisting of special education and related services, individualized to meet student needs. At no cost to the parents, these services are provided in compliance with state and federal law; and are reasonably calculated to yield meaningful educational benefit and student progress. To identify students who may be eligible for special education, various screening activities are conducted on an ongoing basis. When a child experiences difficulty within the classroom, screening information will be gathered by a multidisciplinary team located within the child’s school to determine his or her specific needs. These screening activities include: review of group-based data (cumulative records, enrollment records, health records, report cards, ability and achievement test scores); hearing, vision, motor, and speech/language screening; and review by the Instructional Support Team or Student Assistance Team. When screening results suggest that the student may be eligible, the District seeks parental consent to conduct a multidisciplinary evaluation. Parents who suspect their child is eligible make a written request for a multidisciplinary evaluation to the building principal.[165]
In 2010, the state of Pennsylvania provided $1,026,815,000 for Special Education services. This funding is in addition to the state's basic education per pupil funding, as well as, all other state and federal funding.[166] The Pennsylvania Special Education funding system assumes that 16% of the district’s students receive special education services. It also assumes that each student’s needs accrue the same level of costs.[167] The state requires each district to have a three-year special education plan to meet the unique needs of its special education students.[168] Overidentification of students, in order to increase state funding, has been an issue in the Commonwealth. Some districts have more than 20% of its students receiving special education services while others have 10% supported through special education.[169] In 2012, the Obama Administration's US Department of Education issued a directive that schools include students with disabilities in extracurricular activities, including sports.[170]
Mifflinburg Area School District received a $1,312,069 supplement for special education services in 2010.[171] For the 2011-12, 2012–13, and the 2013-14 school years, all Pennsylvania public school districts received the same level of funding for special education that they received in 2010-11. This level funding is provided regardless of changes in the number of pupils who need special education services and regardless of the level of services the respective students required.[172][173] Additionally, the state provides supplemental funding for extraordinarily impacted students. The District must apply for this added funding. In 2014-15, Mifflinburg Area School District will receive $1,338,851 in state special education funding.[174] For the 2016-17 school year, Mifflinburg Area School District received a 1% increase in state special education funding to $1,364,430.[175]
Gifted education
Mifflinburg Area School District Administration reported that 69 or 3.15% of its students were gifted in 2009.[176] The program focuses on experiences directly related to general classes, expanding on current instructional material. Acceleration through the grade level content is provided by a gifted instructor, utilized enrichment opportunities, and advanced content related activities. The program is based on the interests of the student, allowing them to develop critical thinking skills. Secondary level students (7-12) are provided the opportunity to participate in Honors and Advanced Placement courses.
By law, the District must provide mentally gifted programs at all grade levels. The referral process for a gifted evaluation can be initiated by teachers or parents by contacting the student’s building principal and requesting an evaluation. All requests must be made in writing. The principal acts as the case manager for the referral process. A 60 calendar day time-line begins when the signed Permission to Evaluate form is received. To be eligible for mentally gifted programs in Pennsylvania, a student must have a cognitive ability of at least 130 as measured on a standardized ability test by a certified school psychologist. Other factors that indicate giftedness will also be considered for eligibility.[177] Through the strategic planning process, the Superintendent must ensure that Mifflinburg Area School District provides a continuum of program and service options to meet the needs of all mentally gifted students for enrichment, acceleration, or both. Mifflinburg Area School District's program is based on student needs and provides differentiated curriculum using acceleration, enrichment and pull-out options.
Budget
Pennsylvania public school districts budget and expend funds according to procedures mandated by the General Assembly and the Pennsylvania Department of Education (PDE). An annual operating budget is prepared by school district administrative officials. A uniform form is furnished by the PDE and submitted to the board of school directors for approval prior to the beginning of each fiscal year on July 1.
Under Pennsylvania’s Taxpayer Relief Act, Act 1 of the Special Session of 2006, all school districts of the first class A, second class, third class and fourth class must adopt a preliminary budget proposal. The proposal must include estimated revenues and expenditures and the proposed tax rates. This proposed budget must be considered by the Board no later than 90 days prior to the date of the election immediately preceding the fiscal year. The preliminary budget proposal must also be printed and made available for public inspection at least 20 days prior to its adoption. The board of school directors may hold a public hearing on the budget, but are not required to do so. The board must give at least 10 days’ public notice of its intent to adopt the final budget according to Act 1 of 2006.[178]
Mifflinburg Area School Board and Mifflinburg Area Education Association reached a 4-year agreement in June 2015. The contract will be in effect from July 1, 2014, through June 30, 2018.[179]
In 2013, the average teacher salary in Mifflinburg Area School District was $50,028 a year, while the cost of the benefits teachers received was $24,325 per employee, for a total annual average teacher compensation of $74,354.[180] According to a report by State Representative Fred Keller, the Mifflinburg Area School District awarded its teachers raises which exceeded the rate of inflation for more than a decade.[181]
In 2012, the average teacher salary in Mifflinburg Area School District was $49,861 a year, while the cost of the benefits teachers received was $17,613 per employee, for a total annual average teacher compensation of $67,475.[182] In 2012, the Mifflinburg teachers Union agreed to a two-year contract which provided a 1% raise over two years. The union reported opting to preserve jobs over getting raises.[183] In 2011, the District employed 180 teachers with an average salary of $52,240 and a top salary of $100,000.[184]
In 2009, Mifflinburg Area School District reported employing 232 teachers and administrators with a median salary of $51,847 and a top salary of $113,300.[185] The school year is 184 days, including 4 inservice days. Teachers work a 7.5-hour day with a 30-minute duty-free lunch period. Additionally, the teachers receive a defined benefit pension, health insurance, professional development reimbursement, 1-2 paid personal day, 10 paid sick days (which accumulate), 5 paid bereavement days, 2 paid emergency leave days, paid inservice leave to full-time professional employees during the regular school year without loss of pay, or during vacation periods, and other benefits. Union employees with thirty years of credited teaching service receive a longevity service salary increment of $1,000. Professional employees who are contracted to work more than the contracted school year are paid at the rate of $20.00 per hour when working with students. Teachers working with extracurriculars receive additional compensation and a 3% raise on that stipend each year. Teachers appointed as: Head teachers, Department lead teachers or Literacy Coach are awarded substantial additional compensation.[186] Retirement package: "After retiring with thirty-five (35) years of service (in the PA Public School Employees’ Retirement System) and fifteen (15) years of service in the Mifflinburg Area School District, the District shall deposit sixty-thousand ($60,000) dollars, (ten-thousand ($10,000) dollars per year) into a Health Retirement Account for the purpose of providing health care." additionally, teacher retirees receive $25 per unused accumulated sick day.[187]
In 2007, Mifflinburg Area School District employed 156 teachers who earned an average salary of $48,107 for 180 days worked.[188] The District's contract with the local teachers' union was through the 2010-2011 school year.[189]
In May 2009, Superintendent Barry Tomasetti reported that the District earmarks $489,407, of the $24 million 2009-2010 budget, for noninstructional services, such as student athletics.
Per pupil spending The Mifflinburg Area School District administration reported that per pupil spending in 2008 was $9,649 which ranked 490th in the state's 501 school districts.[190] In 2010 the per pupil spending had increased to $10,534.83 [191]
The U.S. Census Bureau reported that Pennsylvania spent $8,191 per pupil in school year 2000-01.[192] In 2007, the Pennsylvania per pupil total expenditures was reported as $12,759.[193] Among the fifty states, Pennsylvania’s total per pupil revenue (including all sources) ranked 11th at $15,023 per student, in 2008-09.[194] Pennsylvania’s total revenue per pupil rose to $16,186 ranking 9th in the nation in 2011.[195]
Mifflinburg Area School District administrative costs per pupil in 2008 was $572.33 per pupil. This ranked 465th among the then 501 public school districts in the Commonwealth. The lowest administrative cost per pupil in Pennsylvania was $398 per pupil.[196]
Reserves In 2008, the district reported a balance of $800,000 in an unreserved-designated fund. The unreserved-undesignated fund balance was reported as $2,134,350. [197] In 2010, Mifflinburg Area Administration reported a decrease to $917,187 in the unreserved-undesignated fund balance and a balance of $800,000 in its unreserved-designated fund. Pennsylvania school district reserve funds are divided into two categories – designated and undesignated. The undesignated funds are not committed to any planned project. Designated funds and any other funds, such as capital reserves, are allocated to specific projects. School districts are required by state law to keep 5 percent of their annual spending in the undesignated reserve funds to preserve bond ratings. According to the Pennsylvania Department of Education, from 2003 to 2010, as a whole, Pennsylvania school districts amassed nearly $3 billion in reserved funds.[198]
Realignment and closures In March 2011, the Mifflinburg Area School Board announced the intent to close Laurelton Elementary School due to low enrollment of 55 pupils coupled with high costs to make repairs and upgrades.[199] Two other elementary school may also be closed for the same reasons. The district estimates saving over $500,000 by reconfiguring the elementary schools. Under consideration are closing New Berlin Elementary School (enrollment 79 pupils) and Buffalo Crossroads Elementary School (enrollment 66 pupils).[200][201]
Audit In January 2010, the Pennsylvania Auditor General conducted a performance audit of the district. The findings were reported to the administration and the school board.[202]
Tuition Students who live in the Mifflinburg Area School District's attendance area may choose to attend one of Pennsylvania's 157 public charter schools. A student living in a neighboring public school district or a foreign exchange student may seek admission to Mifflinburg Area School District. For these cases, the Pennsylvania Department of Education sets an annual tuition rate for each school district. It is the amount the public school district pays to a charter school for each resident student that attends the charter and it is the amount a nonresident student's parents must pay to attend the District's schools. The 2012 tuition rates are Elementary School - $8,004, High School - $9,186.[203]
Mifflinburg Area School District is funded by a combination of: a local earned income tax 2.05%,[204] a property tax, a real estate transfer tax 0.5%, coupled with substantial funding from the Commonwealth of Pennsylvania and the federal government.[205] Grants can provide an opportunity to supplement school funding without raising local taxes. Interest earnings on accounts also provide nontax income to the District. In the Commonwealth of Pennsylvania, pension income and Social Security income are exempted from state personal income tax and local earned income tax, regardless of the level of the individual’s personal wealth.[206] The average Pennsylvania public school teacher pension in 2011 exceeds $60,000 a year plus they receive federal Social Security benefits: both are free of Pennsylvania state income tax and local income tax which funds local public schools.[207]
State basic education funding
According to a report from Representative Todd Stephens office, Mifflinburg Area School District receives 45.6% of its annual revenue from the state.[208]
For the 2016-17 school year, Mifflinburg Area School District received $7,848,522 in Basic Education Funding from the Commonwealth of Pennsylvania. This is a 2% increase over 2015-16 funding to the District. The highest percentage of BEF increase in Union County was 7.5% awarded to Lewisburg Area School District under the state’s Basic Education Funding formula. For the 2016-17 school year, Pennsylvania increased its public education spending to a record high of $5,895 billion. It was a $200 million increase, 3.51% increase over the 2015-16 education appropriation.[209] The state also funded Ready to Learn grants at $250 million and Special Education funding received a $20 million increase.[210] The state also paid $492 million to the school employee social security fund and another $2.064 billion to the teacher’s pension fund.[211] MIfflinburg Area School District also received an increase in special education funding and Ready to Learn grant targeted funding, from the Commonwealth.
For the 2015-16 school year, Governor Tom Wolf released a partial Basic Education Funding of $3,742,902 to Mifflinburg Area School District, in January 2016.[212] This was part of $10.3 billion in school funding withheld from the public school, by the Governor since the summer of 2015.[213] The dispersment did not follow the new Basic Education Funding formula which had been established by the Pennsylvania General Assemby in 2015.[214][215] In April 2016, Governor Wolf announced his finalized dispersement of 2015-16 state Basic Education Funding. Mifflinburg Area School District received a 2.37% increase for a total funding of $7,992,512. This is $46,683 more than the District was to receive by law under the state’s Fair Funding Formula approved in 2015.[216] This was also the highest increase among Union County public school districts.[217] The highest increase in funding statewide was awarded by Governor Wolf to Wilkinsburg Borough School District which received a 48.07% increase in state Basic Education Funding. The average BEF increase among the Commonwealth’s 500 public school districts for 2015-16 was 2.21%.
For the 2014-15 school year, Mifflinburg Area School District received $7,527,720 in State Basic Education funding. The District also received $147,880 in Accountability Block Grant funding and $138,306 in new Ready To Learn Block grant. The State’s enacted Education Budget included $5,526,129,000 for the 2014-2015 Basic Education Funding.[218] The Pennsylvania Education budget also included Accountability Block Grant funding at $100 million and $241 million in new Ready to Learn funding for public schools that focus on student achievement and academic success. The State paid $500.8 million to Social Security on the school employees behalf and another $1.16 billion to the state teachers pension system (PSERS). In total, Pennsylvania’s Education budget for K-12 public schools was $10 billion. This was a $305 million increase over 2013-2014 state spending and the greatest amount ever allotted by the Commonwealth for its public schools.[219]
For the 2013-14 school year, the Mifflinburg Area School District received a 2% increase or $7,529,669 in Pennsylvania Basic Education Funding. This is $147,880 more than its 2012-13 state BEF to the District. Additionally, Mifflinburg Area School District received $141,281 in Accountability Block Grant funding to focus on academic achievement and level funding for special education services. Among the public school districts in Union County, Lewisburg Area School District received the highest percentage increase in BEF at 2.9%. The District has the option of applying for several other state and federal grants to increase revenues. The Commonwealth’s budget increased Basic Education Funding statewide by $123 million to over $5.5 billion. Most of Pennsylvania’s 500 public school districts received an increase of Basic Education Funding in a range of 0.9% to 4%. Eight public school districts received exceptionally high funding increases of 10% to 16%. The highest increase in state funding was awarded to Austin Area School District which received a 22.5% increase in Basic Education Funding.[220] The state funded the PSERS (Pennsylvania school employee pension fund) with $1,017,000,000 and Social Security payments for school employees of $495 million.[221]
For the 2012-13 school year, the Mifflinburg Area School District received $7,381,789.[222] The Governor's Executive Budget for 2012-2013 included $9.34 billion for kindergarten through 12th grade public education, including $5.4 billion in basic education funding, which was an increase of $49 million over the 2011-12 budget. In addition, the Commonwealth provided $100 million for the Accountability Block Grant (ABG) program. Mifflinburg Area School District received $141,281 in Accountability Block Grant funding to focus on academic achievement. The state also provided a $544.4 million payment for School Employees’ Social Security and $856 million for School Employees’ Retirement fund called PSERS.[223] This amount was a $21,823,000 increase (0.34%) over the 2011-2012 appropriations for Basic Education Funding, School Employees' Social Security, Pupil Transportation, Nonpublic and Charter School Pupil Transportation. Since taking office, Corbett’s first two budgets have restored more than $918 million in support of public schools, compensating for the $1 billion in federal stimulus dollars lost at the end of the 2010-11 school year.
In 2011-12, the Mifflinburg Area School District will receive $7,381,789 in state Basic Education Funding.[224] Additionally, Mifflinburg Area School District received $141,281 in Accountability Block Grant funding.[225] The enacted Pennsylvania state Education budget includes $5,354,629,000 for the 2011-2012 Basic Education Funding appropriation. This amount is a $233,290,000 increase (4.6%) over the enacted State appropriation for 2010-2011. The highest increase in state basic education funding was awarded to Duquesne City School District, which got a 49% increase in state funding for 2011-12.[226] Districts experienced a reduction in funding due to the loss of federal stimulus funding which ended in 2011.
For the 2010-11 school year, the Mifflinburg Area School District received 3.87% increase in state basic education Funding for a total of $8,042,180. One hundred fifty Pennsylvania school districts received the base 2% increase. Among Pennsylvania's 500 school districts, the highest increase in 2010-11 went to Kennett Consolidated School District in Chester County which received a 23.65% increase in state funding.[227] One hundred fifty Pennsylvania school districts received the base 2% increase. The highest increase in 2010-11 went to Kennett Consolidated School District in Chester County, which received a 23.65% increase in state funding.[228] Fifteen (15) Pennsylvania public school districts received a BEF increase of greater than 10%. The state's hold harmless policy regarding state basic education funding continued where each district received at least the same amount as it received the prior school year, even when enrollment had significantly declined. The amount of increase each school district received was determined by then Governor Edward Rendell and the Secretary of Education, Gerald Zahorchak, through the allocation set in the state budget proposal made in February each year.[229] In 2010, the district reported that 741 pupils received a free or reduced-price lunch due to the family meeting the federal poverty level.
For the 2009-10 school year, Mifflinburg Area School District received a 4.89% increase in state Basic Education funding for $360,633 pushing the total state Basic Education funding to $7,742,422. In Pennsylvania, over 15 school districts received Basic Education Funding increases in excess of 10% in 2009. Muhlenberg School District in Berks County received the highest with a 22.31% increase in funding.[230] The District received funding under several state and federal funding programs, including Accountability Block Grants, specialized grants and Title 1 funding for low-income students among others. The amount of increase each school district received was set by Governor Edward G. Rendell and the Secretary of Education Gerald Zahorchak, as a part of the state budget proposal.[231]
In the 2008-09 budget year, the state's Basic Education Funding to the Mifflinburg Area School District was $7,381,789. According to the Pennsylvania Department of Education, 667 students, in the district, received free or reduced-price lunches due to low family income in the 2007-2008 school year.[232]
Accountability Block Grants
Beginning in 2004-2005, the state launched the Accountability Block Grant school funding. This program has provided $1.5 billion to Pennsylvania’s school districts. The Accountability Block Grant program requires that its taxpayer dollars are focused on specific interventions that are most likely to increase student academic achievement. These interventions include: teacher training, all-day kindergarten, lower class size K-3rd grade, literacy and math coaching programs that provide teachers with individualized job-embedded professional development to improve their instruction, before or after school tutoring assistance to struggling students, For 2010-11 the Mifflinburg Area School District applied for and received $383,473 in addition to all other state and federal funding. The district used the funding to provide full-day kindergarten since 2004.[233][234]
Ready to Learn grant
Beginning in the 2014-2015 budget, the State funded a new Ready to Learn Grant for public schools. A total of $100 million is allocated through a formula to districts based on the number of students, level of poverty of community as calculated by its market value/personal income aid ratio (MV/PI AR) and the number of English language learners. Ready to Learn Block Grant funds may be used by the Districts for: school safety; Ready by 3 early childhood intervention programs; individualized learning programs; and science, technology, engineering and math (STEM) programs.[235]
Mifflinburg Area School District will receive $138,306 in Ready to Learn Grant dollars in addition to State Basic Education funding, Special Education funding, Accountability Block Grant funding, reimbursement for Social Security payments for employees and other state grants which the District must apply to receive.
Education Assistance grant
The state's Education Assistance Program funding provides for the continuing support of tutoring services and other programs to address the academic needs of eligible students. Funds are available to eligible school districts and full-time career and technology centers (CTC) in which one or more schools have failed to meet at least one academic performance target, as provided for in Section 1512-C of the Pennsylvania Public School Code. In 2010-11, the Mifflinburg Area School District received $47,123.[236]
Classrooms for the Future grant
The Classroom for the Future state program provided districts with hundreds of thousands of extra state funding to buy laptop computers for each core curriculum high school class (English, Science, History, Math) and paid for teacher training to optimize the computers use. The program was funded from 2006-2009. Mifflinburg Area School District did not apply to participate in 2006-07. In 2007-08, The District received $198,569 and $59,896 in 2008-09 for a total funding of $258,465.[237] Among the public school districts in Union County the highest award was given to Mifflinburg Area School District. The highest funding statewide was awarded to Philadelphia City School District in Philadelphia County - $9,409,073. The grant program was discontinued by Governor Edward Rendell as part of the 2009-10 state budget.
Other grants
Mifflinburg Area School District did not participate in: Pennsylvania Department of Environmental Protection's Environmental Education annual grants,[238][239] PA Science Its Elementary grants (discontinued effective with 2009-10 budget by Governor Rendell),[240] 2012 Striving Readers Comprehensive Literacy grant,[241] 2012 and 2013 Hybrid Learning Grants,[242] Project 720 High School Reform grants[243] (discontinued effective with 2011-12 budget); 2013 Safe Schools and Resource Officer grants nor the federal 21st Century Learning grants.
Federal funding
Mifflinburg Area School District received $1,697,768 in Federal Stimulus ARRA funds. This was in addition to all regular state and federal funding.[244] These dollars must be focused on program to improve the academic achievement of students receiving free and reduced-price lunch or special education students.[245] The funding was limited to the 2009-10 and 2010-2011 school years.[246] Due to the temporary nature of the funding, schools were repeatedly advised to use the funds for one time expenditures like: acquiring equipment, making repairs to buildings, training teachers to provide more effective instruction or purchasing books and software.
Race to the Top grant
Mifflinburg Area School District officials did not apply for the federal Race to the Top grant which would have meant hundreds of thousands in additional federal dollars to improve student achievement. The school board, administration and the teachers' union opted for local control and additional local property taxes. Participation required the administration, the school board and the local teachers' union to sign an agreement to prioritize improving student academic success. In Pennsylvania, 120 public school districts and 56 charter schools agreed to participate.[247] Pennsylvania was not approved for the grant. The failure of districts to agree to participate was cited as one reason that Pennsylvania was not approved.[248][249][250]
Title II grants
The Federal government provides annual grants to schools to be used to improve the quality of teacher instructions to pupils. The goal is to provide each child in public schools with “High Quality” teachers and principals as defined by the state.[251] The funds are sent to the state Department of Education which distributes them to each school district and charter school.[252] Beginning in 2002, the federal funding committed to Title II was $3,175,000,000.
Public school district administrations must apply to the state annually for the Title II funds. In 2012-13, Mifflinburg Area School District received $155,439 in federal Title II funding.[253] In 2014-15, Mifflinburg Area School District applied for and received $148,654.[254]
English language learners grant
The Federal government provides annual grants to schools to assist in educating immigrant children and children who are identified as limited English proficient.[255] Upon registering for school a language survey is done for all new enrollment pupils, typically in kindergarten or preschool. They identify the primary language spoken at home. This data is collected and submitted to the Pennsylvania Department of Education, which in turn notifies the federal government.[256]
In 2012-13, Mifflinburg Area School District received $2,987 in Title III funding for English language learners.[257] For 2014-15, Area School District received $4,562 in Title III funding.[258]
Enrollment
In May 2011, the Mifflinburg Area School District Administration announced it would be reducing teaching positions due to a 10% decline in enrollment over the past 10 years. The District announced it will also not fill positions vacated by retirements in 2011.[259] The District reported a substantial decline in enrollment, especially in the elementary buildings. The School Board closed Laurelton Elementary School, effective the end of the 2011 school year, due to very low enrollment {55 pupils} coupled with multimillion dollars costs to repair the building. The MIfflinburg Area School Board also announced a review of the issues of maintaining two other school buildings - Buffalo Crossroads Elementary School and New Berlin Elementary School, both of which were older buildings and had very low enrollment. The administration anticipated savings of $570,000 in staffing and operating costs.[201]
The Pennsylvania Department of Education reported that there were 2,100 students enrolled in K-12 with declining enrollment projected through 2015.[260] The District's administrative costs per pupil in 2008 were $572 per pupil. The lowest administrative cost per pupil in Pennsylvania was $398 per pupil.[261] With limited resources, opportunities for students are limited. A Standard and Poors study found that consolidation of administrations with an adjacent school district would achieve substantial administrative cost savings for people in both communities.[262][263] According to a proposal by then Governor Edward Rendell, the excessive administrative overhead dollars could be redirected to improving high school student academic achievement, enriching the curriculum programs or to reducing local property taxes.[264] Consolidation of two central administrations into one would not require the closing of any schools.[265]
From 2000 through 2010, rural Pennsylvania public school district enrollment has decreased by 8 percent.[266] In 2010, there were 726,417 children in rural Pennsylvania, or 21 percent of the total rural population. From 2000 to 2010, the number of children in rural counties decreased 7 percent. The decline in the number of children impacted most rural counties with 42 of Pennsylvania’s 48 rural counties experiencing a decline. Cameron County, Elk County and Sullivan County experienced the greatest declines, with a decrease of more than 21 percent in all three counties. Union County's live birth rate was 414 births in 1990. Union County's live birth rate in 2000 was 395 births while in 2011 it was 395 babies.[267] Union County is home to a large Amish and Mennonite population whose children do not attend the local public schools. Over the past 50 years (1960 to 2010), rural Pennsylvania saw a steady decline in both the number and proportion of residents under 18 years old. In 1960, 1.06 million rural residents, or 35 percent of the rural population, were children.
Common Cents state initiative
The school board elected to not participate in the Pennsylvania Department of Education Common Cents program. The program called for the state to audit the district, at no cost to local taxpayers, to identify ways the district could save tax dollars.[268] After the review of the information, the district was not required to implement the recommended cost savings changes.
Real estate taxes
Mifflinburg Area School Board set property taxes for 2015-16 at 11.3877 mills.[269][270] (A mill is $5 of tax for every $1,000 of a property's assessed value), $15 per capita taxes, 1.55 percent of 2.05 percent on local earned income tax and a real estate transfer tax 0.5%.[271] Property taxes, in the Commonwealth of Pennsylvania, apply only to real estate - land and buildings. The property tax is not levied on cars, business inventory, or other personal property. Certain types of property are exempt from property taxes, including: places of worship, places of burial, private social clubs, charitable and educational institutions and all government property (local, state and federal). Unlike other states, under Pennsylvania state tax policy, natural gas and oil pipelines are exempted from property taxes.[272] Additionally, service related, disabled US military veterans may seek an exemption from paying property taxes. Pennsylvania school district revenues are dominated by two main sources: 1) Property tax collections, which account for the vast majority (between 75-85%) of local revenues; and 2) Act 511 tax collections, which are around 15% of revenues for school districts.[273] When a Pennsylvania public school district includes municipalities in two counties, each of which has different rates of property tax assessment, a state board equalizes the tax rates between the counties.[274] In 2010, miscalculations by the State Tax Equalization Board (STEB) were widespread in the Commonwealth and adversely impacted funding for many school districts, including those that did not cross county borders.[275]
The average yearly property tax paid by Union County residents amounts to about 3.25% of their yearly income. Union County ranked 476th out of the 3143 United States counties for property taxes as a percentage of median income.[288] According to a report prepared by the Pennsylvania Department of Education, the total real estate taxes collected by all school districts in Pennsylvania rose from $6,474,133,936 in 1999-00 to $10,438,463,356 in 2008-09 and to $11,153,412,490 in 2011.[289] Property taxes in Pennsylvania are relatively high on a national scale. According to the Tax Foundation, Pennsylvania ranked 11th in the U.S. in 2008 in terms of property taxes paid as a percentage of home value (1.34%) and 12th in the country in terms of property taxes as a percentage of income (3.55%).[290]
Property tax relief
In 2015, Mifflinburg Area School District approved 3,720 homestead properties to receive $153 in state property tax relief.[291] The increase in funding was related to a decline in the number of properties applying in Mifflinburg.
For 2013, the property tax relief, for the district, was set at $146 for 3,896 approved homesteads.[292] For 2012, the property tax relief, for the district, was set at $142 for 4,000 approved homesteads. In 2010, the Mifflinburg School District property tax relief was set at $156 for 3,632 approved homesteads.[293] In 2009, the Homestead/Farmstead Property Tax Relief from gambling for Mifflinburg Area School District was $141 per approved permanent primary homestead. In 2008, the tax relief was $156. The relief was subtracted from the total annual school property tax bill. Property owners apply for the relief through the county Treasurer's office. Farmers can qualify for a second farmstead exemption on building used for agricultural purposes. The farm must be at least 10 contiguous acres and must be the primary residence of the owner. The highest property tax relief in Pennsylvania went to the residents of Chester Upland School District of Delaware County who received $632 per approved homestead. CUSD has been the top beneficiary since the tax relief program began.[294]
Additionally, the Pennsylvania Property Tax/Rent Rebate program is provided for low income Pennsylvanians aged 65 and older; widows and widowers aged 50 and older; and people with disabilities age 18 and older. The income limit is $35,000 for homeowners. The maximum rebate for both homeowners and renters is $650. Applicants can exclude one-half (1/2) of their Social Security income, so people whose income is substantially more than $35,000 may still qualify for a rebate. Individuals must apply annually for the rebate.[295]
Act 1 Adjusted index
The Act 1 of 2006 Index regulates the rates at which each school district can raise property taxes in Pennsylvania. Districts are not allowed to raise taxes above that index unless they allow voters to vote by referendum, or they seek an exception from the state Department of Education. The base index for the 2011-2012 school year is 1.4 percent, but the Act 1 Index can be adjusted higher, depending on a number of factors, such as property values and the personal income of district residents. Act 1 included 10 exceptions, including: increasing pension costs, increases in special education costs, a catastrophe like a fire or flood, increase in health insurance costs for contracts in effect in 2006 or dwindling tax bases. The base index is the average of the percentage increase in the statewide average weekly wage, as determined by the Pennsylvania Department of Labor and Industry, for the preceding calendar year and the percentage increase in the Employment Cost Index for Elementary and Secondary Schools, as determined by the Bureau of Labor Statistics in the U.S. Department of Labor, for the previous 12-month period ending June 30. For a school district with a market value/personal income aid ratio (MV/PI AR) greater than 0.4000, its index equals the base index multiplied by the sum of .75 and its MV/PI AR for the current year.[296] In June 2011, the Pennsylvania General Assembly eliminated six of the ten exceptions to the Act 1 Index.[297] The following exceptions were maintained: 1) costs to pay interest and principal on indebtedness incurred prior to September 4, 2004 for Act 72 schools and prior to June 27, 2006 for non-Act 72 schools; 2) costs to pay interest and principal on electoral debt; 3) costs incurred in providing special education programs and services (beyond what is already paid by the State); and 4) costs due to increases of more than the Index in the school’s share of payments to PSERS (PA school employees pension fund) taking into account the state mandated PSERS contribution rate.[298][299]
The School District Adjusted Index for the Mifflinburg Area School District 2006-2007 through 2011-2012.[300]
For the 2016-17 budget year, Mifflinburg Area School Board did not apply for an exception to exceed the District's Act 1 Index limit.[309] Statewide 299 school districts adopted a resolution to not exceed their Act I index in 2016-17.
For the 2015-16 budget year, MIfflinburg Area School Board applied for two exceptions to exceed their Act 1 Index limit: for increasing special education costs and for its rapidly rising teacher pension costs. For the school budget 2015-16, 310 Pennsylvania public school districts adopted a resolution certifying that tax rates would not be increased above its Act 1 Index limit. Another 187 school districts adopted a preliminary budget leaving open the option of exceeding the Index limit. Regarding the pension costs exception, 172 school districts received approval to exceed the Index limit in full, while others received a partial approval of their request. For special education costs, 119 districts received approval to exceed their tax limit. No Pennsylvania public school districts received an approval for the grandfathered construction debts exception.[310]
For the 2014-15 budget year, Mifflinburg Area School Board did not apply for exceptions to exceed their Act 1 Index limit. For the school budget 2014-15, 316 Pennsylvania public school districts adopted a resolution certifying that tax rates would not be increased above its Act 1 Index limit. Another 181 school districts adopted a preliminary budget leaving open the option of exceeding the Index limit. Districts may apply for multiple exceptions each year. For the pension costs exception, 163 school districts received approval to exceed the Index in full, while others received a partial approval of their request. For special education costs, 104 districts received approval to exceed their tax limit. Seven Pennsylvania public school districts received an approval for the grandfathered construction debts exception.[311]
For the 2013-14 budget year, Mifflinburg Area School Board did not apply for an exception to exceed their Act 1 Index limit. For the school budget year 2013-14, 311 Pennsylvania public school districts adopted a resolution certifying that tax rates would not be increased above their index. Another 171 school districts adopted a preliminary budget leaving open the option of exceeded the Index limit. For the exception for pension costs, 89 school districts received approval to exceed the Index in full while others received a partial approval of their request. For special education costs, 75 districts received approval to exceed their tax limit. For the pension costs exception, 169 school districts received approval to exceed the Index. Eleven Pennsylvania public school districts received an approval for grandfathered construction debts.[312]
For the 2012-13 budget year, Mifflinburg Area School Board did not apply for any exceptions to exceed the Act 1 Index. For 2012-2013, 274 school districts adopted a resolution certifying that tax rates would not be increased above their index; 223 school districts adopted a preliminary budget leaving open the option of exceeded the Index limit. For the exception for pension costs, 194 school districts received approval to exceed the Index. For special education costs, 129 districts received approval to exceed the tax limit.[313]
For the 2011-12 school year, the Mifflinburg Area School Board did not apply for exceptions to exceed the Act 1 Index. Each year the Mifflinburg Area School Board has the option of adopting either 1) a resolution in January certifying they will not increase taxes above their index or 2) a preliminary budget in February. A school district adopting the resolution may not apply for referendum exceptions or ask voters for a tax increase above the inflation index. A specific timeline for these decisions is publisher each year by the Pennsylvania Department of Education.[314]
According to a state report, for the 2011-2012 school year budgets, 247 school districts adopted a resolution certifying that tax rates would not be increased above their index; 250 school districts adopted a preliminary budget. Of the 250 school districts that adopted a preliminary budget, 231 adopted real estate tax rates that exceeded their index. Tax rate increases in the other 19 school districts that adopted a preliminary budget did not exceed the school district’s index. Of the districts who sought exceptions 221 used the pension costs exemption and 171 sought a Special Education costs exemption. Only 1 school district sought an exemption for Nonacademic School Construction Project, while 1 sought an exception for Electoral debt for school construction.[315] With the 2011 state education budget, the General Assembly repealed most of the Act 1 tax increase exceptions leaving only special education costs, pension costs and prior voter approved (ballot referendum) debt for construction. The cost of construction projects in the future will go to the voters for approval via ballot referendum. Districts can no longer raise property taxes to cover increasing health insurance costs for employees.[316]
Mifflinburg Area School Board did not apply for exceptions to exceed the Act 1 index for the budgets in 2009-10 nor in 2010-11.[317][318] In the spring of 2010, 135 Pennsylvania school boards asked to exceed their adjusted index. Approval was granted to 133 of them and 128 sought an exception for pension costs increases.[319]
Closed Schools
Laurelton Elementary School
In 2010, Laurelton Elementary School had 55 students. In the spring of 2011, the school board voted to close the school effective the end of the 2010-11 school year. It noted that costly renovations were needed and that enrollment had been chronically low and was expected to remain so.[320] Students from the school's community will attend Mifflinburg Elementary School beginning in the autumn of 2011.
The school was recognized as a Blue Ribbon School by the US Department of Education in 2009 due to strong student academic achievement.[321]
3rd Graders Math low income pupils on grade level |
3rd Graders Reading low income pupils on grade level |
New Berlin Elementary School
In 2010, New Berlin Elementary School had 79 students. In the spring of 2011, Mifflinburg Area School Board announced the intent to close the school at the end of the 2011-12 school year. Community members worked to alter the plan.[328] In September 2011, the Board voted to close the school at the end of the 2011-12 school year. Local opponents to the closing stated they would seek to establish a charter school in the community. The school building and property was returned to the control of the New Berlin Borough in the spring of 2013.
2011 and 2012 - less than 10 students data not publicly reported. 2010: 87.5%, Advanced - 50% | Proficient – 37.5%, State - 74.7% |
2010: 75%, Advanced - 12.5% | Proficient – 62.5%, State – 61.2% |
Buffalo Crossroads Elementary School
In 2010, Buffalo Crossroads Elementary School had 66 students in grades K-3rd. In August 2011, the Mifflinburg Area School Board voted to close the school building, at the end of the 2011-12 school year, due to its very low enrollment.[335] In August 2012, the School board sold the building to the Buffalo Valley United Methodist Charge for $250,000. The Superintendent reported that the unsolicited offer was accepted, avoiding paying commissions and fees on the sale.[336]
2010: 100%, Advanced - 50% | Proficient – 50%, State - 74.7% |
2011 and 2012 - fewer than 10 students data not publicly reported 2010: 100%, Advanced - 0% | Proficient – 100%, State – 61.2% |
Extracurriculars
Mifflinburg Area School District offers a wide variety of clubs, activities and an extensive, costly sports program.[338][339] Eligibility for participation is determined by school board policy and in compliance with standards set by the Pennsylvania Interscholastic Athletic Association (PIAA). Students may be failing up to two courses and remain eligible to participate in sports and other extracurriculars.[340]
The Mifflinburg Area School District is a member of the Pennsylvania Heartland Athletic Conference for all athletics and participates under the rules and guidelines of the Pennsylvania Interscholastic Athletic Association. The Pennsylvania Heartland Athletic Conference is a voluntary association of 25 PIAA High Schools within the central Pennsylvania region.
Mifflinburg ASD offers: FFA, Interact Club (Rotary related), Key Club (Kiwanis related), National Honor Society Laurel Chapter, Outdoors Club, Ski Club, Technology Student Association (TSA), and Student Government.
Mifflinburg School District is known for its music program, which hosts a concert and chamber choir, marching and concert bands, as well as a jazz band and pep band. The school's drama department is a local favorite for their fall production (usually a play) and their spring production (usually a musical). The District charges students $30 a year to be in band.[341]
By Pennsylvania law, all K-12 students in the district, including those who attend a private nonpublic school, cyber charter school, charter school and those homeschooled, are eligible to participate in the extracurricular programs, including all athletics. They must meet the same eligibility rules as the students enrolled in the district's schools.[342]
Sports
According to Pennsylvania’s Safety in Youth Sports Act, all sports coaches, paid and volunteer, are required to annually complete the Concussion Management Certification Training and present the certification before coaching.[343][344] The District charges a $30 activity fee to athletes.[345] Students who qualify for a free or reduced price lunch are exempted from the fee.[346]
The District funds:
|
|
- Middle School Sports
|
|
According to PIAA directory July 2016 [347]
References
- ↑ Thompson, Erin. Mifflinburg promotes coordinator to superintendent, The Daily Item, April 14, 2010
- ↑ Evamarie Scoha, Board unanimous on budget, repairs, The Daily Item, April 15, 2015
- ↑ National Center For Education Statistics, Common Core of Data - Mifflinburg Area School District, 2013
- ↑ Pennsylvania Department of Education (October 14, 2016). "Mifflinburg Area School District Fast Facts 2016".
- ↑ Pennsylvania Department of Education (November 4, 2015). "Mifflinburg Area School District Fast Facts 2015".
- ↑ Pennsylvania Department of Education (November 6, 2014). "Mifflinburg Area School District Fast Facts 2014".
- ↑ Pennsylvania Department of Education (October 4, 2013). "Mifflinburg Area School District Fast Facts 2013".
- ↑ National Center for Education Statistics, Common Core of Data- Mifflinburg Area School District, 2013
- ↑ Pennsylvania Department of Education, Enrollment and Projections by LEA, July 2010
- ↑ Pennsylvania Department of Education, Enrollment 2006 through 2020 Projections, July 2011
- ↑ Rick Dandes, For Some, Tears Flow, The Daily Item, August 18, 2014
- ↑ Pennsylvania Department of Education Enrollment by LEA and School 2012, 2013
- ↑ Pennsylvania Department of Education (July 2010). "Pennsylvania Department of Education Enrollment and Projections by LEA".
- ↑ Evamarie Socha, No Tax increase in proposed budget for Miff, The Daily Item, May 6, 2015
- ↑ Evamarie Socha (June 10, 2014). "Mifflinburg school taxes to increase 2.8 percent".
- ↑ Evamarie Socha, Board OKs $27.6 m Budget, The Daily Item, May 7, 2012
- ↑ Mifflinburg Area School District Business Manager (2013). "Mifflinburg Area School District Budget Report to PDE" (PDF).
- ↑ Socha, Evamarie., Daily Item, Mifflinburg Leaders get 2% raise, June 13, 2012
- ↑ Mifflinburg Area School District Business Manager (June 2011). "Mifflinburg Area School District Budget Report to PDE".
- ↑ US Census Bureau, 2010 Census Poverty Data by Local Educational Agency, 2011
- ↑ proximityone (2014). "School District Comparative Analysis Profiles".
- ↑ Pennsylvania Budget and Policy Center, Education Facts Student Poverty Concentration by LEA, 2012
- ↑ American Fact Finder, US Census Bureau, 2010
- ↑ US Census Bureau (2010). "American Fact Finder, State and County quick facts".
- ↑ US Census Bureau (September 2011). "Income, Poverty, and Health Insurance Coverage in the United States: 2010" (PDF).
- ↑ US Census Bureau (2014). "Pennsylvania Median household income, 2006-2010 by County".
- ↑ Michael Sauter & Alexander E.M. Hess, (August 31, 2013). "America's most popular six-figure jobs". USA Today.
- ↑ Jeff Guo (September 15, 2015). "Lower wages for whites, higher wages for immigrants, and inequality for all". Washington Post.
- ↑ Office of the Pennsylvania Auditor General, Mifflinburg Area School District Audit Report, October 2011
- ↑ PA Auditor General Office, Mifflinburg Area School District Performance Audit 2013, December 30, 2013
- ↑ Pennsylvania Public School Code Governance 2010
- ↑ US Department of Education (2015). "Every Student Succeeds Act".
- ↑ Pennsylvania General Assembly (2012). "Act of Jul. 12, 2012, P.L. 1142, No. 141 Section 921-A".
- ↑ MASD administration, Mifflinburg Area School District Business Office web site, 2016
- ↑ Pennsylvania General Assembly (2012). "Act of Jul. 12, 2012, P.L. 1142, No. 141".
- ↑ Ballotpedia. "The Pennsylvania Project". Retrieved July 26, 2013.
- ↑ MASD Administration, Mifflinburg Area School District web site, 2016
- ↑ Pittsburgh Business Times (April 12, 2016). "Chester County district leads statewide Honor Roll 2016".
- ↑ Pittsburgh Business Times (April 11, 2014). "What makes up a district's School Performance Profile score?".
- ↑ Pittsburgh Business Times (April 10, 2015). "Guide to Pennsylvania Schools Statewide School District Ranking 2015".
- ↑ Pittsburgh Business Times, Statewide Honor Roll Rankings 2014, April 11, 2014
- ↑ Pittsburgh Business Times, Statewide Honor Roll Rankings 2013, April 5, 2013
- ↑ Pittsburgh Business Times, Statewide Honor Roll Rankings 2012, April 6, 2012
- ↑ Pittsburgh Business Times, Statewide Honor Roll Rankings 2011, April 5, 2011
- ↑ Pittsburgh Business Times, Statewide Honor Roll Rankings 2010, April 30, 2010
- ↑ Pittsburgh Business Times, Pennsylvania School District Rankings, July 3, 2008.
- ↑ "USC Ranked Best School District In Pa.; Complete List Inside". Pittsburgh Business Times. 2007.
- ↑ Pittsburgh Business Times, Statewide Overachivers Ranking Information, April 4, 2013
- ↑ "Overachiever statewide ranking". Pittsburgh Business Times. May 6, 2010.
- ↑ The Morning Call, 2009 PSSA RESULTS Mifflinburg Area School District, 2009
- ↑ Pennsylvania Department of Education (September 21, 2012). "Mifflinburg Area School District AYP Overview 2012".
- ↑ Pennsylvania Department of Education, Pennsylvania Public School District AYP History, 2011
- ↑ Pennsylvania Department of Education, Pennsylvania District AYP History 2003-2010, 2011
- ↑ Pennsylvania Department of Education (2016). "School Performance Report - Mifflinburg Area Senior High School".
- ↑ Pennsylvania Department of Education (2014). "School Performance Report - Mifflinburg Area Senior High School".
- ↑ Pennsylvania Department of Education, School Performance Report - Mifflinburg Area Senior High School, 2013
- ↑ Pennsylvania Department of Education (September 21, 2012). "Mifflinburg Area School District AYP Data Table 2012".
- ↑ Pennsylvania Department of Education, Mifflinburg Area High School - School Data Table 2011, September 29, 2011
- ↑ Pennsylvania Department of Education (March 15, 2011). "New 4-year Cohort Graduation Rate Calculation Now Being Implemented".
- ↑ Pennsylvania Department of Education (September 2010). "Mifflinburg Area School District Academic Achievement Report Card 2010".
- ↑ Pennsylvania Department of Education (August 2009). "Mifflinburg Area School District Academic Achievement Report Card 2009".
- ↑ Pennsylvania Department of Education, Mifflinburg Area School District Academic Achievement Report Card 2007, 2007
- ↑ Pennsylvania Department of Education, Mifflinburg Senior High School Report Card 2006, 2006
- ↑ Pennsylvania Department of Education, Mifflinburg Area School District Academic Achievement Report Card 2005, August 2005
- ↑ Pennsylvania Dual Enrollment Grants 2009-10
- ↑ Pennsylvania Department of Education (October 4, 2013). "Mifflinburg Area Senior High School Fast Facts 2013".
- ↑ US News and World Report, Best High Schools, 2014
- ↑ National Center for Education Statistics, Common Core of Data - Mifflinburg Area High School, 2010
- ↑ Pennsylvania Department of Education, Professional Qualifications of Teachers, 2011
- ↑ Pennsylvania Department of Education (September 29, 2016). "2016 PSSA AND KEYSTONE Results".
- ↑ Pennsylvania Department of Education (August 2016). "Findings and Recommendations Pursuant to Act 1 of 2016" (PDF).
- ↑ Jan Murphy (October 16, 2016). "How District schools fared overall".
- ↑ Pennsylvania Departemtn of Education (November 4, 2015). "High School School Performance Profile 2015".
- ↑ Jan Murphy (November 4, 2015). "Report card for state's high schools show overall decline". Pennlive.com.
- ↑ Pennsylvania Department of Education (November 4, 2015). "2015 Keystone Exam School Level Data".
- ↑ Pennsylvania Department of Education (November 6, 2014). "Mifflinburg Area High School Academic Performance Data 2014".
- ↑ Acting Secretary of Education Carolyn Dumaresq, Acting Secretary of Education Announces Results of 2013-14 School Performance Profile; Strong Performance in 72 Percent of Schools, November 6, 2014
- ↑ Kathy Boccella; Dylan Purcell & Kristen A. Graham (November 6, 2014). "Pa. school rankings: Downingtown STEM No. 1; Phila. falters". Philadelphia Inquirer.
- ↑ Pennsylvania Department of Education (October 4, 2013). "Mifflinburg Area High School Academic Performance Data 2013".
- ↑ Pennsylvania Department of Education, Mifflinburg Area High School AYP Overview 2012, September 21, 2012
- ↑ "Mifflinburg Area High School". Pennsylvania Department of Education. 2011.
- ↑ Pennsylvania Department of Education (2014). "State Academic Standards".
- ↑ Pennsylvania Department of Education Date=September 21, 2012. "Mifflinburg Area High School Academic Achievement Report Card 2012" (PDF).
- ↑ Pennsylvania Department of Education (2010). "Pennsylvania PSSA results 2009-10".
- ↑ "Central Pennsylvania High Schools Math Ranking 2009". 2010.
- ↑ Pennsylvania Department of Education (September 2009). "Pennsylvania PSSA results for Reading, Math, Science and writing in 2009".
- ↑ Pennsylvania Department of Education (August 2008). "Pennsylvania PSSA results for Reading, Math, Science and writing in 2008".
- ↑ Pennsylvania Department of Education, Mifflinburg Senior High School Report District 2006, 2006
- ↑ Pennsylvania Department of Education (September 29, 2011). "2010-2011 Science PSSA and AYP Results".
- ↑ "Central Pennsylvania Public High School Science Ranking 2010".
- ↑ Pennsylvania Department of Education, Central Pennsylvania Public High School Science Ranking 2009
- ↑ Pennsylvania Department of Education (September 29, 2011). "2010-2011 PSSA and AYP Results".
- ↑ "11th Grade Reading 2010 Central Pennsylvania Ranking". 2010.
- ↑ "11th Grade Reading PSSA 2008 & 2009 Central Susquehanna Valley IU16 Region ranking". 2009.
- ↑ "11th Grade Reading PSSA 2008 Central Susquehanna Valley IU16 Region ranking". 2008.
- ↑ "11th Grade Reading PSSA Central Pennsylvania".
- ↑ Pennsylvania Department of Education (2006). "Mifflinburg Area Senior High School Report Card 2006".
- ↑ The Pennsylvania Basic Education/Higher Education Science and Technology Partnership, Science in Motion annual report, 2012
- ↑ Pennsylvania Department of Education (January 2009). "Pennsylvania College Remediation Report 2009".
- ↑ Pennsylvania Department of Education (January 2009). "Thousands of Pennsylvania high school graduates head to college unprepared.".
- ↑ PDE, School Performance profile, November 6, 2014
- ↑ College Board (2014). "2014 College-Bound Seniors State Profile Report" (PDF).
- ↑ College Board (2013). "The 2013 SAT Report on College & Career Readiness".
- ↑ Pennsylvania Department of Education (2011). "Public School SAT Scores 2011".
- ↑ College Board (September 2011). "SAT Scores State By State - Pennsylvania".
- ↑ "While U.S. SAT scores dip across the board, N.J. test-takers hold steady". NJ.com. September 2011.
- ↑ College Board (2014). "Exam Fees and Reductions: 2015".
- ↑ PDE, School Performance Profile - Academic Performance Data - Mifflinburg Area High School, November 2014
- ↑ Pennsylvania Department of Education (November 6, 2014). "Mifflinburg Area Middle School Fast Facts 2014".
- ↑ Pennsylvania Department of Education, Professional Qualifications of Teachers Mifflinburg Area Middle School, October 4, 2013
- ↑ National Center for Education Statistics, Common Core of Data - Mifflinburg Area Middle School, 2010
- ↑ Pennsylvania Department of Education, Professional Qualifications of Teachers Mifflinburg Area Middle School, 2011
- ↑ Pennsylvania Department of Education (September 29, 2016). "2016 PSSA AND KEYSTONE Results".
- ↑ Pennsylvania Department of Education (October 1, 2015). "2015 PSSA School Level Data".
- ↑ Pennsylvania Department of Education (October 1, 2015). "2015 PSSA State Level Data".
- ↑ Pennsylvania Department of Education (November 6, 2014). "Mifflinburg Area High School Academic Performance Data 2014".
- ↑ Pennsylvania Department of Education (October 4, 2013). "Mifflinburg Area Middle School Academic Performance Data 2013".
- ↑ Pennsylvania Department of Education, Mifflinburg Area Middle School AYP Overview, 2012
- ↑ Pennsylvania Department of Education (September 21, 2012). "Mifflinburg Area Middle School Academic Achievement Report Card 2012" (PDF).
- ↑ Pennsylvania Department of Education, Mifflinburg Area Middle School Academic Achievement Report Card 2011, September 29, 2011
- ↑ Pennsylvania Department of Education Report (September 14, 2010). "2010 PSSAs: Reading, Math, Writing Results".
- ↑ Pennsylvania Department of Education (2009). "2009 PSSAs: Reading, Math, Writing and Science Results".
- ↑ Pennsylvania Department of Education Report (August 2010). "Science PSSA 2010 by Schools".
- ↑ PDE (November 6, 2014). "Mifflinburg Area Intermediate School Profile 2014".
- ↑ Pennsylvania Department of Education, Professional Qualifications of Teachers Mifflinburg Area Intermediate School, October 4, 2013
- ↑ National Center for Education Statistics, Common Core Data – Elementary School, 2011
- ↑ Pennsylvania Department of Education (March 2011). "Mifflinburg Area Intermediate School AYP Data Table".
- ↑ Pennsylvania Department of Education, 2016 PSSA AND KEYSTONE Results, September 29, 2016
- ↑ Jan Murphy (September 29, 2016). "Standardized test scores show Pa. schools have more work to do". Pennlive.com.
- ↑ Pennsylvania Department of Education (October 1, 2015). "2015 PSSA School Level Data".
- ↑ Pennsylvania Department of Education (October 1, 2015). "2015 PSSA State Level Data".
- ↑ Pennsylvania Department of Education (November 6, 2014). "Mifflinburg Intermediate School Academic Performance Data 2014".
- ↑ Pennsylvania Department of Education (October 4, 2013). "Mifflinburg Area Intermediate School Academic Performance Data 2013,".
- ↑ Pennsylvania Department of Education (March 2011). "Mifflinburg Area Intermediate School AYP Overview".
- ↑ Pennsylvania Department of Education (March 2011). "MIFFLINBURG AREA INTRMD SCHOOL Academic report card 2012".
- ↑ Pennsylvania Department of Education (March 2011). "Mifflinburg Area Intermediate School Academic Achievement Report Card 2010".
- ↑ Pennsylvania Department of Education (February 2009). "Mifflinburg Area Intermediate School Academic Achievement Report Card 2009".
- ↑ Pennsylvania Department of Education, Mifflinburg Area Intermediate School Academic Achievement Report Card 2008, August 15, 2008
- ↑ Pennsylvania Department of Education, Mifflinburg Area Intermediate School Academic Achievement Report Card 2007, 2007
- ↑ "4th grade reading 2011 CSIU16 region rank". September 2011.
- ↑ "5th Grade Math PSSA 2009 Central Susquehanna Valley IU16 Region ranking". 2009.
- ↑ "5th Grade Reading 2011 CSIU16 region". September 2011.
- 1 2 Pennsylvania Department of Education, Professional Qualifications of Teachers Mifflinburg Elementary School, 2013
- ↑ Pennsylvania Department of Education (November 6, 2014). "Mifflinburg Elementary School Fast Facts".
- ↑ PDE, Full Day Kindergarten by LEA, 2009
- ↑ Pennsylvania Department of Education (October 4, 2013). "Mifflinburg Elementary School Fast Facts".
- ↑ SUM Child Development, Inc. (2014). "PA PRE-K COUNTS APPLICATION 2014-2015" (PDF).
- ↑ National Center for Education Statistics, Common Core of Data - Mifflinburg Elementary School, 2010
- ↑ Pennsylvania Department of Education, Professional Qualifications of Teachers Mifflinburg Elementary School, 2011
- ↑ Pennsylvania Department of Education (October 14, 2016). "Mifflinburg Elementary School Academic Performance Data 2016".
- ↑ Pennsylvania Department of Education (November 6, 2014). "Mifflinburg Elementary School Academic Performance Data 2013".
- ↑ Pennsylvania Department of Education (October 4, 2013). "Mifflinburg Elementary School Academic Performance Data 2013".
- ↑ Pennsylvania Department of Education, Mifflinburg Elementary School AYP Overview, 2011
- ↑ Pennsylvania Department of Education (March 2011). "Mifflinburg Elementary School AYP Data Table".
- ↑ Pennsylvania Department of Education (September 29, 2011). "Mifflinburg Elementary School Academic Achievement Report Card 2011" (PDF).
- ↑ Pennsylvania Department of Education, Mifflinburg Elementary School Academic Achievement Report Card 2010, October 20, 2010
- ↑ Pennsylvania Department of Education (March 2009). "Mifflinburg Elementary School Academic Achievement Report Card 2009".
- ↑ Pennsylvania Department of Education, Mifflinburg Elementary School Academic Achievement Report Card 2009, August 15, 2008
- ↑ Pennsylvania Department of Education, Mifflinburg Elementary School Academic Achievement Report Card 2009, September 14, 2009
- ↑ Pennsylvania Bureau of Special Education Services (2015). "Mifflinburg Area School District Special Education Data Report LEA Performance on State Performance Plan (SPP) Targets".
- ↑ Bureau of Special Education Pennsylvania (2009). "Mifflinburg Area SD Special Education Data Report LEA Performance on State Performance Plan (SPP) Targets School Year 2008-2009" (PDF).
- ↑ Pennsylvania Department of Education, Testimony Hearing on Special Education Senate Republican Policy Committee, January 2013
- ↑ Gerald L. Zahorchak, D. Ed. (May 30, 2007). "House Education Committee Hearing on Governor's Proposed Increase for Accountability Block Grants Testimony for Gerald L. Zahorchak, D. Ed. Secretary, Pennsylvania Department of Education" (PDF).
- ↑ Mifflinburg Area School Board, Mifflinburg Area School District General Fund budget 2014-15, 2014
- ↑ 2010-2011 Annual Notice of Special Education Services and Programs for Central Susquehanna Intermediate Unit, Local School Districts and other local agencies providing educational services
- ↑ Pennsylvania Department of Education. "Pennsylvania Special Education Funding".
- ↑ Senator Patrick Browne (November 1, 2011). "Senate Education Committee Holds Hearing on Special Education Funding & Accountability".
- ↑ Pennsylvania Department of Education Amy Morton, Executive Deputy Secretary, Public Hearing: Special Education Funding & Accountability Testimony, November 11, 2011
- ↑ Baruch Kintisch Education Law Center, Public Hearing: Special Education Funding & Accountability Testimony, November 11, 2011
- ↑ US Department of Education, U.S. Department of Education Clarifies Schools' Obligation to Provide Equal Opportunity to Students with Disabilities to Participate in Extracurricular Athletics, January 25, 2013
- ↑ Pennsylvania Department of Education, Special Education Funding from Pennsylvania State_2010-2011, July 2010
- ↑ Pennsylvania Department of Education, Special Education Funding 2011-2012 Fiscal Year |author=Pennsylvania Department of Education, 2011
- ↑ Pennsylvania Department of Education (April 2012). "Investing in PA kids,".
- ↑ PDE (July 2014). "Investing in Pennsylvania Students".
- ↑ Pennsylvania Department of Education, BEF, Special Education Funding, RTL Grants 2016-17, July 2016
- ↑ Pennsylvania Department of Education (July 2010). "Gifted Students as Percentage of Total Enrollment by School District/Charter School" (PDF).
- ↑ Pennsylvania Department of Education and Pennsylvania School Board. "CHAPTER 16. Special Education For Gifted Students". Retrieved February 4, 2011.
- ↑ Pennsylvania General Assembly, Taxpayer Relief Act, Act 1 of the Special Session of 2006, June 27, 2006
- ↑ The Daily Item (June 10, 2015). "Mifflinburg reaches contract agreement".
- ↑ Pennsylvania Department of Education (2014). "Investing in Pennsylvania Students".
- ↑ Marcia Moore (June 28, 2014). "Teachers' pay soars above inflation rates". The Daily Item.
- ↑ Pennsylvania Department of Education, Investing in Pennsylvania Students, May 2012
- ↑ Socha, Evanmarie, Tentative teachers contract approved, The Daily Item, March 21, 2012
- ↑ "Mifflinburg Area School District Payroll report 2011". OpenPA Gov.org. 2013.
- ↑ OpenPAGov.org (2009). "Mifflinburg Area School District Payroll Report".
- ↑ Mifflinburg Area School Board (2010). "Mifflinburg Area School District Teacher Union Employment Contract 2010".
- ↑ Mifflinburg Area School Board, Mifflinburg Teachers Union Contract, 2010
- ↑ Fenton, Jacob, (March 2010). "Average classroom teacher salaries in Union County, 2006-07". The Morning Call.
- ↑ Mifflinburg Area School District Administration, Mifflinburg Area School District and Teacher Union Contract, 2010
- ↑ "Per Pupil Spending in Pennsylvania Public Schools in 2008 Sort Spending".
- ↑ Pennsylvania Department of Education (2010). "2009-10 Selected Data - 2009-10 Total Expenditures per ADM".
- ↑ US Census Bureau (March 2003). "Public Education Finances 2000-01 Annual Survey of Local Government Finances" (PDF).
- ↑ US Census Bureau (2009). "Total and current expenditures per pupil in fall enrollment in public elementary and secondary education, by function and state or jurisdiction: 2006-07".
- ↑ United States Census Bureau (2009). "States Ranked According to Per Pupil Elementary-Secondary Public School System Finance Amounts: 2008-09" (PDF).
- ↑ US Census Bureau (May 2013). "States Ranked According to Per Pupil Public Elementary-Secondary School System Finance Amounts: Fiscal Year 2011" (PDF).
- ↑ Fenton, Jacob., Pennsylvania School District Data: Will School Consolidation Save Money?, The Morning Call, February 2009
- ↑ Pennsylvania Department of Education. "Fund Balances by Local Education Agency 1997 to 2008".
- ↑ Murphy, Jan., Pennsylvania's public schools boost reserves, CentreDaily Times, September 22, 2010
- ↑ Evamarie Socha (March 2, 2011). "Laurelton too costly, super says". The Daily Item.
- ↑ Evamarie Socha (April 13, 2011). "More schools might close". The Daily Item.
- 1 2 Evamarie Socha (May 5, 2011). "Closing 3 schools may save $570G". The Daily Item.
- ↑ Pennsylvania Auditor General (January 2010). "Mifflinburg Area SCHOOL DISTRICT UNION COUNTY, PENNSYLVANIA PERFORMANCE AUDIT REPORT".
- ↑ Pennsylvania Department of Education (May 2012). "Pennsylvania Public School District Tuition Rates".
- ↑ Pennsylvania of Community & Economic Development (2012). "Earned Income Tax".
- ↑ Penn State Cooperative Extension (2010). "What are the Local Taxes in Pennsylvania?, Local Tax Reform Education Project" (PDF).
- ↑ Pennsylvania Department of Revenue (April 2010). "Personal Income Taxation Guidelines".
- ↑ John Finnerty (2013). "PA teachers pensions". CNHI Harrisburg Bureau.
- ↑ Pennsylvania Representative Todd Stephens (January 23, 2014). "LEEF Funding Chart 2014".
- ↑ Pennsylvania Department of Eductaion, Education Budget 2016-17, July 2016
- ↑ PDE, Special Education Funding fiscal year 2016-17, July 2017
- ↑ PA Office of Budget, Commonwealth 2016-17 Enacted Budget Line-Item Appropriations, July 2016
- ↑ Jan Murphey (January 4, 2016). "Here's the payout your school district gets from the partial 2015-16 state budget". Pennlive.com.
- ↑ Jennifer Wakeman (January 4, 2016). "Harrisburg releases $3.3 billion in delayed funds".
- ↑ Pennsylvania General Assembly (June 26, 2015). "Basic Education Funding Commission".
- ↑ Pennsylvania Department of Education (January 2016). "Summary of State Appropriations for Education 2015-2016 Fiscal Year Education Budget".
- ↑ Jan Murphy (April 6, 2016). "Governor's 2015-16 Basic Eductaion Funding & Reday to Learn Block Grant Distributions Compared to HB1801 Districtbutions". Pennlive.com.
- ↑ Pennsylvania Department of Education, EdBudget 2015-16 BEF, April 6, 2016
- ↑ PDE (July 7, 2014). "Enacted Education Budget 2014-2015".
- ↑ Pennsylvania Department of Education, 2014-15 Enacted Education Budget Fast Facts, July 14, 2014
- ↑ Democrat Appropriations Committee, Report on Education funding by LEA, July 2, 2013
- ↑ Pennsylvania Office of the Budget, 2013-14 State Budget Highlights, 2013
- ↑ Senator Jake Corman (June 28, 2012). "Pennsylvania Education funding by Local School District" (PDF).
- ↑ Pennsylvania General Assembly Sen Jake Corman (June 29, 2012). "SB1466 of 2012 General Fund Appropriation".
- ↑ PA Senate Appropriations Committee (June 28, 2011). "School District 2011-12 funding Report".
- ↑ Pennsylvania Senate Appropriations Committee (2011). "Senate Budget Hearings 2011-2012 School District funding for 2011-2012".
- ↑ Pennsylvania Department of Education (June 30, 2011). "Basic Education Funding 2011-2012 Fiscal Year".
- ↑ Pennsylvania House Appropriations Committee Education Budget information (June 30, 2010). "PA Basic Education Funding-Printout2 2010-2011".
- ↑ Pennsylvania House Appropriations Committee (June 30, 2010). "PA Basic Education Funding-Printout2 2010-2011" (PDF).
- ↑ Office of the Budget (February 2010). "Pennsylvania Budget Proposal 2010".
- ↑ Pennsylvania Department of Education (October 2009). "Report on Funding by school district".
- ↑ Pennsylvania Office of Budget (February 2009). "Governor's Budget Proposal 2009 Pennsylvania Department of Education Budget Proposal 2009".
- ↑ Pennsylvania Department of Education (October 2009). "Funding Report by Local Education Agency,".
- ↑ Pennsylvania Department of Education - Accountability Block Grant report 2010, Grantee list 2010
- ↑ Accountability Block Grant Mid Year report
- ↑ Pennsylvania Department of Education (2013). "Passport for Learning Block Grant".
- ↑ Pennsylvania Department of Education. "Educational Assistance Program Funding 2010-2011 Fiscal Year".
- ↑ Pennsylvania Auditor General (December 22, 2008). "Classrooms For the Future grants audit" (PDF).
- ↑ Department of Environmental Protection (2014). "Environmental Education Grants".
- ↑ Pennsylvania Department of Environmental Protection (April 22, 2013). "Governor Corbett Awards 92 Grants for Environmental Education and Stewardship".
- ↑ Pennsylvania Department of Education, Science: It’s Elementary Grantees Students in 143 Schools Benefit from Intensive Science Curriculum, July 22, 2008
- ↑ Pennsylvania Department of Education (May 23, 2012). "Pennsylvania Awards $36.1 Million to Strengthen Literacy Programs".
- ↑ Pennsylvania Department of Education Press Office (October 17, 2013). "Acting Secretary of Education Says Hybrid Learning Benefits Students; Highlights Success of First-Year Pilot Program".
- ↑ PSEA (2006). "Project 720 PDE Education Improvement Initiative Series" (PDF).
- ↑ Commonwealth of Pennsylvania. "Federal Stimulus funding for Mifflinburg Area School District".
- ↑ ProPublica (2009). "Recovery Tracker Eye on the stimulus".
- ↑ "School stimulus money". Pittsburgh Post-Gazette. March 12, 2009.
- ↑ Governor's Press Office release (January 20, 2010). "Pennsylvania's 'Race to the Top' Fueled by Effective Reforms, Strong Local Support,".
- ↑ Race to the Top Fund, U.S. Department of Education, March 29, 2010.
- ↑ Gerald Zahorchak (December 2008). "Pennsylvania Race to the Top Letter to Superintendents" (PDF).
- ↑ Pennsylvania Department of Education (January 19, 2009). "Pennsylvania Race to the Top -School Districts Title I Allocations 2009-10".
- ↑ PDE (2015). "TITLE II, PART A - TEACHER AND PRINCIAL TRAINING & RECRUITING".
- ↑ PDE (2015). "Federal Programs".
- ↑ PDE, Title IIA egrants 2012-13, 2012
- ↑ PDE, Title IIA egrants 2014-15, 2014
- ↑ US Department of Education (September 15, 2004). "Title III — Language Instruction for Limited English Proficient and Immigrant Students".
- ↑ PDE, English As A Second Language (ESL), 2015
- ↑ PDE (2015). "Title III Supplemental Program".
- ↑ PDE, Title III Grant Allocations 2014-15, 2014
- ↑ Socha, Evamarie, 5 teachers to lose jobs in Mifflinburg, The Daily Item, May 24, 2011
- ↑ Pennsylvania Department of Education, Mifflinburg ASD Enrollment and Enrollment Projections to 2019, July 2010
- ↑ Fenton, Jacob., Pennsylvania School District Data: Will School Consolidation Save Money?, The Morning Call, Feb 2009
- ↑ Standard and Poor's School Evaluation Services, (2007). "Study of the cost-effectiveness of consolidating Pennsylvania School Districts,".
- ↑ Fenton, Jacob, Administrative Costs for Union County School Districts 2007-08, The Morning Call, July 2009
- ↑ Edward Rendell; Governor and Mary Soderberg; Secretary of the Budget. (February 2009). "2009-10 Executive Budget Facts Pennsylvania School District Consolidation,".
- ↑ Pennsylvania Department of Education (2009). "Mifflinburg Area School District enrollment data and projections".
- ↑ The Center for Rural Pennsylvania. (October 2009). "Research Analyzes Rural School District Enrollment and Building Capacity" (PDF).
- ↑ Pennsylvania Department of Health, Birth Age County Reports 1990 and 2011, 2011
- ↑ Governor Office Press release (March 12, 2008). "PA Education Department Announces 39 Districts to Take Part in 'Common Cents' Cost-Saving".
- ↑ "Mifflinburg budget includes tax increase". The Standard Journal. June 10, 2015.
- ↑ Pennsylvania Department of Education (2015). "Real Estate Tax Millage by School District 2015-2016".
- ↑ Evamarie Socha (June 15, 2011). "Mifflinburg shuts down Laurelton". The Daily Item.
- ↑ Katie Colaneri (June 11, 2015). "New pipeline could mean tax bonanza for NJ towns, but for Pa.? Not so much". State Impact NPR.org.
- ↑ Pennsylvania Department of Education (2004). "Act 511 Tax Report".
- ↑ State Tax Equalization Board (2011). "State Tax Equalization Board About US".
- ↑ Pennsylvania Auditor General office - Bureau of Audits (February 2011). "A Special Performance Audit of the Pennsylvania State Tax Equalization Boards" (PDF).
- ↑ Pennsylvania Department of Education (2013). "Real Estate Tax Millage by School District 2014-2015,".
- ↑ Pennsylvania Department of Education (2013). "Real Estate Tax Millage by School District 2013-2014,".
- ↑ Evamarie Socha (June 10, 2014). "Mifflinburg school taxes to increase 2.8 percent". The Daily Item.
- ↑ Socha, Evamarie., Mifflinburg school board OKs millage increase, The Daily Item, May 22, 2012
- ↑ Pennsylvania Department of Education, Real Estate Tax Millage by School District 2011-12, 2011
- ↑ Pennsylvania Department of Education, Real Estate Tax Millage by School District 2010-11. 2010
- ↑ Pennsylvania Department of Education, Real Estate Tax Millage by School District 2009-10, 2009
- ↑ Pennsylvania Department of Education, Pennsylvania School District Real Estate Tax Rates 2008-09, 2008
- ↑ Pennsylvania Department of Education, Real Estate Tax Millage by School District 2007-08, October 2007
- ↑ Pennsylvania Department of Education, Real Estate Tax Millage by School District, 2006-07
- ↑ Union County Assessment Office (2014). "Assessment Office".
- ↑ Pennsylvania Department of Education, Real Estate Tax Millage by School District, 2005
- ↑ Tax-rates.org., The 2013 Tax Resource County Property Taxes 2012, 2012
- ↑ Pennsylvania Department of Education, Pennsylvania School Finances - Summaries of Annual Financial Report Data 2010-11, 2011
- ↑ New Census Data on Property Taxes on Homeowners, Tax Foundation, September 22, 2009.
- ↑ Pennsylvania Department of Education (May 1, 2015). "2015-2016 Estimated State Property Tax Relief per Homestead".
- ↑ Pennsylvania Department of Education, Tax Relief Per homestead/farmstead, 2013
- ↑ Pennsylvania Department of Education (May 1, 2010). "Property tax relief Report,".
- ↑ Tax Relief per Homestead 2009 & 2010, Pennsylvania Department of Education Report May 1, 2009 & 2010
- ↑ Property Tax/Rent Rebate Program
- ↑ Pennsylvania Department of Education (2010). "2010-11 Act 1 of 2006 Referendum Exception Guidelines".
- ↑ Kaitlynn Riely (August 4, 2011). "Law could restrict school construction projects". Pittsburgh Post-Gazette.
- ↑ Pennsylvania General Assembly (June 29, 2011). "SB330 of 2011".
- ↑ Eric Boehm (July 1, 2011). "Property tax reform final piece of state budget". PA Independent.
- ↑ Pennsylvania Department of Education (May 2010). "Special Session Act 1 of 2006 School District Adjusted Index for 2006-2007 through 2011-2012".
- ↑ Pennsylvania Department of Education (May 2011). "Special Session Act 1 of 2006 School District Adjusted Index for 2006-2007 through 2011-2012".
- ↑ Pennsylvania Department of Education, 2009-2010 School District Adjusted Index, May 2008
- ↑ Pennsylvania Department of Education, 2012-2013 School District Adjusted Index, May 2011
- ↑ Pennsylvania Department of Education, 2013-2014 School District Adjusted Index, May 2012
- ↑ Pennsylvania Department of Education, 2014-2015 School District Adjusted Index, September 2013
- ↑ Pennsylvania Department of Education, 2015-2016 School District Adjusted Index, September 2014
- ↑ Pennsylvania Department of Education. "2016-2017 School District Adjusted Index, September 5, 2015".
- ↑ Pennsylvania Department of Education (205). "Property Tax Relief".
- ↑ Pennsylvania Department of Education (April 2016). "Report on Referendum Exceptions For School Year 2016-2017" (PDF).
- ↑ Pennsylvania Department of Education (April 2015). "Taxpayer Relief Act Special Session Act 1 of 2006 Report on Referendum Exceptions For School Year 2015-2016" (PDF).
- ↑ Pennsylvania Department of Education (April 30, 2014). "Report on Referendum Exceptions For School Year 2014-2015".
- ↑ Pennsylvania Department of Education, Report on Referendum Exceptions For School Year 2013-2014, April 2013
- ↑ Pennsylvania Department of Education, Report on Referendum Exceptions For School Year 2012-2013, March 30, 2012
- ↑ Pennsylvania Department of Education (2011). "Special Session Act 1 of 2006 the Taxpayer Relief Act information".
- ↑ Pennsylvania Department of Education (April 2011). "Report on Exceptions".
- ↑ Pittsburgh Post Gazette (July 28, 2011). "Law could restrict school construction projects".
- ↑ Pennsylvania Department of Education (April 2010). "Pennsylvania SSAct1_Act1 Exceptions Report 2010-2011 April 2010".
- ↑ Pennsylvania Department of Education (April 2009). "Pennsylvania SSAct1 Exception requests Report_2009-2010_May 2009".
- ↑ Scarcella, Frank; Pursell, Tricia (May 25, 2010). "Local school tax assessments exceed state averages.". The Daily Item,.
- ↑ Evamarie Socha (June 15, 2011). "Mifflinburg Shuts down Laurelton".
- ↑ Pennsylvania Department of Education website (March 2010). "No Child Left Behind Blue Ribbon Schools in Pennsylvania,".
- ↑ "3rd Grade Mathematics Scores 2010 in IU16 Region Schools".
- ↑ "3rd Grade math IU16 region".
- ↑ "Laurelton Elementary School Academic Achievement Report Card 2009".
- ↑ Susquehanna Valley Schools Academic Achievement Low Income 3rd graders 2010
- ↑ "3rd Grade Reading Scores 2010 in IU16 Region Schools".
- ↑ "3rd grade Reading Achievement IU16 Region".
- ↑ Evamarie Socha (July 14, 2011). "School closure is a major concern in New Berlin".
- ↑ Pennsylvania Department of Education (September 21, 2012). "New Berlin Elementary School Academic Report Card 2012".
- ↑ "3rd grade Math PSSA 2011 CSIU16 region schools". 2011.
- ↑ Pennsylvania Department of Education (March 2011). "New Berlin Elementary School Academic Achievement Report Card 2010" (PDF).
- ↑ Pennsylvania Department of Education (March 2010). "New Berlin Elementary School Academic Achievement Report Card 2009".
- ↑ "3rd Grade Mathematics Scores 2008 in IU16 Region Schools".
- ↑ "3rd grade Reading PSSA 2011 CSIU16". September 29, 2011.
- ↑ Evamarie Socha (August 17, 2011). "Mifflinburg School Board votes to close Buffalo Crossroads school next year". The Daily Item.
- ↑ Evamarie Socha, Mifflinburg sells two elementary schools, The Daily Item, August 15, 2012
- ↑ Pennsylvania Department of Education (March 2011). "Buffalo Crossroads Elementary School Academic Achievement Report Card 2010".
- ↑ Mifflinburg Area School Board, Mifflinburg Area School District General Fund Annual Budget 2013-14, 2013
- ↑ Pennsylvania Department of Education (2013). "Disclosure of Interscholastic Athletic Opportunities".
- ↑ Mifflinburg Area High School Administration, Mifflinburg Area High School Student Handbook, 2013-14
- ↑ MASD Administration (2014). "Ticket/Season Pass Information".
- ↑ Home-Schooled, Charter School Children Can Participate in School District Extracurricular Activities, Pennsylvania Office of the Governor Press Release, November 10, 2005
- ↑ PA General Assembly (July 1, 2012). "Senate Bill 200 of Session 2011 Safety in Youth Sports Act".
- ↑ UMPC Sports Medicine (2014). "Managing Concussions in Student Athletes: The Safety in Youth Sports Act".
- ↑ Athletic Director (2014). "Fall 2014 Athletes information".
- ↑ Justin Strawser, They pay to play, The Daily Item, August 7, 2014
- ↑ Pennsylvania Interscholastic Athletics Association (2016). "PIAA School Directory".
Union County, Pennsylvania Schools | |||||||||||||||
|---|---|---|---|---|---|---|---|---|---|---|---|---|---|---|---|
| |||||||||||||||
| |||||||||||||||
Coordinates: 40°55′00″N 77°02′28″W / 40.91664°N 77.04111°W