La Haute-Gaspésie Regional County Municipality
| La Haute-Gaspésie | |
|---|---|
| Regional county municipality | |
 | |
| Coordinates: 49°13′N 66°04′W / 49.217°N 66.067°WCoordinates: 49°13′N 66°04′W / 49.217°N 66.067°W[1] | |
| Country |
|
| Province |
|
| Region | Gaspésie–Îles-de-la-Madeleine |
| Effective | March 18, 1981 |
| County seat | Sainte-Anne-des-Monts |
| Government[2] | |
| • Type | Prefecture |
| • Prefect | Allen Cormier |
| Area[2][3] | |
| • Total | 5,139.50 km2 (1,984.37 sq mi) |
| • Land | 5,066.02 km2 (1,956.00 sq mi) |
| Population (2011)[3] | |
| • Total | 12,088 |
| • Density | 2.4/km2 (6/sq mi) |
| • Pop 2006-2011 |
|
| • Dwellings | 6,292 |
| Time zone | EST (UTC−5) |
| • Summer (DST) | EDT (UTC−4) |
| Area code(s) | 418 and 581 |
| Website |
www |
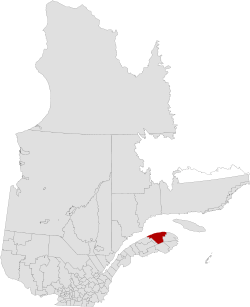
La Haute-Gaspésie (French pronunciation: [la ot gaspezi]) is a regional county municipality in the Gaspésie–Îles-de-la-Madeleine region of eastern Quebec, Canada, on the Gaspé peninsula. The regional county municipality seat is in Sainte-Anne-des-Monts.
Prior to May 27, 2000, it was known as Denis-Riverin regional county municipality.[4]
Subdivisions
There are 10 subdivisions within the RCM:[2]
|
|
|
|
Demographics
Population
| Canada census – La Haute-Gaspésie Regional County Municipality community profile | |||
|---|---|---|---|
| 2011 | 2006 | 2001 | |
| Population: | 12,088 (-2.0% from 2006) | 12,329 (-3.1% from 2001) | 12,722 (-7.4% from 1996) |
| Land area: | 5,066.02 km2 (1,956.00 sq mi) | 5,066.02 km2 (1,956.00 sq mi) | 5,066.02 km2 (1,956.00 sq mi) |
| Population density: | 2.4/km2 (6.2/sq mi) | 2.4/km2 (6.2/sq mi) | 2.5/km2 (6.5/sq mi) |
| Median age: | 51.0 (M: 50.6, F: 51.4) | 47.6 (M: 47.1, F: 48.1) | 43.5 (M: 43.0, F: 44.0) |
| Total private dwellings: | 6,292 | 5,850 | 5,999 |
| Median household income: | $38,749 | $31,655 | $29,389 |
| References: 2011[3] 2006[5] 2001[6] | |||
| Historical Census Data - La Haute-Gaspésie Regional County Municipality, Quebec[7] | ||||||||||||||||||||||||||
|---|---|---|---|---|---|---|---|---|---|---|---|---|---|---|---|---|---|---|---|---|---|---|---|---|---|---|
|
|
| ||||||||||||||||||||||||
Language
| Canada Census Mother Tongue - La Haute-Gaspésie Regional County Municipality, Quebec[7] | ||||||||||||||||||
|---|---|---|---|---|---|---|---|---|---|---|---|---|---|---|---|---|---|---|
| Census | Total | French |
English |
French & English |
Other | |||||||||||||
| Year | Responses | Count | Trend | Pop % | Count | Trend | Pop % | Count | Trend | Pop % | Count | Trend | Pop % | |||||
| 2011 |
11,970 |
11,840 | |
98.91% | 65 | |
0.54% | 20 | |
0.17% | 45 | |
0.38% | |||||
| 2006 |
12,170 |
12,010 | |
98.69% | 20 | |
0.16% | 10 | |
0.08% | 130 | |
1.07% | |||||
| 2001 |
12,495 |
12,415 | |
99.36% | 50 | |
0.40% | 10 | |
0.08% | 20 | |
0.16% | |||||
| 1996 |
13,610 |
13,485 | n/a | 99.08% | 60 | n/a | 0.44% | 45 | n/a | 0.33% | 20 | n/a | 0.15% | |||||
Transportation
Access Routes
Highways and numbered routes that run through the municipality, including external routes that start or finish at the county border:[8]
|
|
|
See also
References
- ↑ Reference number 361730 of the Commission de toponymie du Québec (French)
- 1 2 3 Geographic code 040 in the official Répertoire des municipalités (French)
- 1 2 3 "2011 Community Profiles". Canada 2011 Census. Statistics Canada. July 5, 2013. Retrieved 2014-03-07.
- ↑ "Modification aux municipalités du Québec, 2000" (PDF). Institut de la statistique du Québec. ISSN 0843-8250.
- ↑ "2006 Community Profiles". Canada 2006 Census. Statistics Canada. March 30, 2011. Retrieved 2014-03-07.
- ↑ "2001 Community Profiles". Canada 2001 Census. Statistics Canada. February 17, 2012. Retrieved 2014-03-07.
- 1 2 Statistics Canada: 1996, 2001, 2006, 2011 census
- ↑ Official Transport Quebec Road Map
 |
Gulf of Saint Lawrence Sept-Rivières RCM |
Gulf of Saint Lawrence Minganie RCM |
| |
| La Matanie RCM | |
La Côte-de-Gaspé RCM | ||
| ||||
| | ||||
| La Matapédia RCM | Bonaventure RCM |
| Regional county municipalities and equivalent territories | |
|---|---|
| Municipalities | |
This article is issued from Wikipedia - version of the 11/4/2015. The text is available under the Creative Commons Attribution/Share Alike but additional terms may apply for the media files.