Icelandic parliamentary election, 2003
| | |||||||||||||||||||||||||||||||||||||||||||||||||||||||||||||||||||||||||||||||||||||||||
| |||||||||||||||||||||||||||||||||||||||||||||||||||||||||||||||||||||||||||||||||||||||||
| |||||||||||||||||||||||||||||||||||||||||||||||||||||||||||||||||||||||||||||||||||||||||
| |||||||||||||||||||||||||||||||||||||||||||||||||||||||||||||||||||||||||||||||||||||||||

.jpg)
.jpg)


 |
| This article is part of a series on the politics and government of Iceland |
| Constitution |
|
Institutions |
|
Parliamentary elections were held in Iceland on 10 May 2003.[1] The Independence Party remained the largest party in the Althing, winning 22 of the 63 seats.[2]
Background
For the previous twelve years Davíð Oddsson of the Independence Party had been Prime Minister of Iceland and since the 1995 election had been ruling in coalition with the Progressive Party.[3] At the last election in 1999 the two ruling parties together won 38 of the 63 seats, to maintain a majority in the Icelandic parliament.[4]
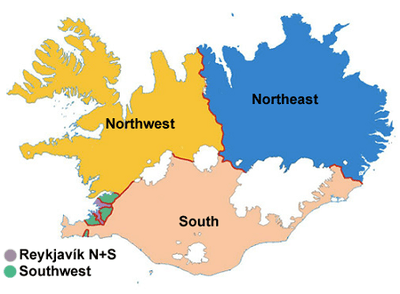
Constituencies
There are six constituencies in Iceland. According to the Law on Parliamentary Elections (nr.24/2000), each constituency is allocated nine seats decided by proportional voting in the constituency. In addition there are nine Leveling seats (either 1 or 2 per constituency, depending on their population size) which are allocated with the aim of achieving proportionality based on the overall number of party votes at the national level. The number of constituency seats shall however be adjusted ahead of the next election, if the ratio of residents with suffrage per available seat in the constituency becomes more than twice as big in the latest election, comparing the constituency with the highest ratio against that with the lowest ratio. In that case a constituency seat is reallocated from the constituency with the lowest ratio to that with the highest, until the various ratios comply with the rule. However, the total number of seats (including leveling seats) must never become less than six in any constituency.[5] The box below displays the number of available seats in each constituency at the 2003 parliamentary election.[6]
| Constituency | Constituency seats | Leveling seats | Total seats |
|---|---|---|---|
| Reykjavík North | 9 | 2 | 11 |
| Reykjavík South | 9 | 2 | 11 |
| SW | 9 | 2 | 11 |
| NW | 9 | 1 | 10 |
| NE | 9 | 1 | 10 |
| South | 9 | 1 | 10 |
| Total | 54 | 9 | 63 |
Method for apportionment of constituency seats
The available constituency seats are first distributed to each party according to the D'Hondt method, so that proportional representation is ensured within each of the constituencies. The next step is to apportion these party distributed seats to the candidates within the party having the highest "vote score", after counting both direct candidate votes and their share of party votes in the constituency. In Iceland the "candidate vote system" is that, for each constituency, each party provides a pre-ranked list of candidates beneath each party name (listed according to the preferred order decided by the party), but where the voters voting for the party can alter this pre-ranked order by renumbering the individual candidates and/or crossing out those candidates they do not like, so that such candidates will not get a share of the voter's "personal vote" for the party.[6][7]
As a restriction on the possibility of re-ranking candidates, it is however only possible to alter the first several candidates on the list. The borderline for alterations is drawn for the first three candidates if the party only win one of the total seats in the constituency, or if more than one seat is won the borderline shall be drawn at the pre-ranked number equal to two times the total amount of seats being won by the party in the constituency. So if a party has won two seats in a constituency, then the voter is only allowed to re-rank the top four ranked candidates on the list, with any rank altering by voters below this line simply being ignored when subsequently calculating the candidate vote shares within each party. Final calculation of the candidate vote shares is always done according to the Borda method, where all candidates above the previously described borderline in the ranking are granted voting fraction values according to the voters noted rank. If the number of considered candidates consist of four (as in the given example), then the first ranked candidate is assigned a value of 1 (a so-called full personal vote), the next one get the value 0.75 (1/4 less), followed likewise by 0.50 and 0.25 respectively for the two last candidates. If the number of considered candidates instead had been six (due to winning 3 seats), then the first ranked candidate in a similar way would be assigned a value of 1 (a so-called full personal vote), with the following five candidates receiving respectively 5/6, 4/6, 3/6, 2/6 and 1/6. As mentioned above, crossed out names will always be allocated a 0.00 value. The accumulated total score of the candidates voting fractions, will be used in determining which candidates receive the seats won by their party. Note that candidate vote scores are not directly comparable to candidates from other parties, as how many seats are being won in a constituency by a particular party will effect how their candidates receive voting fractions (like in the above examples, where a candidate ranked number four for a party winning two seats would receive a voting fraction of 0.25, compared to 0.50 for an equally ranked candidate belonging to a party winning 3 seats)[6][7]
Method for apportionment of leveling seats
After the initial apportionment of constituency seats, all the parties that exceed the election threshold of 5% nationally will also qualify to potentially be granted the extra leveling seats, which seek to adjust the result towards seat proportionality at the national level.
The calculation procedure for the distribution of leveling seats is, first, for each party having exceeded the national threshold of 5%, to calculate the ratio of its total number of votes at the national level divided by the sum of one extra seat added to the number of seats the party have so far won. The first leveling seat will go to the party with the highest ratio of votes per seat. The same calculation process is then repeated, until all 9 leveling seats have been allocated to specific parties. It should be noted that a party's "votes per seat" ratio will change during this calculation process, after each additional leveling seat being won. The second and final step is for each party being granted a leveling seat to pin point, across all constituencies, which of its runner-up candidates (candidates that came short of winning direct election through a constituency seat) should then win this additional seat. This selection is made by first identifying the constituency having the strongest "relative constituency vote shares for this additional seat of the party", which is decided by another proportional calculation, where the "relative vote share for the party list in each constituency", is divided with the sum of "one extra seat added to the number of already won constituency seats by the party list in the constituency". When this strongest constituency has been identified, the leveling seat will be automatically granted to the highest placed unelected runner-up candidate on the party list in this constituency, who among the remaining candidates have the highest personal vote score (the same figure as the one used when ranking candidates for constituency seats).[6][7]
The above described method is used for apportionment of all the party allocated leveling seats. Note that when selecting which of a party's constituencies shall receive its apportioned leveling seat, this identification may only happen in exactly the same numerical order as the leveling seats were calculated at the party level. This is important because the number of available leveling seats are limited per constituency, meaning that the last calculated leveling seats in all circumstances can never be granted to candidates who belong to constituencies where the available leveling seats already were granted to other parties.[6][7]
Campaign
The Social Democratic Alliance was the main left wing opposition party and their leader, Ingibjörg Sólrún Gísladóttir, a former mayor of Reykjavík, was hoping to become the first female Prime Minister of Iceland.[4] They were hoping to capitalise on a feeling that it was time for a change in government.[8] The Social Democrats stressed welfare, health and housing which they said the Independence Party had failed to address.[9]
The Independence Party campaigned on their record of economic growth over the past decade.[10] This had seen Icelandic businesses expand abroad and Iceland become the 6th richest county per capita in purchasing power parity.[11]
Opinion polls as the election neared showed the Independence Party with about 34-35% support and with a small lead over the Social Democratic Alliance which was getting 27-33% support.[3]
Results
The Independence Party maintained a narrow lead over the opposition Social Democratic Alliance.[12] However this was their worst election result since the 1987 election, as their vote dropped from 40.7% in the previous election to only 33.7%.[13] The Social Democrats gained three seats; however their leader, Ingibjörg Sólrún Gísladóttir, was not elected,[14] as she had only placed herself 5th on the list of candidates for her district.[14]
| Party | Chairperson(s) | Votes | % | ± | Seats | ± | |
|---|---|---|---|---|---|---|---|
| Independence Party (Sjálfstæðisflokkurinn) | Davíð Oddsson | 61,701 | 33.68 | 22 | |||
| Social Democratic Alliance (Samfylkingin) | Össur Skarphéðinsson | 56,700 | 30.95 | 20 | |||
| Progressive Party (Framsóknarflokkurinn) | Halldór Ásgrímsson | 32,484 | 17.73 | 12 | |||
| Left-Green Movement (Vinstrihreyfingin – grænt framboð) | Steingrímur J. Sigfússon | 16,129 | 8.81 | 5 | |||
| Liberal Party (Frjálslyndi flokkurinn) | Guðjón Arnar Kristjánsson | 13,523 | 7.38 | 4 | |||
| New Force (Nýtt afl) | Guðmundur Garðar Þórarinsson | 1,791 | 0.98 | — | 0 | — | |
| Independents from South Constituency (Óháðir í Suðurkjördæmi) | Kristján Pálsson | 844 | 0.46 | — | 0 | — | |
| Valid votes | 183,172 | 98.80 | |||||
| Invalid votes | 347 | 0.19 | |||||
| Blank votes | 1,873 | 1.01 | |||||
| Total | 185,392 | 100.00 | — | 63 | — | ||
| Female electorate | 105,878 | 50.11 | |||||
| Male electorate | 105,426 | 49.89 | |||||
| Female turnout | 93,459 | 88.27 | |||||
| Male turnout | 91,933 | 87.20 | |||||
| Electorate/Turnout | 211,304 | 87.84 | |||||
| Source: Statistics Iceland | |||||||
| Last election (1999) — Next election (2007) | |||||||
References
- ↑ Nohlen, D & Stöver, P (2010) Elections in Europe: A data handbook, p962 ISBN 978-3-8329-5609-7
- ↑ Nohlen & Stöver, p977
- 1 2 Haggalin, Sigga (2003-05-08). "Long-serving PM in Iceland fights to hold on to power". The Irish Times. p. 10.
- 1 2 Brown-Humes, Christopher (2003-05-09). "Membership of EU leaves Icelanders cold in election issues dominated by fish and taxes: Voters enjoy a higher standard of living but growing inequality may lead to a change of government". Financial Times. p. 7.
- ↑ "Law on Parliamentary Elections (nr.24/2000)" (in Icelandic). Althingi. 19 May 2000. Retrieved 4 February 2013.
- 1 2 3 4 5 "Apportionment of Seats to Althingi, the Icelandic Parliament: Analysis of the Elections 2003 + 2007 + 2009" (PDF). The National Electoral Commission of Iceland. April 2010. Retrieved 13 April 2013.
- 1 2 3 4 "The calculation of the allocation of parliamentary seats according to results of elections to Parliament 25th April 2009" (PDF) (in Icelandic). Landskjörstjórn (The National Electoral Commission). 18 May 2009 (adjusted 8 Jan 2010). Retrieved 8 April 2013. Check date values in:
|date=(help) - ↑ Wardell, Jane (2003-05-10). "Ruling party feels the heat in Icelandic vote". The Independent. p. 12.
- ↑ "Tight Iceland election". Pittsburgh Post-Gazette. 2003-05-11. Retrieved 2009-06-28.
- ↑ "Icelandic leader struggles to stay in power". The Irish Times. 2003-05-12. p. 10.
- ↑ "Europe: Cod's own country; Iceland's election". The Economist. 2003-05-17. p. 43.
- ↑ "Slim majority for re-elected Prime Minister". The Independent. 2003-05-12. p. 8.
- ↑ Brown-Humes, Christopher (2003-05-12). "Iceland coalition keeps power". Financial Times. p. 8.
- 1 2 "Struggle looms for Iceland PM". BBC News Online. 2003-05-11. Retrieved 2009-06-28.
| Parliamentary elections |
|
|---|---|
| Presidential elections | |
| Municipal elections | |
| Referendums | |
| |