Greek legislative election, 1928
Greek legislative election, 1928
.svg.png)
|
|
|
|
|
|
Parliamentary elections were held in Greece on 19 August 1928.[1] The result was a victory for the Liberal Party, which won 178 of the 250 seats.[2]
Background
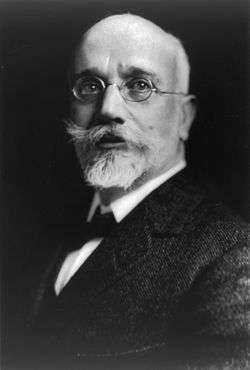
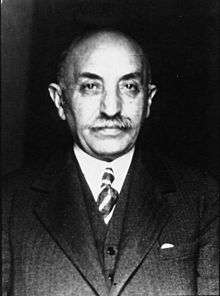
The Venizelists entered the elections as a coalition of five "parties of the liberals" under the leadership of Eleftherios Venizelos. These were the Democratic Union (later the Agricultural and Labour Party) under the leadership of Alexandros Papanastasiou, the National Democratic Party led by Georgios Kondylis, the Conservative Democratic Party under Andreas Michalakopoulos and the Progressive Union under the leadership of Konstantinos Zavitsanos. Because he wanted to follow an independent line from Venizelos, Georgios Kafantaris together with some personal friends and various dissatisfied liberals founded the Progressive Party.
The anti-Venizelist movement went into the elections divided as the People's Party, the Freethinkers' Party and a few independent royalists who put themselves up for election. The former dictator, Theodoros Pangalos, stood for election in Athens as chief of the National Union. In addition there were a large number of unaligned and independent candidates. Finally, the Communist Party of Greece entered the elections as the United Front.
Results
| Party |
Votes |
% |
Seats |
+/– |
|---|
| Liberal Party | 477,502 | 46.9 | 178 | +70 |
| People's Party | 243,543 | 23.9 | 19 | –41 |
| Agricultural and Labour Party | 68,278 | 6.7 | 20 | New |
| Freethinkers' Party | 53,958 | 5.3 | 1 | –51 |
| Independent Royal Supporters | 38,556 | 3.8 | 4 | New |
| National Democratic Party | 27,603 | 2.7 | 9 | New |
| Progressive Party | 25,729 | 2.5 | 3 | New |
| Independent Democrats | 18,069 | 1.8 | 6 | New |
| Farmers' Party | 17,042 | 1.7 | 0 | New |
| Conservative Democratic Party | 15,852 | 1.6 | 5 | New |
| United Front | 14,352 | 1.4 | 0 | New |
| Progressive Union | 13,452 | 1.3 | 5 | New |
| National Union of Greece | 1,958 | 0.2 | 0 | New |
| Independents | 1,387 | 0.1 | 0 | New |
| Invalid/blank votes | 4,153 | – | – | – |
| Total | 1,021,434 | 100 | 250 | –36 |
| Registered voters/turnout | | | – | – |
| Source: Nohlen & Stöver |
| Popular vote |
|---|
|
|
|
|
|
| KF |
|
46.94% |
| LK |
|
23.94% |
| AEK |
|
6.71% |
| KE |
|
5.30% |
| AB |
|
3.79% |
| KED |
|
2.71% |
| PK |
|
2.53% |
| AS |
|
1.78% |
| AK |
|
1.68% |
| KSD |
|
1.56% |
| EM |
|
1.41% |
| KPE |
|
1.32% |
| Others |
|
0.33% |
| Parliament seats |
|---|
|
|
|
|
|
| KF |
|
71.20% |
| AEK |
|
8.00% |
| LK |
|
7.60% |
| KED |
|
3.60% |
| AS |
|
2.40% |
| KSD |
|
2.00% |
| KPE |
|
2.00% |
| AB |
|
1.60% |
| PK |
|
1.20% |
| KE |
|
0.40% |
References
- ↑ Nohlen, D & Stöver, P (2010) Elections in Europe: A data handbook, p829 ISBN 978-3-8329-5609-7
- ↑ Nohlen & Stöver, p858