Dundee City Council election, 2012
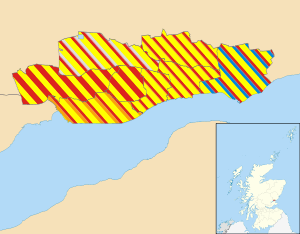
Elections to Dundee City Council were held on 3 May 2012 on the same day as the other Scottish local government elections. The election used the eight wards created as a result of the Local Governance (Scotland) Act 2004,[1] with each ward electing three or four Councillors using the single transferable vote system a form of proportional representation, with 29 Councillors elected.
After the 2007 Election a Labour-Lib Dem Coalition was formed. This administration subsequently collapsed and a SNP minority administration was formed.
The 2012 election saw the Scottish National Party gain 3 seats and secure an overall majority on the Council. The Scottish Labour Party retained their 10 seats on the Council while both the Scottish Conservative and Unionist Party and the Scottish Liberal Democrats were reduced to a single Councillor. There also remains a single Independent.
Election results
| Dundee Local Election Result 2012 |
| Party |
Seats |
Gains |
Losses |
Net gain/loss |
Seats % |
Votes % |
Votes |
+/− |
| |
SNP |
16 |
3 |
0 |
 3 3 |
55.17 |
43.35 |
16,704 |
3.35 |
| |
Labour |
10 |
- |
- |
 |
34.48 |
30.14 |
11,612 |
0.74 |
| |
Conservative |
1 |
0 |
2 |
 2 2 |
3.45 |
11.26 |
4,340 |
1.24 |
| |
Liberal Democrats |
1 |
0 |
1 |
1 |
3.45 |
8.98 |
3,461 |
2.32 |
| |
Independent |
1 |
- |
- |
|
3.45 |
4.44 |
1,709 |
1.4 |
| |
TUSC |
0 |
- |
- |
|
- |
1.27 |
488 |
1.27 |
| |
Scottish Green |
0 |
- |
- |
|
- |
0.56 |
217 |
0.04 |
Note: "Votes" are the first preference votes. The net gain/loss and percentage changes relate to the result of the previous Scottish local elections on 3 May 2007. This may differ from other published sources showing gain/loss relative to seats held at dissolution of Scotland's councils.
Ward results
Strathmartine
- 2007: 1xSNP; 1xIndependent; 1xLab; 1xLib Dem
- 2012: 2xSNP; 1xLab; 1xIndependent
- 2007-2012 Change: SNP gain one seat from Lib Dem
| Strathmartine - 4 seats |
| Party | Candidate | % 1st Pref | Count 1 | Count 2 | Count 3 | Count 4 | Count 5 | Count 6 | Count 7 | Count 8 | Count 9 |
|
SNP |
John Alexander |
23.47% |
1,245 |
|
|
|
|
|
|
|
|
|
Labour |
Kevin Keenan (incumbent) |
20.78% |
1,102 |
|
|
|
|
|
|
|
|
|
Independent |
Ian Borthwick (incumbent) |
19.78% |
1,049 |
1,057.4 |
1,061.7 |
|
|
|
|
|
|
|
SNP |
Stewart Hunter (incumbent) |
14.22% |
754 |
909.9 |
910.9 |
911.1 |
917.6 |
939.2 |
942.3 |
1,016.6 |
1,221.4 |
|
Liberal Democrats |
Iliyan Stefanov |
10.89% |
578 |
583.6 |
584.8 |
584.9 |
596.9 |
605.9 |
651 |
708.9 |
|
|
Labour |
John McKiddie |
6.62% |
351 |
354.8 |
385.1 |
385.2 |
390.3 |
406.3 |
419.3 |
|
|
|
Conservative |
Colin Stewart |
1.83% |
97 |
97.3 |
97.3 |
97.3 |
100.4 |
101.4 |
|
|
|
|
TUSC |
Jim McFarlane |
1.51% |
80 |
81.2 |
82.3 |
82.3 |
90.3 |
|
|
|
|
|
Independent |
Grant Simmons |
0.90% |
48 |
48.7 |
48.9 |
49 |
|
|
|
|
|
| Electorate: 14,285 Valid: 5,304 Spoilt: 133 Quota: 1,061 Turnout: 5,437 (37.13%) |
Lochee
- 2007: 2xSNP; 2xLab
- 2012: 2xSNP; 2xLab
- 2007-2012 Change: No change
| Lochee - 4 seats |
| Party | Candidate | % 1st Pref | Count 1 | Count 2 | Count 3 | Count 4 | Count 5 | Count 6 | Count 7 | Count 8 | Count 9 |
|
SNP |
Bob Duncan (incumbent) |
31.57% |
1,594 |
|
|
|
|
|
|
|
|
|
Labour |
Tom Ferguson (incumbent) |
25.91% |
1,308 |
|
|
|
|
|
|
|
|
|
SNP |
Alan Ross (incumbent) |
14.78% |
746 |
1,220.4 |
|
|
|
|
|
|
|
|
Labour |
Norma McGovern |
12.32% |
622 |
650.9 |
889.2 |
914.1 |
914.6 |
934.9 |
965.7 |
997.2 |
1,149.8 |
|
Independent |
Scott Campbell |
7.41% |
374 |
394.5 |
404.5 |
432.3 |
434.7 |
453.5 |
480.6 |
577.9 |
|
|
Conservative |
Lewis Anderson |
4.89% |
247 |
253.2 |
254.8 |
257.4 |
260.1 |
274.4 |
275.9 |
|
|
|
TUSC |
Rory Malone |
1.6% |
81 |
87.6 |
97.2 |
109.8 |
110 |
113.8 |
|
|
|
|
Liberal Democrats |
Eildh Jayne Conacher |
1.23% |
62 |
70 |
73.9 |
78.4 |
89.9 |
|
|
|
|
|
Liberal Democrats |
Joe Derry Setch |
0.3% |
15 |
16.5 |
17.6 |
20.5 |
|
|
|
|
|
| Electorate: 13,439 Valid: 5,049 Spoilt: 164 Quota: 1,010 Turnout: 5,213 (37.57%) |
West End
- 2007: 1xLib Dem; 1xLab; 1xSNP; 1xCon
- 2012: 2xSNP; 1xLib Dem; 1xLab
- 2007-2012 Change: SNP gain one seat from Con
| West End - 4 seats |
| Party | Candidate | % 1st Pref | Count 1 | Count 2 | Count 3 | Count 4 | Count 5 | Count 6 | Count 7 |
|
Liberal Democrats |
Fraser MacPherson (incumbent) |
32.33% |
1,453 |
|
|
|
|
|
|
|
SNP |
Bill Campbell |
21.43% |
963 |
|
|
|
|
|
|
|
Labour |
Richard McCready (incumbent) |
20.85% |
937 |
|
|
|
|
|
|
|
Conservative |
Donald Hay (incumbent) |
10.32% |
464 |
606.2 |
608.7 |
612.5 |
614.8 |
666.5 |
|
|
SNP |
Vari McDonald |
9.15% |
411 |
518.1 |
571.6 |
578.1 |
590.4 |
723.7 |
837.6 |
|
Scottish Green |
Pauline Hinchion |
4.83% |
217 |
335.9 |
339.2 |
347.8 |
374.4 |
|
|
|
TUSC |
Raymond Mennie |
1.1% |
49 |
65 |
65.5 |
69.2 |
|
|
|
| Electorate: 12,910 Valid: 4,494 Spoilt: 77 Quota: 899 Turnout: 4,571 (34.81%) |
Coldside
- 2007: 2xSNP; 2xLab
- 2012: 2xSNP; 2xLab
- 2007-2012 Change: No change
| Coldside - 4 seats |
| Party | Candidate | % 1st Pref | Count 1 | Count 2 | Count 3 | Count 4 |
|
SNP |
Jimmy Black (incumbent)†† |
29.76% |
1,536 |
|
|
|
|
Labour |
Mohammed Asif (incumbent) |
21.06% |
1,087 |
|
|
|
|
Labour |
Helen Wright (incumbent) |
19.07% |
984 |
1,000 |
1,032.7 |
1,069.9 |
|
SNP |
Dave Bowes (incumbent) |
16.16% |
834 |
1,281.7 |
|
|
|
Conservative |
James Clancy |
4.92% |
254 |
258.6 |
269.3 |
270.6 |
|
Liberal Democrats |
Raymond Alexander Lawrie |
2.65% |
137 |
138.9 |
151.8 |
153.9 |
|
Independent |
Andy McBride |
2.56% |
132 |
134.9 |
151.6 |
152.9 |
|
Independent |
Stuart Winton |
2.05% |
106 |
110.6 |
120 |
120.8 |
|
TUSC |
Wayne Scott |
1.76% |
91 |
92.6 |
100.5 |
101.1 |
| Electorate: 14,404 Valid: 5,161 Spoilt: 160 Quota: 1,033 Turnout: 5,321 (35.83%) |
Maryfield
- 2007: 2xSNP; 1xLab
- 2012: 2xSNP; 1xLab
- 2007-2012 Change: No change
| Maryfield - 3 seats |
| Party | Candidate | % 1st Pref | Count 1 | Count 2 | Count 3 | Count 4 | Count 5 | Count 6 | Count 7 |
|
SNP |
Ken Lynn (incumbent) |
34.57% |
1,187 |
|
|
|
|
|
|
|
Labour |
Georgia Cruickshank |
18.11% |
622 |
634.7 |
643.9 |
644.1 |
675.6 |
736.5 |
1,334.7 |
|
Labour |
George McIrvine |
18.32% |
629 |
640.1 |
650.1 |
650.2 |
673 |
713.9 |
|
|
SNP |
Craig Melville (incumbent)† |
16.28% |
559 |
840.8 |
859.9 |
|
|
|
|
|
Conservative |
Stephen MacSporran |
7.25% |
249 |
253.7 |
253.7 |
253.7 |
296.3 |
|
|
|
Liberal Democrats |
Christopher Hall |
3.67% |
126 |
129.6 |
136.9 |
136.9 |
|
|
|
|
TUSC |
Derek Milligan |
1.81% |
62 |
64.8 |
|
|
|
|
|
| Electorate: 11,555 Valid: 3,434 Spoilt: 93 Quota: 859 Turnout: 3,527 (29.72%) |
North East
- 2007: 2xSNP; 1xLab
- 2012: 2xSNP; 1xLab
- 2007-2012 Change: No change
| North East - 3 seats |
| Party | Candidate | % 1st Pref | Count 1 | Count 2 |
|
SNP |
Gregor Murray |
33.51% |
1,143 |
|
|
Labour |
Brian Gordon (incumbent) |
27.79% |
948 |
|
|
SNP |
Willie Sawers (incumbent) |
24.57% |
838 |
1,096.3 |
|
Labour |
Stephen Massey |
8.53% |
291 |
300.4 |
|
Conservative |
Robert Lindsay |
2.87% |
98 |
101.3 |
|
TUSC |
Sinead Daly |
1.2% |
41 |
42 |
|
Liberal Democrats |
Jennifer Rankin |
0.9% |
32 |
35.6 |
|
Liberal Democrats |
Iqbal Mohammad |
0.6% |
20 |
21.3 |
| Electorate: 10,781 Valid: 3,411 Spoilt: 92 Quota: 853 Turnout: 3,503 (31.64%) |
East End
- 2007: 2xSNP; 1xLab
- 2012: 2xSNP; 1xLab
- 2007-2012: No change
| East End - 3 seats |
| Party | Candidate | % 1st Pref | Count 1 | Count 2 | Count 3 | Count 4 | Count 5 |
|
SNP |
Will Dawson (incumbent) |
32.32% |
1,322 |
|
|
|
|
|
Labour |
Lesley Brennan |
23.57% |
964 |
972.6 |
985.5 |
1,001.8 |
1,023.5 |
|
SNP |
Christina Roberts (incumbent) |
21.20% |
867 |
1,125.1 |
|
|
|
|
Labour |
Martin Keenan |
12.47% |
510 |
518.8 |
528.2 |
540.7 |
564.2 |
|
Conservative |
Wendy Anderson |
5.77% |
236 |
239.4 |
243.4 |
252.9 |
278.1 |
|
Liberal Democrats |
Allan Petrie |
2.62% |
107 |
111.7 |
118.8 |
131 |
|
|
TUSC |
Linda Rose |
2.05% |
84 |
87.6 |
97.2 |
|
|
| Electorate: 11,787 Valid: 4,090 Spoilt: 143 Quota: 1,023 Turnout: 4,233 (34.7%) |
The Ferry
- 2007: 2xCon; 1xSNP; 1xLab
- 2012: 2xSNP; 1xCon; 1xLab
- 2007-2012 Change: SNP gain one seat from Con
| The Ferry - 4 seats |
| Party | Candidate | % 1st Pref | Count 1 | Count 2 | Count 3 | Count 4 | Count 5 |
|
Conservative |
Derek Scott (incumbent) |
22.46% |
1,704 |
|
|
|
|
|
SNP |
Ken Guild (incumbent) |
19.04% |
1,445 |
1,456.9 |
1,606.4 |
|
|
|
SNP |
Kevin Malcolm Cordell |
16.61% |
1,260 |
1,265.1 |
1,378.9 |
1,451.8 |
1674 |
|
Labour |
Laurie Bidwell (incumbent) |
16.57% |
1,257 |
1,267.3 |
1,465.4 |
1,469.6 |
1,768.2 |
|
Conservative |
Rod Wallace (incumbent) |
13.06% |
991 |
1,109.1 |
1,383.3 |
1,388.5 |
|
|
Liberal Democrats |
Craig Robertson Duncan |
12.27% |
931 |
949.6 |
|
|
|
| Electorate: 15,782 Valid: 7,588 Spoilt: 96 Quota: 1,518 Turnout: 7,684 (48.08%) |
Post-Election Changes
- † On 16 January 2016 Maryfield SNP Cllr Craig Melville was suspended from the party and became an Independent. He resigned his Council seat on 5 February 2016 and a by-election was held on 31 March 2016 which was held by the SNP's Lynne Short.
By-election since 2012
References
http://www.dundeecity.gov.uk/elections2012/electionsmoreinfo/
External links