Danish general election, 1998
Danish general election, 1998
|
|
|
|
|
|
|
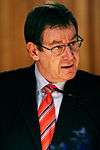
General elections were held in Denmark on 11 March 1998.[1] Although the centre-right parties led by Venstre had been expected to win, the Social Democratic Party-led government of Poul Nyrup Rasmussen remained in power in a very close vote that required several recounts.
Venstre leader Uffe Ellemann-Jensen resigned as party leaders a few days after the election. The new Danish People's Party made a successful electoral debut. Voter turnout was 85.9% in Denmark proper, 66.1% in the Faroe Islands and 63.2% in Greenland.[2]
Results
| Denmark |
|---|
| Party |
Votes |
% |
Seats |
+/– |
| Social Democratic Party | 1,223,620 | 35.9 | 63 | +1 |
| Venstre | 817,894 | 24.0 | 42 | ±0 |
| Conservative People's Party | 303,965 | 8.9 | 16 | –11 |
| Socialist People's Party | 257,406 | 7.6 | 13 | ±0 |
| Danish People's Party | 252,429 | 7.4 | 13 | New |
| Centre Democrats | 146,802 | 4.3 | 8 | +3 |
| Danish Social Liberal Party | 131,254 | 3.9 | 7 | –1 |
| Red-Green Alliance | 91,933 | 2.7 | 5 | –1 |
| Christian People's Party | 85,656 | 2.5 | 4 | +4 |
| Progress Party | 82,437 | 2.4 | 4 | –7 |
| Democratic Renewal | 10,768 | 0.3 | 0 | New |
| Independents | 1,833 | 0.1 | 0 | –1 |
| Invalid/blank votes | 25,929 | – | – | – |
| Total | 3,431,926 | 100 | 175 | 0 |
| Faroe Islands |
| People's Party | 5,569 | 26.9 | 1 | ±0 |
| Social Democratic Party | 4,689 | 22.7 | 1 | +1 |
| Union Party | 4,510 | 21.8 | 0 | –1 |
| Republican Party | 4,325 | 20.9 | 0 | ±0 |
| Self-Government Party | 1,603 | 7.7 | 0 | ±0 |
| Invalid/blank votes | 146 | – | – | – |
| Total | 20,842 | 100 | 2 | 0 |
| Greenland |
| Siumut | 8,502 | 36.5 | 1 | New |
| Solidarity | 8,404 | 36.1 | 1 | ±0 |
| Inuit Ataqatigiit | 4,988 | 21.4 | 0 | New |
| Centre Party | 99 | 0.4 | 0 | ±0 |
| Independents | 1,293 | 5.6 | 0 | –1 |
| Invalid/blank votes | 891 | – | – | – |
| Total | 24,117 | 100 | 2 | 0 |
| Source: Nohlen & Stöver |
| Popular vote |
|---|
|
|
|
|
|
| A |
|
35.93% |
| V |
|
24.01% |
| C |
|
8.92% |
| F |
|
7.56% |
| O |
|
7.41% |
| D |
|
4.31% |
| B |
|
3.85% |
| Ø |
|
2.70% |
| Q |
|
2.51% |
| Z |
|
2.42% |
| Others |
|
0.37% |
References
- ↑ Nohlen, D & Stöver, P (2010) Elections in Europe: A data handbook, p525 ISBN 978-3-8329-5609-7
- ↑ Nohlen & Stöver, p549