Dún Laoghaire–Rathdown County Council election, 1999
Dún Laoghaire-Rathdown County Council election, 1999

|
|
|
|
|
|
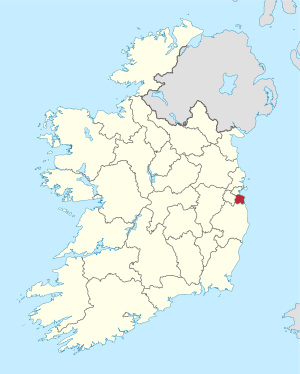
| Map showing the area of Dún Laoghaire-Rathdown County Council |
|
Council control after election
TBD
|
|
|
An election to Dún Laoghaire-Rathdown County Council took place on 10 June 1999 as part of that year's Irish local elections. 28 councillors were elected from six electoral divisions by PR-STV voting for a five-year term of office.
Results by party
Results by Electoral Area
Ballybrack
| Ballybrack - 6 seats |
| Party | Candidate | % 1st Pref | Count 1 | Count 2 | Count 3 | Count 4 | Count 5 | Count 6 | Count 7 | Count 8 |
|
Fianna Fáil |
Larry Butler* |
17.47 |
1,974 |
|
|
|
|
|
|
|
|
Fine Gael |
Donal Marren* |
14.26 |
1,611 |
|
|
|
|
|
|
|
|
Labour Party |
Denis O'Callaghan* |
10.28 |
1,161 |
1,182 |
1,223 |
1,283 |
1,284 |
1,311 |
1,409 |
1,472 |
|
Fine Gael |
Eoin Costello |
9.80 |
1,107 |
1,146 |
1,157 |
1,196 |
1,199 |
1,470 |
1,507 |
1,668 |
|
Labour Party |
Frank Smyth* |
9.41 |
1,063 |
1,072 |
1,114 |
1,128 |
1,128 |
1,179 |
1,308 |
1,434 |
|
Fianna Fáil |
Bernie Lowe |
7.72 |
872 |
1,041 |
1,059 |
1,101 |
1,102 |
1,214 |
1,317 |
1,579 |
|
Green Party |
Catherine Sweeney |
7.55 |
853 |
867 |
909 |
948 |
948 |
1,070 |
1,233 |
1,367 |
|
Independent |
Larry Lohan* |
6.39 |
722 |
764 |
779 |
806 |
808 |
881 |
927 |
|
|
Progressive Democrats |
Feilim Clear |
6.26 |
707 |
736 |
744 |
764 |
765 |
|
|
|
|
Sinn Féin |
Mick Nolan |
6.17 |
697 |
706 |
746 |
765 |
767 |
791 |
|
|
|
Independent |
John Kavanagh |
2.44 |
276 |
282 |
300 |
|
|
|
|
|
|
Socialist Workers |
David O'Sullivan |
1.37 |
155 |
156 |
|
|
|
|
|
|
|
Independent |
Tom Mason |
0.89 |
100 |
101 |
|
|
|
|
|
|
| Electorate: 31,527 Valid: 11,298 (35.84%) Spoilt: 145 Quota: 1,615 Turnout: 11,443 (36.30%) |
Blackrock
| Blackrock - 4 seats |
| Party | Candidate | % 1st Pref | Count 1 | Count 2 | Count 3 | Count 4 | Count 5 | Count 6 | Count 7 | Count 8 |
|
Fianna Fáil |
Barry Andrews |
20.75 |
1,791 |
|
|
|
|
|
|
|
|
Labour Party |
Niamh Bhreathnach |
19.37 |
1,672 |
1,683 |
1,692 |
1,854 |
|
|
|
|
|
Fine Gael |
William Dockrell* |
12.76 |
1,101 |
1,104 |
1,110 |
1,156 |
1,171 |
1,236 |
1,349 |
1,584 |
|
Fine Gael |
Mary Brophy |
10.02 |
865 |
869 |
872 |
917 |
928 |
987 |
1,118 |
1,311 |
|
Progressive Democrats |
Victor Boyhan |
8.84 |
763 |
768 |
782 |
809 |
823 |
939 |
1,137 |
1,316 |
|
Fianna Fáil |
Barry Conway |
8.20 |
708 |
743 |
751 |
788 |
794 |
853 |
|
|
|
Green Party |
Anne Brogan-Young |
7.16 |
618 |
620 |
650 |
686 |
699 |
|
|
|
|
Labour Party |
Marian White |
6.16 |
532 |
534 |
543 |
650 |
718 |
951 |
1,034 |
|
|
Labour Party |
Seán Misteil* |
5.49 |
474 |
476 |
485 |
|
|
|
|
|
|
Independent |
Bill Stack |
1.23 |
106 |
106 |
|
|
|
|
|
|
| Electorate: 22,155 Valid: 8,630 (38.95%) Spoilt: 110 Quota: 1,727 Turnout: 8,740 (39.45%) |
Dundrum
| Dundrum - 6 seats |
| Party | Candidate | % 1st Pref | Count 1 | Count 2 | Count 3 | Count 4 | Count 5 | Count 6 | Count 7 | Count 8 | Count 9 | Count 10 |
|
Fianna Fáil |
Tony Fox* |
21.67 |
2,828 |
|
|
|
|
|
|
|
|
|
|
Fine Gael |
Mary Elliott* |
14.13 |
1,844 |
1,938 |
|
|
|
|
|
|
|
|
|
Fine Gael |
Pat Hand* |
10.04 |
1,310 |
1,384 |
1,408 |
1,807 |
1,937 |
|
|
|
|
|
|
Fianna Fáil |
Trevor Matthews* |
9.36 |
1,221 |
1,513 |
1,522 |
1,535 |
1,565 |
1,633 |
1,789 |
1,804 |
2,039 |
|
|
Labour Party |
Aidan Culhane |
8.57 |
1,118 |
1,172 |
1,190 |
1,197 |
1,234 |
1,269 |
1,423 |
1,437 |
1,525 |
1,612 |
|
Fianna Fáil |
Tony Kelly |
8.49 |
1,108 |
1,267 |
1,279 |
1,283 |
1,307 |
1,358 |
1,450 |
1,461 |
2,050 |
|
|
Fianna Fáil |
David Boylan* |
6.58 |
859 |
1,029 |
1,040 |
1,049 |
1,062 |
1,116 |
1,176 |
1,186 |
|
|
|
Green Party |
Dominic Leonard |
6.08 |
794 |
828 |
867 |
871 |
892 |
1,019 |
1,200 |
1,222 |
1,285 |
1,381 |
|
Progressive Democrats |
John Smyth |
5.13 |
670 |
697 |
712 |
715 |
755 |
808 |
|
|
|
|
|
Fine Gael |
Michael O'Driscoll |
4.33 |
565 |
581 |
588 |
598 |
|
|
|
|
|
|
|
Independent |
Richard Greene* |
3.88 |
506 |
541 |
615 |
620 |
647 |
|
|
|
|
|
|
Independent |
Shane Egan |
1.75 |
228 |
236 |
|
|
|
|
|
|
|
|
| Electorate: 32,716 Valid: 13,051 (39.89%) Spoilt: 150 Quota: 1,865 Turnout: 13,201 (40.35%) |
Dún Laoghaire
| Dún Laoghaire - 6 seats |
| Party | Candidate | % 1st Pref | Count 1 | Count 2 | Count 3 | Count 4 | Count 5 | Count 6 | Count 7 | Count 8 |
|
Labour Party |
Eamon GilmoreTD* |
19.59 |
2,490 |
|
|
|
|
|
|
|
|
Fianna Fáil |
Betty Coffey* |
17.21 |
2,187 |
|
|
|
|
|
|
|
|
Fine Gael |
Senator Liam T. Cosgrave* |
14.89 |
1,893 |
|
|
|
|
|
|
|
|
Progressive Democrats |
Senator Helen Keogh* |
12.04 |
1,530 |
1,621 |
1,672 |
1,681 |
1,787 |
1,843 |
|
|
|
Green Party |
Vincent MacDowell |
8.80 |
1,119 |
1,205 |
1,223 |
1,225 |
1,253 |
1,296 |
1,516 |
1,594 |
|
Fine Gael |
Barbara Robinson-Smyth |
8.08 |
1,027 |
1,067 |
1,084 |
1,103 |
1,318 |
1,335 |
1,501 |
1,514 |
|
Labour Party |
Jane Dillon-Byrne* |
7.10 |
902 |
1,256 |
1,295 |
1,300 |
1,374 |
1,409 |
1,613 |
1,619 |
|
Fianna Fáil |
Eimear McAuliffe |
6.13 |
779 |
817 |
896 |
899 |
928 |
1,257 |
|
|
|
Fine Gael |
Barbara Culleton |
3.23 |
410 |
453 |
475 |
512 |
|
|
|
|
|
Fianna Fáil |
Peter Lawlor |
2.93 |
373 |
395 |
540 |
542 |
560 |
|
|
|
| Electorate: 34,117 Valid: 12,710 (37.25%) Spoilt: 120 Quota: 1,816 Turnout: 12,928 (37.89%) |
Glencullen
| Glencullen - 3 seats |
| Party | Candidate | % 1st Pref | Count 1 | Count 2 | Count 3 | Count 4 | Count 5 |
|
Fine Gael |
Olivia MitchellTD* |
35.67 |
1,752 |
|
|
|
|
|
Fianna Fáil |
Jimmy Murphy |
20.72 |
1,018 |
1,075 |
1,118 |
1,151 |
1,220 |
|
Fianna Fáil |
Maria Corrigan |
19.85 |
975 |
1,080 |
1,115 |
1,197 |
1,330 |
|
Labour Party |
Pat Fitzgerald* |
7.55 |
371 |
425 |
450 |
590 |
|
|
Green Party |
Tara Skakie |
7.23 |
355 |
395 |
433 |
|
|
|
Fine Gael |
Hugh Walsh |
5.48 |
269 |
517 |
545 |
634 |
877 |
|
Independent |
Peter Doyle |
3.50 |
172 |
191 |
|
|
|
| Electorate: 14,466 Valid: 4,912 (33.96%) Spoilt: 57 Quota: 1,229 Turnout: 4,969 (34.35%) |
Stillorgan
| Stillorgan - 3 seats |
| Party | Candidate | % 1st Pref | Count 1 | Count 2 | Count 3 | Count 4 | Count 5 | Count 6 | Count 7 |
|
Fine Gael |
Louise Cosgrave |
17.03 |
1,149 |
1,200 |
1,255 |
1,345 |
1,548 |
2,106 |
|
|
Progressive Democrats |
Fiona O'Malley |
13.43 |
906 |
960 |
1,021 |
1,113 |
1,264 |
1,395 |
1,650 |
|
Independent |
Gearóid O'Keeffe |
12.81 |
864 |
925 |
973 |
1,130 |
1,287 |
1,382 |
1,494 |
|
Fianna Fáil |
Senator Don Lydon* |
11.58 |
781 |
806 |
1,153 |
1,319 |
1,373 |
1,496 |
1,548 |
|
Fine Gael |
Donal Lowry* |
11.25 |
759 |
787 |
818 |
895 |
993 |
|
|
|
Fianna Fáil |
Gerry Horkan |
9.40 |
634 |
656 |
|
|
|
|
|
|
Independent |
Richard Greene* |
8.86 |
598 |
679 |
717 |
|
|
|
|
|
Labour Party |
Margaret McCluskey |
8.70 |
587 |
695 |
733 |
785 |
|
|
|
|
Green Party |
Larry Gordon* |
6.95 |
469 |
|
|
|
|
|
|
| Electorate: 15,698 Valid: 6,747 (42.98%) Spoilt: 75 Quota: 1,687 Turnout: 6,822 (43.46%) |
External links