1985–86 South Pacific cyclone season
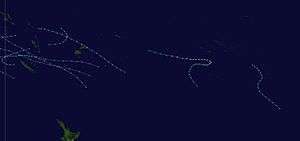 | |
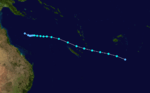
| Season summary map | |
| First system formed | February 5, 1986 |
|---|---|
| Last system dissipated | May 22, 1986 |
| Strongest storm1 | Ima – 940 hPa (mbar), 165 km/h (105 mph) (10-minute sustained) |
| Tropical cyclones | 7 |
| Severe tropical cyclones | 3 |
| Total fatalities | Unknown |
| Total damage | Unknown |
| 1Strongest storm is determined by lowest pressure | |
1983–84, 1984–85, 1985-86, 1986–87, 1988–89 | |
Seasonal summary

During November and December no significant tropical cyclones developed in or moved into the basin in the region,
Storms
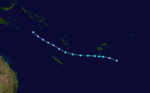
Severe Tropical Cyclone Ima
| Category 4 severe tropical cyclone (Australian scale) | |||
|---|---|---|---|
| Category 1 tropical cyclone (SSHWS) | |||
| |||
| Duration | February 5 – February 16 | ||
| Peak intensity | 165 km/h (105 mph) (10-min) 940 hPa (mbar) | ||


Severe Tropical Cyclone Ima existed from February 5 to February 16.
Ima affected French Polynesia's Austral, Society and Tubuai Islands, from February 9-14 and caused extensive damage to Rimatara.
Tropical Cyclone June
| Category 2 tropical cyclone (Australian scale) | |||
|---|---|---|---|
| Tropical storm (SSHWS) | |||
| |||
| Duration | February 5 – February 10 | ||
| Peak intensity | 100 km/h (65 mph) (10-min) 980 hPa (mbar) | ||

On February 5, TCWC Nadi (a.k.a. Fiji Meteorological Service) reported that a tropical depression had developed early on February 10. About 24 hours later, the system intensified into a Category 1 cyclone on the Australian intensity scale.[1] Around that same time, the Naval Pacific Meteorology and Oceanography Center followed suit by upgrading the system into a tropical storm.[2] Gradually intensifying, Nadi estimated that June had peaked in intensity with winds of 65 mph (105 km/h) late on February 7.[1] Meanwhile, the JTWC reported that Tropical Cyclone June had also peaked in intensity.[2] By February 9, June had weakened into a tropical depression. June was no longer a tropical cyclone by the morning.[1]
Tropical Cyclone Keli
| Category 1 tropical cyclone (Australian scale) | |||
|---|---|---|---|
| Tropical storm (SSHWS) | |||
| |||
| Duration | February 8 – February 14 | ||
| Peak intensity | 85 km/h (50 mph) (10-min) 987 hPa (mbar) | ||

Tropical Cyclone Keli existed from February 8 to February 14.
Tropical Cyclone Lusi
| Category 1 tropical cyclone (Australian scale) | |||
|---|---|---|---|
| Tropical storm (SSHWS) | |||
| |||
| Duration | March 2 – March 10 | ||
| Peak intensity | 75 km/h (45 mph) (10-min) 990 hPa (mbar) | ||

According to the Vanautu Meteorological Service, there was no significant damage reported within Vanautu.[3]
Tropical Cyclone Alfred
| Category 1 tropical cyclone (Australian scale) | |||
|---|---|---|---|
| Tropical storm (SSHWS) | |||
| |||
| Duration | March 7 – March 11 | ||
| Peak intensity | 75 km/h (45 mph) (10-min) 990 hPa (mbar) | ||

Tropical Cyclone Alfred existed from March 7 to March 11.
Severe Tropical Cyclone Martin
| Category 3 severe tropical cyclone (Australian scale) | |||
|---|---|---|---|
| Category 1 tropical cyclone (SSHWS) | |||
| |||
| Duration | April 10 – April 15 | ||
| Peak intensity | 120 km/h (75 mph) (10-min) 970 hPa (mbar) | ||

Severe Tropical Cyclone Martin from April 10 to April 15.
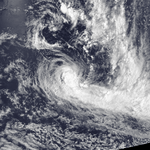
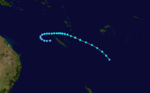
Severe Tropical Cyclone Namu
| Category 3 severe tropical cyclone (Australian scale) | |||
|---|---|---|---|
| Category 2 tropical cyclone (SSHWS) | |||
| |||
| Duration | May 15 – May 22 | ||
| Peak intensity | 150 km/h (90 mph) (10-min) 955 hPa (mbar) | ||
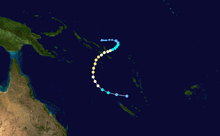
On May 15, TCWC Nadi started to monitor a tropical depression that had developed within the monsoon trough, in association with Typhoon Lola about 90 km (55 mi) to the north of the Solomon Island: Malaita.[4][5] Over the next two days the system moved towards the southeast before it recurved, and started to move towards the southwest during May 17 as it started to show signs that it was developing further.[4] After the system had acquired the characteristics of a tropical cyclone and become equivalent to a tropical storm, the United States Joint Typhoon Warning Center started to issue warnings on the system and designated it as Tropical Cyclone 33P.[6]
Later that day, TCWC Nadi named the depression Namu, after it had become equivalent to a modern-day category-two tropical cyclone on the Australian tropical cyclone intensity scale with ten-minute sustained windspeeds of 155 km/h (100 mph).[4][1][7]
Cyclone Namu was responsible for the deaths of 103 people and caused US$100 million in economic losses in the Solomon Islands.[8] It was considered the worst tropical cyclone to impact the area in five years.[9] The storm was estimated to have caused a maximum wave height of 1.5 m (4.9 ft).[10] Much of the damage caused by Namu was due to phenomenal flooding, and was widespread across the island chain.[9] At Honiara International Airport, 340 mm (13 in) of rain was measured over a three-day period.[10] Increased river flow caused by the depositing of saturated material in rivers was the cause for much of the flood damage that occurred.[10] Of all the islands, Malaita was the worst affected by the cyclone.[11] On the island of Guadalcanal, a single mudslide was responsible for killing 38 villagers.[12] Attaining a clean water supply was an issue on Guadalcanal, and 22% of homes on the island were either damaged or destroyed.[11]
As a result of the havoc caused by the cyclone, approximately 90,000 people, equal to a third of the country's population, were reported as homeless.[9] The government of the Solomon Islands declared a national state of emergency for the entirety of the island chain.[13] The United Kingdom, Papa New Guinea, the United States, and Japan also sent supplies and goods to the Solomon Islands.[9]
Season effects
This table lists all the storms that developed in the South Pacific basin during the 1985–86 season. It includes their intensity on the Australian Tropical cyclone intensity scale, duration, name, areas affected, deaths, and damages. For most storms the data is taken from TCWC Nadi's and or TCWC Wellington's archives, however data for 03P has been taken from the JTWC/NPMOC archives as opposed to TCWC Nadi's or TCWC Wellington's, and thus the winds are over 1-minute as opposed to 10-minutes.
| Name | Dates active | Peak classification | Sustained wind speeds |
Pressure | Land areas affected | Damage (USD) |
Deaths | Refs |
|---|---|---|---|---|---|---|---|---|
| Ima | February 5 –– 16 | Category 4 severe tropical cyclone | 215 km/h (105 mph) | 940 hPa (27.76 inHg) | Cook Islands | None | None | |
| June | February 5 – 10 | Category 2 tropical cyclone | 100 km/h (65 mph) | 980 hPa (28.94 inHg) | None | None | ||
| Keli | February 8 – 14 | Category 1 tropical cyclone | 85 km/h (50 mph) | 987 hPa (29.14 inHg) | None | None | ||
| Lusi | March 2 – 10 | Category 1 tropical cyclone | 75 km/h (45 mph) | 990 hPa (29.24 inHg) | Vanautu | None | None | |
| Alfred | March 7 – 11 | Category 1 tropical cyclone | 75 km/h (45 mph) | 990 hPa (29.24 inHg) | Vanautu | None | None | |
| Martin | April 10 – 15 | Category 3 severe tropical cyclone | 120 km/h (75 mph) | 970 hPa (28.65 inHg) | None | None | ||
| Namu | May 16 – 22 | Category 3 severe tropical cyclone | 150 km/h (90 mph) | 955 hPa (28.20 inHg) | Solomon Islands | $100 million | 103 | |
| Season Aggregates | ||||||||
| 7 systems | February 5 – May 16 | 165 km/h (105 mph) | 940 hPa (27.76 inHg) | >$100 million | 103 | |||
References
- 1 2 3 4 MetService (May 22, 2009). "TCWC Wellington Best Track Data 1967–2006". International Best Track Archive for Climate Stewardship.
- 1 2 Joint Typhoon Warning Center; Naval Pacific Meteorology and Oceanography Center. "Tropical Cyclone 14P Best Track". United States Navy, United States Air Force. Retrieved October 27, 2012.
- ↑ Tropical cyclones in Vanuatu: 1847 to 1994 (PDF) (Report). Vanuatu Meteorological Service. May 19, 1994. Archived from the original on November 18, 2010. Retrieved February 21, 2015.
- 1 2 3 Radford, Deirdre A; Blong, Russell J (1992). Natural Disasters in the Solomon Islands. Volumes 1 and 2 (2 ed.). The Australian International Development Assistance Bureau. pp. 114 – 122. Archived from the original (PDF) on November 18, 2010. Retrieved March 27, 2013.
- ↑ Darwin Regional Specialised Meteorological Centre (1986). "May 1986" (PDF). Darwin Tropical Diagnostic Statement. Australian Bureau of Meteorology. 5 (5): 3. ISSN 1321-4233. Archived (PDF) from the original on March 30, 2013. Retrieved March 30, 2013.
- ↑ Joint Typhoon Warning Center; Naval Western Oceanography Center (1993). 4. Summary of South Pacific and South Indian Tropical Cyclones (PDF) (Annual Tropical Cyclone Report: 1986). United States Navy, United States Airforce. pp. 183 – 190. Archived (PDF) from the original on March 18, 2012. Retrieved March 25, 2013.
- ↑ Tropical Cyclone Namu (Individual Tropical Cyclone Reports). Australian Bureau of Meteorology. 2010. Archived from the original on August 11, 2010. Retrieved March 30, 2013.
- ↑ Berdach, James T.; Llegu, Michelle (December 2007). "Solomon Islands Country Environmental Analysis" (PDF). Asian Development Bank. p. 40. Retrieved 17 August 2012.
- 1 2 3 4 Trustrum, N.A.; Whitehouse, I.E.; Blaschke, P.M.; Stephens, P.R. "Flood and landslide hazard mapping, Solomon Islands" (PDF). International Association of Hydrological Sciences. Retrieved 14 August 2012.
- 1 2 3 Roy, Peter (June 1986). "Geological Impacts of Cyclone Namu on the Costal Plain of Guadalcanal, Solomon Islands - June 1986" (PDF). Secretariat of the Pacific Community's Applied Geoscience and Technology Division. Retrieved 15 August 2012.
- 1 2 Radford, D.A. (1992). "Natural Disasters in the Solomon Islands" (PDF). Sydney, Australia: The Australian International Development Assistance Bureau. pp. 114–122. Archived from the original (PDF) on November 18, 2010. Retrieved 17 August 2012.
- ↑ "Slide ravages Guadalcanal vilalge". They Daily Courier. Port Moresby. United Press International. 22 May 1986. p. 3A. Retrieved 15 August 2012.
- ↑ International Monetary Fund (5 September 1999). "IMF Emergency Assistance Related to Natural Disasters and Postconflict Situations". ReliefWeb. Retrieved 17 August 2012.
External links
- World Meteorological Organization
- Australian Bureau of Meteorology
- Fiji Meteorological Service
- Meteorological Service of New Zealand
- Joint Typhoon Warning Center