Birmingham City Council election, 2015
The 2015 Birmingham City Council election took place on 7 May 2015 to elect members of Birmingham City Council in England. This was on the same day as other local elections, and also the 2015 UK General Election.
In Birmingham the Labour Party went against the trend across the United Kingdom, as they lost the General Election the Labour Party managed to strengthen its hold on Birmingham City Council as well as performing well in the Westminster seats. This is despite the problems facing the Council in the form of the recent Operation Trojan Horse scandal and the Kerslake review, which was highly critical of Birmingham City Council. Albert Bore (Labour Group leader) said the Labour Party did well in Birmingham because it was honest and open with the people of Birmingham and that the people of Birmingham felt they had been unfairly targeted by the Conservative led government.
All results compared to 2012, which is the term that expired in 2015. In 2011 Respect, who did not contest this election, were the main opposition to Labour in a small number of safe seats.
| | |||||||||||||||||||||||||||||||
| |||||||||||||||||||||||||||||||
| |||||||||||||||||||||||||||||||
| |||||||||||||||||||||||||||||||
Result
| Birmingham City Council Election Result 2015 | ||||||||||
|---|---|---|---|---|---|---|---|---|---|---|
| Party | Seats | Gains | Losses | Net gain/loss | Seats % | Votes % | Votes | +/− | ||
| Labour | 29 | +2 | +2 | 70.73 | 46.04 | 199,871 | ||||
| Conservative | 10 | -1 | -1 | 24.39 | 26.88 | 116,680 | ||||
| Liberal Democrat | 2 | -1 | -1 | 4.88 | 10.11 | 43,898 | ||||
| UKIP | 0 | 0 | 0 | 11.44 | 49,673 | |||||
| Green | 0 | 0 | 0 | 4.71 | 20,444 | |||||
| TUSC | 0 | 0 | 0 | 0.37 | 1,619 | |||||
| Independent | 0 | 0 | 0 | 0.36 | 1,549 | |||||
| Socialist Labour | 0 | 0 | 0 | 0.04 | 179 | |||||
| National Health Action | 0 | 0 | 0 | 0.02 | 96 | |||||
| Patriotic Socialist Party | 0 | 0 | 0 | 0.02 | 88 | |||||
| Social Democratic | 0 | 0 | 0 | 0.01 | 46 | |||||
Council Composition
Prior to the election the composition of the council was:
| 77 | 31 | 12 |
| Labour | Conservative | Lib Dem |
After the election, the composition of the council was:
| 79 | 30 | 11 |
| Labour | Conservative | Lib Dem |
- Lib Dem - Liberal Democrats
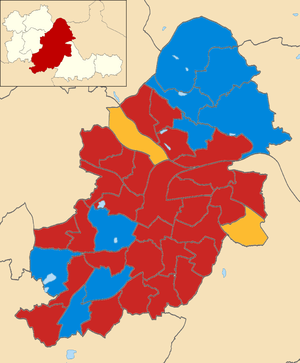
Result by Ward
The electoral division results listed below[1] are based on the changes from the last time this third was up for election, in the 2011 elections,[2] not taking into account any mid-term by-elections or party defections.
Acocks Green
| Party | Candidate | Votes | % | ± | |
|---|---|---|---|---|---|
| Labour | Stewart Charles Stacey* | 4,741 | 44.3 | -3.7 | |
| Liberal Democrat | Penny Wagg | 2,846 | 26.6 | -6.9 | |
| UKIP | Gerry Moynihan | 1,390 | 13.0 | +8.7 | |
| Conservative | Richard John Sparkes | 1,174 | 11.0 | +1.6 | |
| Green | Amanda Caroline Baker | 397 | 3.7 | -0.6 | |
| TUSC | Eamonn Kevin Flynn | 108 | 1.0 | N/A | |
| Social Democratic | Peter Frank Johnson | 46 | 0.4 | N/A | |
| Majority | 1,895 | 17.7 | |||
| Turnout | 10,702 | ||||
| Labour hold | Swing | +1.6 | |||
Aston
| Party | Candidate | Votes | % | ± | |
|---|---|---|---|---|---|
| Labour | Muhammad Afzal* | 8,388 | 83.6 | +21.2 | |
| Conservative | Joel Christopher Buckett | 693 | 6.9 | +2.7 | |
| Liberal Democrat | Rezaul Islam Billah | 479 | 4.8 | -25.1 | |
| Green | Hazel Marjorie Clawley | 474 | 4.7 | +1.8 | |
| Majority | 7,695 | 76.7 | |||
| Turnout | 10,034 | ||||
| Labour hold | Swing | +9.3 | |||
Bartley Green
| Party | Candidate | Votes | % | ± | |
|---|---|---|---|---|---|
| Conservative | John Lines* | 4,553 | 46.7 | -8.4 | |
| Labour | Aaron Mansfield | 3,046 | 31.2 | -1.5 | |
| UKIP | Graham George Short | 1,565 | 16.1 | N/A | |
| Green | Michelle Annette Adams | 373 | 3.8 | +0.5 | |
| Liberal Democrat | Julia Franceska Garrett | 217 | 2.2 | -0.7 | |
| Majority | 1,507 | 15.5 | |||
| Turnout | 9,754 | ||||
| Conservative hold | Swing | -3.5 | |||
Billesley
| Party | Candidate | Votes | % | ± | |
|---|---|---|---|---|---|
| Labour | Susan Elaine Barnett | 4,876 | 44.7 | -3.3 | |
| Conservative | Steve Mee | 2,893 | 26.5 | -10.1 | |
| UKIP | James Martin Dalton | 2,215 | 20.3 | N/A | |
| Green | Cheryl Ann Buxton-Sait | 492 | 4.5 | -0.1 | |
| Liberal Democrat | Emily Rohaise Cox | 441 | 4.0 | -0.4 | |
| Majority | 1,983 | 18.2 | |||
| Turnout | 10,917 | ||||
| Labour hold | Swing | +3.4 | |||
Bordesley Green
| Party | Candidate | Votes | % | ± | |
|---|---|---|---|---|---|
| Labour | Shafique Shah* | 8,357 | 75.2 | +4.5 | |
| Liberal Democrat | Adnan Azam | 1,569 | 14.1 | -3.5 | |
| Conservative | Parveen Hassan | 558 | 5.0 | +2.3 | |
| Green | Alan Clawley | 522 | 5.0 | +3.4 | |
| TUSC | Theo Sharieff | 81 | 0.7 | N/A | |
| Majority | 6,788 | 61.1 | |||
| Turnout | 11,117 | ||||
| Labour hold | Swing | +4.0 | |||
Bournville
| Party | Candidate | Votes | % | ± | |
|---|---|---|---|---|---|
| Conservative | Tim Huxtable* | 5,422 | 40.8 | -1.9 | |
| Labour Co-op | Mary Anne Locke | 4,840 | 36.5 | -3.1 | |
| Green | Ian James Jamieson | 1,297 | 9.8 | +2.1 | |
| UKIP | Steven John Brookes | 1,186 | 8.9 | N/A | |
| Liberal Democrat | Trevor Peter Sword | 536 | 4.0 | -2.8 | |
| Majority | 582 | 4.3 | |||
| Turnout | 13,281 | ||||
| Conservative hold | Swing | +0.6 | |||
Brandwood
| Party | Candidate | Votes | % | ± | |
|---|---|---|---|---|---|
| Labour | Barry Stephen Henley* | 5,381 | 46.3 | -4.4 | |
| Conservative | Neville Anthony Summerfield | 3,385 | 29.1 | -3.1 | |
| UKIP | Alan Blumenthal | 1,699 | 14.6 | N/A | |
| Green | Lizzy Sharman | 679 | 5.8 | +0.1 | |
| Liberal Democrat | Christopher James Forest Burgess | 487 | 4.2 | -2.0 | |
| Majority | 1,996 | 17.2 | |||
| Turnout | 11,631 | ||||
| Labour hold | Swing | -0.6 | |||
Edgbaston
| Party | Candidate | Votes | % | ± | |
|---|---|---|---|---|---|
| Conservative | Matt Bennett | 4,112 | 42.5 | +0.8 | |
| Labour | Tom Keeley | 3,932 | 40.6 | -0.8 | |
| Green | Tom Dalton | 777 | 8.0 | +1.3 | |
| Liberal Democrat | Lee James Dargue | 433 | 4.5 | -3.1 | |
| UKIP | Laura Elizabeth Howard | 426 | 4.4 | +2.1 | |
| Majority | 180 | 1.9 | |||
| Turnout | 9,680 | ||||
| Conservative hold | Swing | +0.6 | |||
Erdington
| Party | Candidate | Votes | % | ± | |
|---|---|---|---|---|---|
| Conservative | Gareth Raymond Moore* | 4,109 | 43.3 | -7.0 | |
| Labour | Keith Alexander Heron | 3,420 | 36.0 | -0.1 | |
| UKIP | Justin Alexander Gayle | 1,215 | 12.8 | N/A | |
| Green | Ulla Barbro Grant | 325 | 3.4 | -0.6 | |
| Liberal Democrat | Philip David Mills | 247 | 2.6 | -2.2 | |
| National Health Action | Krystyna Teresa Mikula-Deegan | 96 | 1.0 | N/A | |
| TUSC | Joe Foster | 83 | 0.9 | N/A | |
| Majority | 689 | 7.3 | |||
| Turnout | 9,495 | ||||
| Conservative hold | Swing | -3.6 | |||
Hall Green
| Party | Candidate | Votes | % | ± | |
|---|---|---|---|---|---|
| Labour | Sam Burden* | 4,994 | 40.4 | -2.3 | |
| Conservative | David William Agar | 2,923 | 23.6 | -9.3 | |
| Liberal Democrat | Paula Denise Smith | 2,029 | 16.4 | -3.5 | |
| Independent | Bob Harvey | 1,003 | 8.1 | N/A | |
| UKIP | Malcolm Thomas Dudley Mummery | 980 | 7.9 | N/A | |
| Green | Rachel Ruana Xerri-Brooks | 390 | 3.2 | -0.8 | |
| TUSC | David Geoffrey Wright | 48 | 0.4 | N/A | |
| Majority | 2,071 | 16.8 | |||
| Turnout | 12,367 | ||||
| Labour hold | Swing | +3.5 | |||
Handsworth Wood
| Party | Candidate | Votes | % | ± | |
|---|---|---|---|---|---|
| Labour | Paulette Adassa Hamilton* | 7,110 | 63.9 | +13.4 | |
| Conservative | Sukhwinder Singh Sungu | 2,393 | 21.5 | -19.4 | |
| UKIP | Harjinder Singh | 597 | 5.4 | N/A | |
| Green | Eric Wyn Fairclough | 457 | 4.1 | +0.4 | |
| Liberal Democrat | Arjun Singh | 393 | 3.5 | -0.9 | |
| Socialist Labour | Shangara Singh Bhatoe | 179 | 1.6 | N/A | |
| Majority | 4,717 | 42.4 | |||
| Turnout | 11,129 | ||||
| Labour hold | Swing | +16.4 | |||
Harborne
| Party | Candidate | Votes | % | ± | |
|---|---|---|---|---|---|
| Labour | James Robert McKay* | 4,922 | 43.0 | -3.6 | |
| Conservative | Jane James | 4,384 | 38.3 | -0.9 | |
| Green | Phil Simpson | 964 | 8.4 | +0.3 | |
| UKIP | Charles Richard Brecknell | 654 | 5.7 | N/A | |
| Liberal Democrat | Philip Andrew Banting | 528 | 4.6 | -0.8 | |
| Majority | 538 | 4.7 | |||
| Turnout | 11,452 | ||||
| Labour hold | Swing | -1.4 | |||
Hodge Hill
| Party | Candidate | Votes | % | ± | |
|---|---|---|---|---|---|
| Labour | Majid Mahmood* | 6,065 | 61.0 | +1.8 | |
| Conservative | Robert Simon Coleman | 1,635 | 16.5 | +7.6 | |
| UKIP | Adrian David Duffen | 1,527 | 15.3 | +10.0 | |
| Liberal Democrat | Waheed Rafiq | 373 | 3.8 | -19.3 | |
| Green | Rhys Bryn Morgan | 266 | 2.7 | +0.7 | |
| TUSC | Marie Emma O'Connor | 68 | 0.7 | N/A | |
| Majority | 4,430 | 44.5 | |||
| Turnout | 9,934 | ||||
| Labour hold | Swing | -2.9 | |||
Kingstanding
| Party | Candidate | Votes | % | ± | |
|---|---|---|---|---|---|
| Labour | Des Hughes | 3,547 | 42.5 | -2.9 | |
| Conservative | Andy Rudge | 2,640 | 31.7 | -10.1 | |
| UKIP | Eric Westacott | 1,761 | 21.1 | N/A | |
| Green | Joe Belcher | 196 | 2.4 | -0.1 | |
| Liberal Democrat | Graham John Lippiatt | 136 | 1.6 | -1.0 | |
| TUSC | Ben Perry | 57 | 0.7 | N/A | |
| Majority | 907 | 10.8 | |||
| Turnout | 8,337 | ||||
| Labour hold | Swing | +3.6 | |||
Kings Norton
| Party | Candidate | Votes | % | ± | |
|---|---|---|---|---|---|
| Labour | Peter James Llewelyn Griffiths* | 3,847 | 39.2 | -6.0 | |
| Conservative | Barbara Iris Wood | 3,727 | 38.0 | -1.7 | |
| UKIP | Tim Plumbe | 1,539 | 15.7 | N/A | |
| Green | Claire Marie Hammond | 413 | 4.2 | +0.1 | |
| Liberal Democrat | Peter James Lloyd | 277 | 2.9 | -1.8 | |
| Majority | 120 | 1.2 | |||
| Turnout | 9,803 | ||||
| Labour hold | Swing | -2.2 | |||
Ladywood
| Party | Candidate | Votes | % | ± | |
|---|---|---|---|---|---|
| Labour | Sir Albert Bore* | 4,764 | 52.0 | -7.7 | |
| Conservative | Tom Skidmore | 2,290 | 25.0 | +3.7 | |
| Green | Chloe Juliette | 999 | 10.9 | +0.1 | |
| UKIP | Matthew Ludford | 576 | 6.3 | N/A | |
| Liberal Democrat | Mohammed Saeed | 527 | 5.8 | -1.6 | |
| Majority | 2,474 | 27.0 | |||
| Turnout | 9,156 | ||||
| Labour hold | Swing | -5.7 | |||
Longbridge
| Party | Candidate | Votes | % | ± | |
|---|---|---|---|---|---|
| Labour | Andy Cartwright* | 4,148 | 38.7 | -7.8 | |
| Conservative | Daniel James Caldicott | 3,576 | 33.4 | -5.2 | |
| UKIP | Kevin Robert Morris | 2,147 | 20.1 | N/A | |
| Green | Aysha Peggy Lynton Turner | 475 | 4.4 | +0.5 | |
| Liberal Democrat | Kevin Francis Hannon | 365 | 3.4 | -1.4 | |
| Majority | 572 | 5.3 | |||
| Turnout | 10,711 | ||||
| Labour hold | Swing | -1.3 | |||
Lozells and East Handsworth
| Party | Candidate | Votes | % | ± | |
|---|---|---|---|---|---|
| Labour | Waseem Zaffar* | 8,535 | 80.7 | +10.3 | |
| Conservative | Ravi Chumber | 977 | 9.2 | +4.5 | |
| Liberal Democrat | Baljinder Kaur | 379 | 3.6 | -15.7 | |
| Green | Ankaret Shakti Harmer | 367 | 3.5 | -1.3 | |
| TUSC | Alistair James Wingate | 312 | 3.0 | N/A | |
| Majority | 7,558 | 71.5 | |||
| Turnout | 10,570 | ||||
| Labour hold | Swing | +2.9 | |||
Moseley and Kings Heath
| Party | Candidate | Votes | % | ± | |
|---|---|---|---|---|---|
| Labour | Martin Gladstone Straker-Welds* | 5,603 | 45.2 | -3.7 | |
| Liberal Democrat | Martin James Paul Mullaney | 2,134 | 17.2 | -9.8 | |
| Conservative | Owen Vaughan Williams | 1,813 | 14.6 | +3.1 | |
| Green | Elly Stanton | 1,666 | 13.5 | +3.9 | |
| Independent | Luke Edward Holland | 546 | 4.4 | N/A | |
| UKIP | Rashpal Mondair | 465 | 3.8 | +1.5 | |
| TUSC | Mike Friel | 165 | 1.3 | N/A | |
| Majority | 3,469 | 28.0 | |||
| Turnout | 12,392 | ||||
| Labour hold | Swing | +3.1 | |||
Nechells
| Party | Candidate | Votes | % | ± | |
|---|---|---|---|---|---|
| Labour | Yvonne Maria Mosquito* | 6,403 | 74.1 | +14.5 | |
| Conservative | John Robert Turner | 964 | 11.2 | +2.0 | |
| Green | Janet Elizabeth Assheton | 611 | 7.1 | +1.1 | |
| Liberal Democrat | Shazad Iqbal | 574 | 6.6 | -17.7 | |
| Patriotic Socialist Party | John McAuliffe | 88 | 1.0 | N/A | |
| Majority | 4,439 | 62.9 | |||
| Turnout | 8,640 | ||||
| Labour hold | Swing | +6.3 | |||
Northfield
| Party | Candidate | Votes | % | ± | |
|---|---|---|---|---|---|
| Conservative | Debbie Clancy | 4,705 | 39.7 | -2.3 | |
| Labour | Robbie Lea-Trengrouse | 4,033 | 34.0 | -7.2 | |
| UKIP | Clair Ann Marie Braund | 2,068 | 17.5 | N/A | |
| Green | Susan Pearce | 517 | 4.4 | -0.9 | |
| Liberal Democrat | Andy Moles | 436 | 3.7 | -1.3 | |
| TUSC | Clive Richard Walder | 78 | 0.7 | N/A | |
| Majority | 672 | 5.7 | |||
| Turnout | 11,837 | ||||
| Conservative hold | Swing | +2.5 | |||
Oscott
| Party | Candidate | Votes | % | ± | |
|---|---|---|---|---|---|
| Labour | Keith William Linnecor* | 4,268 | 42.3 | -15.7 | |
| Conservative | Graham Geoffrey Green | 2,822 | 27.9 | -0.9 | |
| UKIP | Roger David Tempest | 2,382 | 23.6 | N/A | |
| Liberal Democrat | Nick Jolliffe | 285 | 2.8 | -0.8 | |
| Green | Harry Eyles | 253 | 2.5 | -0.4 | |
| TUSC | Brian Kenneth Beddowes | 91 | 0.9 | N/A | |
| Majority | 1,446 | 14.4 | |||
| Turnout | 10,101 | ||||
| Labour hold | Swing | -7.4 | |||
Perry Barr
| Party | Candidate | Votes | % | ± | |
|---|---|---|---|---|---|
| Liberal Democrat | Jon Hunt* | 4,161 | 41.7 | -4.7 | |
| Labour | Sarfraiz Hussain | 3,484 | 34.9 | -5.9 | |
| Conservative | Alain Gregory Keith Hurst | 1,055 | 10.6 | -1.4 | |
| UKIP | Charles Douglas | 1,033 | 10.3 | N/A | |
| Green | Seth Atkin | 246 | 2.5 | N/A | |
| Majority | 677 | 6.8 | |||
| Turnout | 9,979 | ||||
| Liberal Democrat hold | Swing | +0.6 | |||
Quinton
| Party | Candidate | Votes | % | ± | |
|---|---|---|---|---|---|
| Labour | John Michael Clancy* | 4,828 | 44.6 | -5.7 | |
| Conservative | Georgina Chandler | 3,684 | 34.1 | -4.6 | |
| UKIP | Martin Joseph Barrett | 1,423 | 13.1 | N/A | |
| Green | Peter Charles Beck | 491 | 4.5 | +0.8 | |
| Liberal Democrat | Ian Anthony George Garrett | 341 | 3.2 | -1.0 | |
| TUSC | Nick Hart | 55 | 0.5 | N/A | |
| Majority | 1,144 | 10.5 | |||
| Turnout | 10,822 | ||||
| Labour hold | Swing | -0.6 | |||
Selly Oak
| Party | Candidate | Votes | % | ± | |
|---|---|---|---|---|---|
| Labour Co-op | Brigid Jones* | 4,160 | 45.5 | +1.9 | |
| Conservative | Monica Catherine Hardie | 2,225 | 22.7 | +4.8 | |
| Liberal Democrat | Colin Francis Green | 1,484 | 15.2 | -9.9 | |
| Green | Joe Rooney | 1,189 | 12.2 | +3.1 | |
| UKIP | Sylvia Emmeline Tempest-Jones | 602 | 6.2 | +2.8 | |
| TUSC | Keturah Anna Prendergast | 122 | 1.2 | N/A | |
| Majority | 1,935 | 19.8 | |||
| Turnout | 9,782 | ||||
| Labour Co-op hold | Swing | -1.5 | |||
Shard End
| Party | Candidate | Votes | % | ± | |
|---|---|---|---|---|---|
| Labour | Ian Antony Ward* | 3,931 | 45.0 | -10.9 | |
| UKIP | Iain James Albert Roden | 2,594 | 29.7 | +20.7 | |
| Conservative | Suzanne Jane Webb | 1,654 | 18.9 | -1.2 | |
| Liberal Democrat | Christopher Francis Barber | 327 | 3.7 | -0.1 | |
| Green | Christopher Edward Nash | 241 | 2.7 | -0.9 | |
| Majority | 1,337 | 15.3 | |||
| Turnout | 8,747 | ||||
| Labour hold | Swing | -15.8 | |||
Sheldon
| Party | Candidate | Votes | % | ± | |
|---|---|---|---|---|---|
| Liberal Democrat | Paul Calvin Tilsley* | 3,952 | 41.2 | -11.5 | |
| Labour | Bob Collins | 2,247 | 23.4 | -2.3 | |
| UKIP | David Michael Bridges | 1,852 | 19.3 | +13.5 | |
| Conservative | Barry Phillip Theocharides | 1,250 | 13.1 | +4.8 | |
| Green | Lewis Latif Mughal | 189 | 2.0 | +0.5 | |
| TUSC | Mark David Andrews | 97 | 1.0 | N/A | |
| Majority | 1,705 | 17.8 | |||
| Turnout | 9,587 | ||||
| Liberal Democrat hold | Swing | -4.6 | |||
Soho
| Party | Candidate | Votes | % | ± | |
|---|---|---|---|---|---|
| Labour | Sybil Eurlena Spence* | 7,321 | 77.9 | +6.2 | |
| Conservative | Robert John Higginson | 1,091 | 11.6 | +4.6 | |
| Green | Margaret Okole | 505 | 5.4 | +2.1 | |
| Liberal Democrat | Majid Sultan Hussain | 483 | 5.1 | -12.3 | |
| Majority | 6,230 | 66.3 | |||
| Turnout | 9,400 | ||||
| Labour hold | Swing | +0.8 | |||
South Yardley
| Party | Candidate | Votes | % | ± | |
|---|---|---|---|---|---|
| Labour | Nawaz Ali* | 4,682 | 41.6 | -2.7 | |
| Liberal Democrat | Daphne Gaved | 3,790 | 33.6 | -7.8 | |
| UKIP | Graham Michael Duffen | 1,488 | 13.2 | +7.1 | |
| Conservative | Pervez Akhtar | 887 | 7.9 | +3.1 | |
| Green | Paul Daniel Holloway | 322 | 2.8 | -0.1 | |
| TUSC | Siobhan Friel | 98 | 0.9 | N/A | |
| Majority | 892 | 8.0 | |||
| Turnout | 11,267 | ||||
| Labour hold | Swing | +2.6 | |||
Sparkbrook
| Party | Candidate | Votes | % | ± | |
|---|---|---|---|---|---|
| Labour | Tony Kennedy | 8,599 | 77.5 | +28.0 | |
| Liberal Democrat | Seleen Hussein | 1,285 | 11.6 | +5.2 | |
| Conservative | Andrew May | 654 | 5.9 | +3.1 | |
| Green | James Mckears | 553 | 5.0 | +2.8 | |
| Majority | 7,314 | 65.9 | +55.0 | ||
| Turnout | 11,091 | ||||
| Labour hold | Swing | +11.4 | |||
Springfield
| Party | Candidate | Votes | % | ± | |
|---|---|---|---|---|---|
| Labour | Habib Rehman | 7,060 | 61.2 | +7.2 | |
| Liberal Democrat | Tanveer Chouxhry | 2,836 | 24.6 | +1.7 | |
| Conservative | Tom Huxley | 1,129 | 9.8 | +4.0 | |
| Green | Seeyam Brijmohun | 515 | 4.5 | +1.7 | |
| Majority | 4,224 | 36.6 | 5.5 | ||
| Turnout | 11,540 | ||||
| Labour hold | Swing | +2.8 | |||
Stechford and Yardley North
| Party | Candidate | Votes | % | ± | |
|---|---|---|---|---|---|
| Labour | Basharat Dad | 3,567 | 35.6 | 0.0 | |
| Liberal Democrat | Colin Jones | 3,354 | 33.5 | -8.8 | |
| UKIP | Paul Clayton | 1,766 | 17.6 | +8.3 | |
| Conservative | Robert Clark | 982 | 9.8 | +0.1 | |
| Green | Grant Bishop | 269 | 2.7 | +0.4 | |
| TUSC | Laura Cross | 87 | 0.9 | N/A | |
| Majority | 213 | 2.1 | -4.5 | ||
| Turnout | 10,025 | ||||
| Labour gain from Liberal Democrat | Swing | +4.4 | |||
Stockland Green
| Party | Candidate | Votes | % | ± | |
|---|---|---|---|---|---|
| Labour | Mick Finnegan | 4,649 | 54.3 | -0.9 | |
| Conservative | Rachel Toussaint | 2,053 | 24.0 | -5.7 | |
| UKIP | Mike Kemble | 1,061 | 12.4 | N/A | |
| Liberal Democrat | Franklyn Aaron | 414 | 4.8 | -1.8 | |
| Green | Sara Myers | 389 | 4.5 | +0.7 | |
| Majority | 2,596 | 30.3 | +4.9 | ||
| Turnout | 8,566 | ||||
| Labour hold | Swing | +2.4 | |||
Sutton Four Oaks
| Party | Candidate | Votes | % | ± | |
|---|---|---|---|---|---|
| Conservative | Maureen Cornish | 8,393 | 62.0 | -7.9 | |
| Labour | Nick Preston | 1,926 | 14.2 | +0.5 | |
| UKIP | Brendan Padmore | 1,827 | 13.5 | N/A | |
| Liberal Democrat | Hubert Duffy | 803 | 5.9 | -2.2 | |
| Green | David Ratcliff | 596 | 4.4 | -3.2 | |
| Majority | 6,467 | 47.7 | -8.5 | ||
| Turnout | 13,545 | ||||
| Conservative hold | Swing | -4.2 | |||
Sutton New Hall
Due to a by-election the top two candidates were elected.
| Party | Candidate | Votes | % | ± | |
|---|---|---|---|---|---|
| Conservative | David Barrie | 6,889 | |||
| Conservative | Alex Yip | 4,832 | |||
| UKIP | Stuart Connolly | 2,750 | |||
| Labour | Ian Brindley | 2,373 | |||
| Labour | Frank Ray | 1,819 | |||
| Green | Colin Marriott | 891 | |||
| Liberal Democrat | Gareth Hardy | 636 | |||
| Liberal Democrat | Trevor Holtom | 585 | |||
| Majority | |||||
| Turnout | |||||
| Conservative hold | Swing | ||||
| Conservative hold | Swing | ||||
Sutton Trinity
| Party | Candidate | Votes | % | ± | |
|---|---|---|---|---|---|
| Conservative | David Pears | 5,990 | 47.3 | -10.6 | |
| Labour | Roger Barley | 2,699 | 21.3 | -4.7 | |
| UKIP | Marcus Brown | 2,577 | 20.4 | N/A | |
| Liberal Democrat | Sally Lippiatt | 830 | 6.6 | -2.5 | |
| Green | Richard Winter | 565 | 4.5 | -1.8 | |
| Majority | 3,291 | 26.0 | -8.0 | ||
| Turnout | 12,661 | ||||
| Conservative hold | Swing | -3.0 | |||
Sutton Vesey
| Party | Candidate | Votes | % | ± | |
|---|---|---|---|---|---|
| Conservative | Lyn Collin | 5,942 | 46.2 | -2.8 | |
| Labour | Manish Puri | 4,268 | 33.2 | -6.3 | |
| UKIP | Albert Meehan | 1,627 | 12.6 | N/A | |
| Liberal Democrat | Lynn Williams | 569 | 4.4 | -1.1 | |
| Green | Max Ramsay | 464 | 3.6 | N/A | |
| Majority | 1,674 | 13.0 | +3.5 | ||
| Turnout | 12,870 | ||||
| Conservative hold | Swing | +1.8 | |||
Tyburn
| Party | Candidate | Votes | % | ± | |
|---|---|---|---|---|---|
| Labour | Mike Sharpe | 3,720 | 43.6 | -9.2 | |
| Conservative | Cilfton Welch | 2,088 | 24.5 | +2.7 | |
| UKIP | Andrew Garcarz | 1,894 | 22.2 | N/A | |
| Liberal Democrat | Ann Holtom | 550 | 6.5 | -13.8 | |
| Green | Alex Wright | 206 | 2.4 | -1.8 | |
| TUSC | James Redfren | 69 | 0.8 | N/A | |
| Majority | 1,632 | 19.1 | -11.9 | ||
| Turnout | 8,527 | ||||
| Labour hold | Swing | -6.0 | |||
Washwood Heath
| Party | Candidate | Votes | % | ± | |
|---|---|---|---|---|---|
| Labour | Ansar Ali Khan | 9,200 | 78.4 | -10.0 | |
| Liberal Democrat | Shamsur Rehman | 1,395 | 11.9 | +7.4 | |
| Conservative | Cameron Hughes | 615 | 5.2 | +2.4 | |
| Green | John Bentley | 525 | 4.5 | +2.3 | |
| Majority | 7,805 | 66.5 | -17.9 | ||
| Turnout | 11,735 | ||||
| Labour hold | Swing | -8.7 | |||
Weoley
| Party | Candidate | Votes | % | ± | |
|---|---|---|---|---|---|
| Labour | Steve Booton | 4,118 | 40.4 | -1.1 | |
| Conservative | Jayne Freeman | 3,519 | 34.6 | -7.1 | |
| UKIP | Tony Hayes | 1,641 | 16.1 | N/A | |
| Green | Anna Masters | 494 | 4.7 | -0.3 | |
| Liberal Democrat | Steven Haynes | 412 | 4.0 | -2.4 | |
| Majority | 599 | 5.9 | N/A | ||
| Turnout | 10,184 | ||||
| Labour gain from Conservative | Swing | +3.0 | |||
References
- ↑ "2015 Local Election Results". Birmingham City Council. Retrieved 16 February 2016.
- ↑ "Elections Results 2011" (PDF). Birmingham City Council. Retrieved 16 February 2016.