Automated Tropical Cyclone Forecasting System

The Automated Tropical Cyclone Forecasting System (ATCF) is a piece of software originally developed to run on a personal computer for the Joint Typhoon Warning Center (JTWC) in 1988,[1] and the National Hurricane Center (NHC) in 1990. ATCF remains the main piece of forecasting software used for the United States Government, including the JTWC, NHC, and Central Pacific Hurricane Center. Other tropical cyclone centers in Australia and Canada developed similar software in the 1990s. The data files with ATCF lie within three decks, known as the a-, b-, and f-decks. The a-decks include forecast information, the b-decks contain a history of center fixes at synoptic hours, and the f-decks include the various fixes made by various analysis center at various times. In the years since its introduction, it has been adapted to Unix and Linux platforms.
Reason for development
The need for a more modernized method for forecasting tropical cyclones had become apparent by the mid-1980s. At that time Department of Defense was using acetate, grease pencils, and disparate computer programs to forecast tropical cyclones.[1] The ATCF software was developed by the Naval Research Laboratory for the Joint Typhoon Warning Center (JTWC) beginning in 1986,[2] and used since 1988. During 1990 the system was adapted by the National Hurricane Center (NHC) for use at the NHC, National Centers for Environmental Prediction and the Central Pacific Hurricane Center.[2][3] This provided the NHC with a multitasking software environment which allowed them to improve efficiency and cut the time required to make a forecast by 25% or 1 hour.[3] ATCF was originally developed for use within DOS, before later being adapted to Unix and Linux.[2]
Data decks used
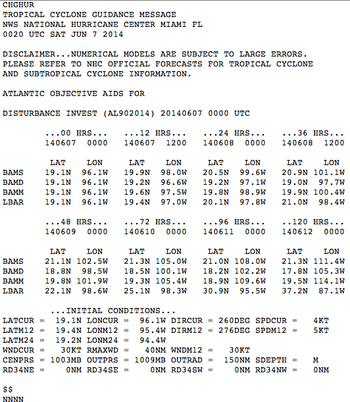
An a-deck is a data file that contains a listing of available forecast aid projections for a storm's history. The real-time guidance system uses a subset of the track and intensity information contained in these files to create the real-time guidance plots. The a-deck name comes from the fact that the filenames start with an "a". Normally, all the model projections are included for the entire lifetime of the storm, so these files can increase to around 1 megabyte in size.[4]
A b-deck is a data file that contains the history of past storms' center locations, intensity, and other parameters at the six hourly synoptic times: 0000, 0600, 1200, and 1800 UTC. The files can contain information outside of synoptic hours, such as the time of landfall. During hurricane season, these files contain the best operational estimates of these parameters, and are known as the operational best tracks. Once the season has completed, the files are updated with revised information after the storm history undergone a careful review by forecasters and other experts. The post-season files are known as the best tracks. The real-time portion of this web site will always feature the operational best tracks (the ones which have not undergone any review).[4]
An f-deck is a data file that contains a record of the fixes of a storm's location and/or intensity. A location fix is any position estimate of the storm center. An intensity fix is any estimate of the storm's intensity. Both location and intensity fixes can be obtained by aircraft flying low-level penetrations through the storm center. Various methods that use satellite imagery or other remote sensing can also provide location and intensity fixes.[4]
System identification
Systems within ATCF are identified with the basin prefix (AL, CP, EP, IO, SH, SL, WP) and then followed by two digit number between 00 and 49 for active tropical cyclones,[5] which becomes incremented with each new system, and then the year associated with the system. Numbers from 50 through 79 after the basin acronym are used internally by the basin's respective Tropical Cyclone Warning Centers and Regional Specialized Meteorological Center.[6] Numbers in the 80s are used for training purposes and can be reused. Numbers in the 90s are used for areas of interest,[7] sometimes referred to as invests or areas of disturbed weather, and are also reused within any particular year. Their status is listed the following ways within the associated data file: DB - disturbance, TD - tropical depression, TS - tropical storm, TY - typhoon, ST - super typhoon, TC - tropical cyclone, HU - hurricane, SD - subtropical depression, SS - subtropical storm, EX - extratropical systems, IN - inland, DS - dissipating, LO - low, WV - tropical wave, ET - extrapolated, and XX - unknown. Times used are in a four digit year, month, day, and hour format.[5]
Similar software used elsewhere
In the 1990s, other countries developed similar tropical cyclone forecasting software. The Bureau of Meteorology in Australia developed the Australian Tropical Cyclone Workstation. The Canadian Hurricane Centre developed Canadian Hurricane Centre Forecaster's Workstation.[2]
References
- 1 2 Ronald J. Miller; Ann J. Schrader; Charles R. Sampson & Ted L. Tsui (December 1990). "The Automated Tropical Cyclone Forecasting System (ATCF)". Weather and Forecasting. American Meteorological Society. 5: 653–600. Bibcode:1990WtFor...5..653M. doi:10.1175/1520-0434(1990)005<0653:TATCFS>2.0.CO;2.
- 1 2 3 4 Sampson, Charles R; Schrader, Ann J (June 2000). "The Automated Tropical Cyclone Forecasting System (Version 3.2)". Bulletin of the American Meteorological Society. American Meteorological Society. 81 (6): 1231–1240. Bibcode:2000BAMS...81.1231S. doi:10.1175/1520-0477(2000)081<1231:tatcfs>2.3.co;2.
- 1 2 Rappaport, Edward N; Franklin, James L; Avila, Lixion A; Baig, Stephen R; Beven II, John L; Blake, Eric S; Burr, Christopher A; Jiing, Jiann-Gwo; Juckins, Christopher A; Knabb, Richard D; Landsea, Christopher W; Mainelli, Michelle; Mayfield, Max; McAdie, Colin J; Pasch, Richard J; Sisko, Christopher; Stewart, Stacy R; Tribble, Ahsha N (April 2009). "Advances and Challenges at the National Hurricane Center". Weather and Forecasting. 24 (2): 409. Bibcode:2009WtFor..24..395R. doi:10.1175/2008WAF2222128.1.
- 1 2 3 Jonathan Vigh (2013). "Tropical Cyclone Guidance Project". University Center for Atmospheric Research. Retrieved 2013-08-29.
- ↑ Office of the Federal Coordinator for Meteorology (2007). "61st Interdepartmental Hurricane Conference Action Items" (PDF). Internet Archive Wayback Machine. p. 14. Archived from the original (PDF) on November 29, 2007. Retrieved 2014-05-20.
- ↑ Michael J. Brennan (2013-05-18). "Automated Tropical Cyclone Forecast (ATCF) Data Files / Text Files". National Hurricane Center.