1993 North Indian Ocean cyclone season
1993 North Indian Ocean cyclone season
| |
| Season summary map |
| First system formed |
June 17, 1993 |
| Last system dissipated |
December 20, 1993 |
| Strongest storm1 |
BOB 03 – 968 hPa (mbar), 165 km/h (105 mph) (3-minute sustained) |
| Depressions |
5 |
| Deep depressions |
4 |
| Cyclonic storms |
2 |
| Severe cyclonic storms |
2 |
| Very severe cyclonic storms |
2 |
| Total fatalities |
Unknown |
| Total damage |
Unknown |
| 1Strongest storm is determined by lowest pressure |
North Indian Ocean tropical cyclone seasons
1991, 1992, 1993, 1994, 1995 |
The 1993 North Indian Ocean cyclone season was the period in which tropical cyclones formed within the north Indian ocean. The season has no official bounds but cyclones tend to form within this basin between April and December. There are two main seas in the North Indian Ocean — the Bay of Bengal to the east of the Indian subcontinent and the Arabian Sea to the west of India. The official Regional Specialized Meteorological Centre in this basin is the India Meteorological Department (IMD), while the Joint Typhoon Warning Center releases unofficial advisories. An average of four to six storms form in the North Indian Ocean every season with peaks in May and November. Cyclones occurring between the meridans 45°E and 100°E are included in the season by the IMD.
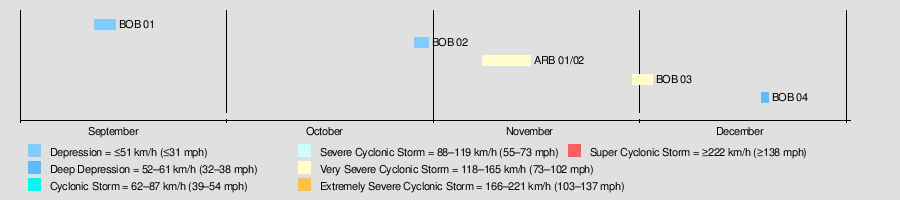
Season summary
A below average total of five cyclonic disturbances were monitored during 1993, by the India Meteorological Department (IMD) and Joint Typhoon Warning Center (JTWC), compared to an average of fifteen.[nb 1]
Storms
Deep Depression
| Deep depression (IMD) |
|
|
| Duration |
June 17 – June 19 |
| Peak intensity |
55 km/h (35 mph) (3-min) 1001 hPa (mbar) |
Depression ARB 01
| Deep depression (IMD) |
|
|
| Duration |
June 17 – June 19 |
| Peak intensity |
55 km/h (35 mph) (3-min) 1001 hPa (mbar) |
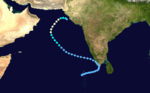
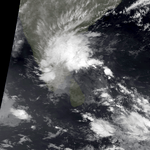
Very Severe Cyclonic Storm ARB 02
| Very severe cyclonic storm (IMD) |
| Category 1 tropical cyclone (SSHWS) |
|
|
| Duration |
November 8 – November 16 |
| Peak intensity |
120 km/h (75 mph) (3-min) 986 hPa (mbar) |
On November 5, an area of convection organized into a tropical depression southwest of the southern tip of India. After moving towards the coast, it turned to the west, finally becoming a tropical storm on the 12th when it reached a favorable environment. After attaining cyclone strength on the 13th, it reached a peak of 90 mph winds. High vertical shear caused it to dissipate on the 16th over open waters.
A category 1 hurricane, it weakened over the sea near Sindh border due to high wind shear. However it caused massive rainfall and flooding in Karachi, Pakistan but Thatta and Badin districts were the worst affected where the cyclone killed 609 people and displaced some 200,000 others.[1][2]
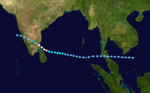
Extremely Severe Cyclonic Storm BOB 03
| Extremely severe cyclonic storm (IMD) |
| Category 1 tropical cyclone (SSHWS) |
|
|
| Duration |
December 1 (entered basin) – December 4 |
| Peak intensity |
165 km/h (105 mph) (3-min) 968 hPa (mbar) |
A disturbance over the South China Sea developed into a tropical depression on November 27. It crossed the Malay Peninsula, slowly organizing into a tropical storm on the 1st. The storm continued westward, became a cyclone on the 3rd, and hit eastern India on the 4th. Cyclone Two weakened as it crossed the country, and dissipated on the 5th over the Arabian Sea.
Deep Depression BOB 04
On December 16, the remnant low of Typhoon Manny entered the Indian Ocean. The weak low pressure area regenerated into Deep Depression BOB 04.
Season effects
Notes
- ↑ On average fifteen cyclonic disturbances develop during the year.
See also
References
External links