Österforse
| Österforse | |
|---|---|
 Österforse 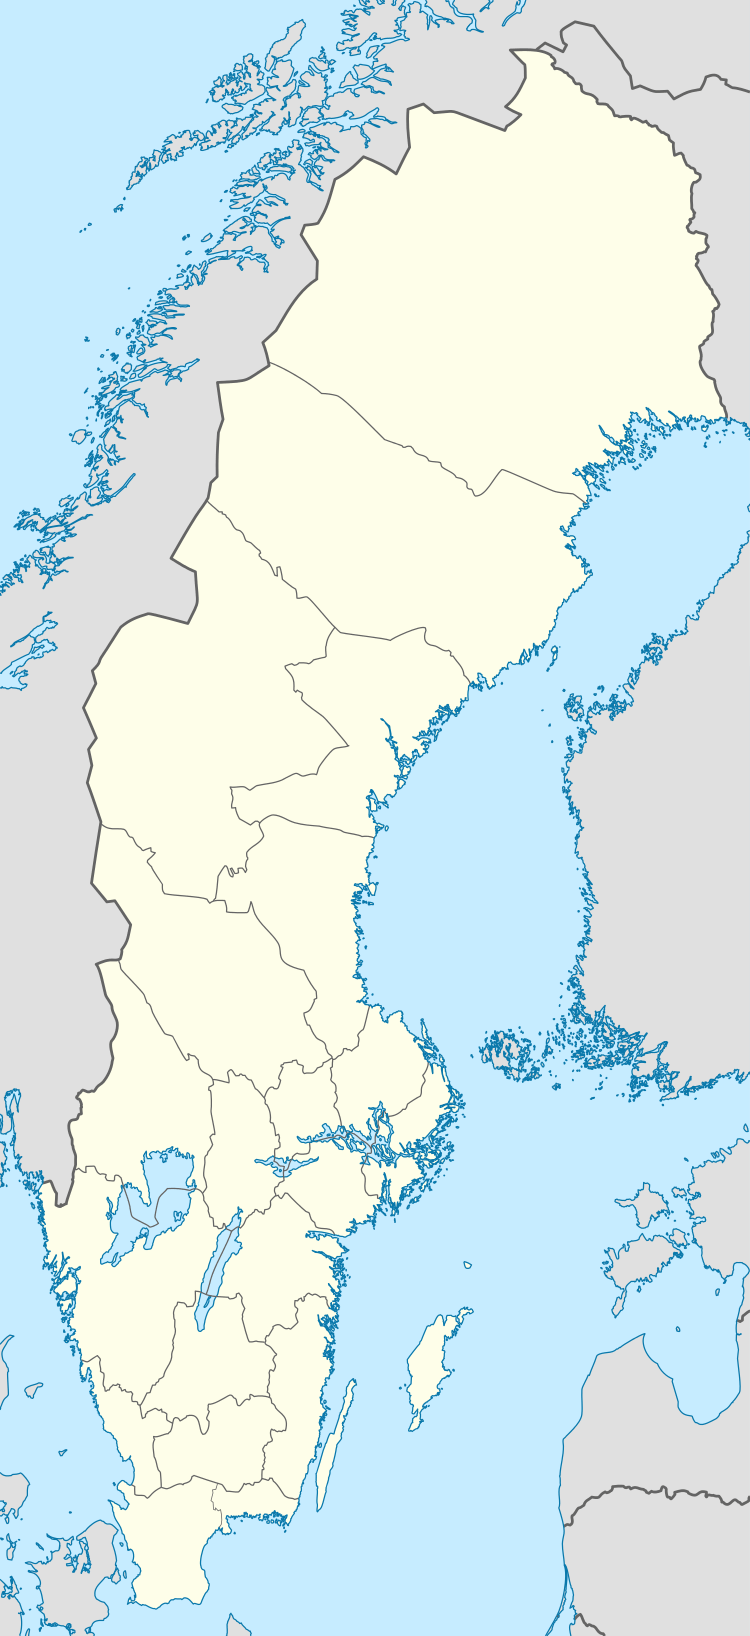 Österforse | |
| Coordinates: 63°09′N 17°01′E / 63.150°N 17.017°ECoordinates: 63°09′N 17°01′E / 63.150°N 17.017°E | |
| Country | Sweden |
| Province | Ångermanland |
| County | Västernorrland County |
| Municipality | Sollefteå Municipality |
| Area[1] | |
| • Total | 0.90 km2 (0.35 sq mi) |
| Population (31 December 2010)[1] | |
| • Total | 204 |
| • Density | 227/km2 (590/sq mi) |
| Time zone | CET (UTC+1) |
| • Summer (DST) | CEST (UTC+2) |
Österforse is a locality situated in Sollefteå Municipality, Västernorrland County, Sweden with 204 inhabitants in 2010.[1]
Climate
Österforse has a subarctic climate that is quite moderate in nature considering its inland position and latitude. Summer days are very warm for North Central Sweden, being heavily affected by its low elevation in comparison to areas further west such as Östersund. Temperatures are heavily dependent on wind direction and the convergences of warm southerly and cold northerly air. As a result, cold snaps can be quite extreme, resulting in an all-time low of −43 °C (−45 °F). The all-time heat record is from July 2, 2015 with 32.8 °C (91.0 °F) in an otherwise chilly summer.[2]
| Climate data for Österforse (2002-2015); precipitation 1961-1990; extremes since 1901 | |||||||||||||
|---|---|---|---|---|---|---|---|---|---|---|---|---|---|
| Month | Jan | Feb | Mar | Apr | May | Jun | Jul | Aug | Sep | Oct | Nov | Dec | Year |
| Record high °C (°F) | 10.1 (50.2) |
12.3 (54.1) |
17.0 (62.6) |
23.0 (73.4) |
28.7 (83.7) |
31.3 (88.3) |
32.8 (91) |
30.8 (87.4) |
27.6 (81.7) |
19.7 (67.5) |
12.1 (53.8) |
10.4 (50.7) |
32.8 (91) |
| Average high °C (°F) | −4.1 (24.6) |
−2.4 (27.7) |
3.4 (38.1) |
9.5 (49.1) |
15.2 (59.4) |
19.4 (66.9) |
22.4 (72.3) |
20.5 (68.9) |
14.9 (58.8) |
7.2 (45) |
1.2 (34.2) |
−2.1 (28.2) |
8.8 (47.8) |
| Daily mean °C (°F) | −8.1 (17.4) |
−6.7 (19.9) |
−1.9 (28.6) |
3.6 (38.5) |
8.7 (47.7) |
12.4 (54.3) |
16.1 (61) |
14.5 (58.1) |
9.7 (49.5) |
3.2 (37.8) |
−1.7 (28.9) |
−5.8 (21.6) |
3.6 (38.5) |
| Average low °C (°F) | −12.0 (10.4) |
−11.1 (12) |
−7.3 (18.9) |
−2.2 (28) |
2.1 (35.8) |
6.3 (43.3) |
9.8 (49.6) |
8.6 (47.5) |
4.5 (40.1) |
−0.7 (30.7) |
−4.6 (23.7) |
−9.5 (14.9) |
−1.3 (29.7) |
| Record low °C (°F) | −43.0 (−45.4) |
−42.5 (−44.5) |
−31.4 (−24.5) |
−18.0 (−0.4) |
−7.8 (18) |
−2.5 (27.5) |
−0.2 (31.6) |
−2.2 (28) |
−9.8 (14.4) |
−19.8 (−3.6) |
−30.0 (−22) |
−40.0 (−40) |
−43.0 (−45.4) |
| Average precipitation mm (inches) | 32.7 (1.287) |
25.2 (0.992) |
28.1 (1.106) |
28.6 (1.126) |
37.4 (1.472) |
51.7 (2.035) |
76.9 (3.028) |
67.6 (2.661) |
60.7 (2.39) |
44.4 (1.748) |
44.1 (1.736) |
40.9 (1.61) |
538.2 (21.189) |
| Source #1: SMHI precipitation average 1961-1990[3] | |||||||||||||
| Source #2: SMHI climate data 2002-2015[4] | |||||||||||||
References
- 1 2 3 "Tätorternas landareal, folkmängd och invånare per km2 2005 och 2010" (in Swedish). Statistics Sweden. 14 December 2011. Archived from the original on 10 January 2012. Retrieved 10 January 2012.
- ↑ "July 2015 Temperature & Wind" (PDF) (in Swedish). SMHI. Retrieved 6 August 2016.
- ↑ "SMHI precipitation average 1961-1990" (in Swedish). Swedish Metereological and Hydrological Institute (Forse code 13 708).
- ↑ "SMHI climate data 2002-2015" (in Swedish). SMHI. 6 August 2016.
This article is issued from Wikipedia - version of the 8/7/2016. The text is available under the Creative Commons Attribution/Share Alike but additional terms may apply for the media files.