Y-DNA haplogroups by populations of Sub-Saharan Africa
Listed here are the human Y-chromosome DNA haplogroups found in various ethnic groups and populations from Sub-Saharan Africa. Based on relevant studies, the samples are taken from individuals identified by linguistic designation (AA=Afroasiatic, KS=Khoisan, NS=Nilo-Saharan and NC=Niger–Congo). The table below's third column gives the total sample size studied, and the other columns indicate the percentage observed of the particular haplogroup.
| Population | Language group | n | A | B | E1a | E1b1a | E1b1b | E2 | J | R1b | T | Reference |
|---|---|---|---|---|---|---|---|---|---|---|---|---|
| Afro-Asiatic[nb 1] | Afro-Asiatic (AA) | 236 | 5.5 | 3.8 | 0.4 | 3.3 | 34.8 | 0.8 | 19.5 | 20.8 | 3.8 | Wood 2005[1] |
| Alur | Nilotic (NS) | 9 | 22 | 0 | 0 | 11 | 0 | 67 | 0 | 0 | 0 | Wood 2005[1] |
| Amhara (Ethiopia) | Semitic (AA) | 48 | 14.6 | 2.1 | 0 | - | 35.4 | 0 | 33.3 | 0 | 4.2 | Hassan 2008[2] |
| Bamileke | Bantoid (NC) | 85 | 0 | 0 | 0 | 100 | 0 | 0 | 0 | 0 | 0 | Luis 2004[3] |
| Bantus (Gabon) | Bantu (NC) | 795 | 0.5 | 6.7 | 0.2 | 79.4 | 0.1 | 6.2 | 0 | 5.5 | 0 | Berniell 2009[4] |
| Bantus (Kenya) | Bantu (NC) | 29 | 13.8 | 3.4 | 0 | 51.7 | 13.7 | 17.2 | 0 | 0 | 0 | Hurles 2005[5] |
| Bantus (Tanzania)[nb 2] | Bantu (NC) | 110 | 2.7 | 9.1 | - | 48.2 | 21.8 | 16.4 | 0 | 0 | 1.8 | [3][6] |
| Bantus (South Africa)[nb 3] | Southern Bantu (NC) | 137 | 5.1 | 10.9 | 0 | 54.7 | 4.4 | 21.2 | 0 | 0 | 0 | Wood 2005[1] |
| Bantus (South-Eastern) | Bantu (NC) | 343 | 5.0 | 16.3 | -- | 66.2 | 1.5 | 10.2 | -- | 0 | -- | Naidoo 2010[7] |
| Beja | Cushitic (AA) | 42 | 4.8 | 0 | 0 | 0 | 52.4 | 0 | 38.1 | 4.8 | 0 | Hassan 2008[2] |
| Benin (Fon) | Gbe (NC) | 100 | 0 | 0 | 0 | 95 | 0 | 5 | 0 | 0 | 0 | Luis 2004[3] |
| Berbers | Berber (AA) | 64 | 3 | 0 | 2 | 5 | 80 | 0 | 6 | 0 | 0 | Cruciani2002[8] |
| Burkina Faso[nb 4] | Niger–Congo (NC) | 106 | 0 | 0.9 | 3.8 | 81.1 | 2.8 | 11.3 | 0 | 0 | 0 | Cruciani2002[8] |
| Burunge | Cushitic (AA) | 24 | 0 | 25 | -- | 4 | 33 | -- | -- | -- | -- | Tishkoff 2007[6] |
| Cameroon (North)[nb 5] | Adamawa (NC) | 72 | 1.4 | 12.5 | 4.2 | 54.2 | 0 | 0 | 0 | 27.8 | 0 | Cruciani2002[8] |
| Cameroon (North)[nb 6] | Chadic (AA) | 54 | 1.8 | 3.7 | 0 | 13.0 | 3.7 | 7.4 | 0 | 70.4 | 0 | Cruciani2002[8] |
| Cameroon (South)[nb 7] | Bantoid (NC) | 89 | 0 | 5.6 | 0 | 93.3 | 0 | 0 | 0 | 1.1 | 0 | Cruciani2002[8] |
| R.D. Congo (East)[nb 8] | Bantu (NC) | 36 | 2.8 | 0 | 0 | 63.9 | 13.9 | 19.4 | 0 | 0 | 0 | Wood 2005[1] |
| Copts (Sudanese) | Arabic (AA) | 33 | 0 | 15.2 | 0 | 0 | 21.2 | 0 | 45.5 | 15.2 | - | Hassan 2008[2] |
| Cross River (Nigeria) | Cross River (NC) | 1113 | 0 | -- | -- | 87 | -- | -- | 0 | 0 | 0 | Veeramah2010[9] |
| Datog | Nilotic (NS) | 35 | 3 | 3 | -- | 11 | 54 | -- | -- | -- | -- | Tishkoff 2007[6] |
| Dinka | Nilotic (NS) | 26 | 62 | 23 | 0 | 0 | 15 | 0 | 0 | 0 | 0 | Hassan 2008[2] |
| Dogon | Dogon (NC) | 55 | 1.8 | 7.3 | 45.5 | 43.6 | 0 | 1.8 | 0 | 0 | 0 | Wood 2005[1] |
| Ethiopians | Afro-Asiatic (AA) | 242 | 17.8 | 0.8 | 0 | - | 48.8 | 0.4 | 26.9 | 0 | 3.7 | Moran 2004[10] |
| Ethiopian Jews | Cushitic (AA) | 22 | 41 | 0 | 0 | 0 | 50 | 0 | 5 | 0 | 5 | Cruciani2002[8] |
| Fulbe[nb 9] | Senegambian (NC) | 37 | 5.4 | 0 | 29.7 | 48.6 | -- | 0 | 0 | -- | 8.1 | Cruciani2002[8] |
| Fulbe (Sudan) | Senegambian (NC) | 26 | 0 | 0 | 0 | 0 | 34.6 | 0 | 0 | 53.8 | 0 | Hassan 2008[2] |
| Fulbe (Nigeria) | Senegambian (NC) | 21 | - | - | - | - | - | - | - | 0 | - | Cruciani2010[11] |
| Fur | Fur (NS) | 32 | 31.3 | 3.1 | 0 | 0 | 59.4 | 0 | 6.3 | 0 | 0 | Hassan 2008[2] |
| Ghana[nb 10] | Kwa (NC) | 91 | 0 | 0 | 2.2 | 92.3 | 1.1 | 0 | 0 | 1.1 | 0 | Wood 2005[1] |
| Hadza | Hadza (Isolate/KS) | 80 | 0 | 57.5 | - | 26.2 | 15.0 | - | - | - | - | Tishkoff 2007[6] |
| Hausa (Sudan) | Chadic (AA) | 32 | 12.5 | 15.6 | 0 | 12.5 | 3.1 | 0 | 0 | 40.6 | 0 | Hassan 2008[2] |
| Hema | Northeast Bantu (NC) | 18 | 6 | 0 | 2.2 | 28 | 28 | 39 | 0 | 0 | 0 | Wood 2005[1] |
| Hutu (Rwanda) | Northeast Bantu (NC) | 69 | 0 | 4 | 0 | 83 | 3 | 8 | 0 | 1 | 0 | Luis 2004[3] |
| Igbo[nb 11] | Volta–Niger (NC) | 209 | A3b2=0 | - | - | 89.3 | - | - | 0 | - | 0 | Veeramah 2010[9] |
| Iraqw | Cushitic (AA) | 9 | 0 | 22 | 0 | 11 | 56 | 0 | 0 | 0 | 0 | Wood 2005[1] |
| Khoisan[nb 12] | Khoisan (KS) | 90 | 47.7 | 14.4 | 0 | 24.4 | 6.7 | 2.2 | 1.1 | 0 | 0 | Wood 2005[1] |
| Khoisan | Khoisan (KS) | 183 | 44.3 | 11.5 | 0 | 23.0 | 16.4 | 1.6 | 0 | 1.6 | 0 | Naidoo 2010[7] |
| Khoisan (South Africa)[nb 13] | Khoisan (KS) | 129 | 33.3 | 12.4 | 0 | 35.7 | 14.7 | 3.9 | 0 | 0 | 0 | Tishkoff 2007[6] |
| Kikuyu & Kamba | Northeast Bantu (NC) | 42 | 2 | 2 | 0 | 73 | 19 | 0 | 0 | 0 | 0 | Wood 2005[1] |
| ǃKung | Northern Khoisan (KS) | 64 | 36 | 8 | 0 | 39 | 11 | 6 | 0 | 0 | 0 | Cruciani2002[8] |
| Luo | Nilotic (NS) | 9 | 11 | 22 | 0 | 66 | 0 | 0 | 0 | 0 | 0 | Wood 2005[1] |
| Maasai | Nilotic (NS) | 26 | 27 | 8 | 0 | 16 | 50 | 0 | 0 | 0 | 0 | Wood 2005[1] |
| Malagasy | Malayo-Polynesian | 35 | 0 | 8.6 | 0 | 34.3 | 0 | 8.6 | 5.7 | - | 0 | O=34.3%[5] |
| Mandinka | Mande (NC) | 39 | 5 | 3 | 3 | 79 | 8 | 3 | 0 | 0 | 0 | Wood 2005[1] |
| Masalit | Maban (NS) | 32 | 18.8 | 3.1 | 0 | 0 | 71.9 | 0 | 6.3 | 0 | 0 | Hassan 2008[2] |
| Mossi | Gur (NC) | 49 | 0 | 2 | -- | 90 | 2 | -- | -- | -- | -- | Tishkoff 2007[6] |
| Namibia (Nama) | Khoikhoi (KS) | 11 | 64 | 0 | 0 | 18 | 9 | 0 | 0 | - | 0 | Wood 2005[1] |
| Nande | Northeast Bantu (NC) | 18 | 0 | 0 | 0 | 100 | 0 | 0 | 0 | 0 | 0 | Wood 2005[1] |
| Niger–Congo[nb 14] | Niger–Congo (NC) | 705 | 2.7 | 9.6 | 4.5 | 68.2 | 3.9 | 6.9 | 0.1 | 1.4 | 0 | Wood 2005[1] |
| Nilo-Saharan[nb 15] | Nilo-Saharan | 91 | 12.1 | 35.2 | 0 | 29.7 | 14.3 | 8.8 | 0 | 0 | 0 | Wood 2005[1] |
| Nilo-Saharan[nb 16] | Nilo-Saharan | 345 | 23.2 | 17.4 | -- | 9.9 | 33.9 | 2.6 | 6.1 | -- | -- | See [nb 17] |
| Nubians | Nubian(NS), Arabic(AA) | 39 | 0 | 7.7 | 0 | 0 | 23.1 | 0 | 43.6 | 10.3 | 0 | Hassan 2008[2] |
| Nuba | Nuba (NS) | 28 | 46.4 | 14.3 | 0 | 0 | 39.3 | 0 | 0 | 0 | 0 | Hassan 2008[2] |
| Nuer | Nilotic (NS) | 12 | 33.3 | 50 | 0 | 0 | 16.7 | 0 | 0 | 0 | 0 | Hassan 2008[2] |
| Oromo (Ethiopia) | Cushitic (AA) | 78 | 10.3 | 1.3 | 0 | - | 62.8 | 1.3 | 3.8 | 0 | 5.1 | Hassan 2008[2] |
| Ouldeme | Chadic (AA) | 13 | - | - | - | - | - | - | - | 95.5 | - | Cruciani2010[11] |
| Pygmy (Mbuti) | Central Sudanic (NS) | 47 | 2 | 59 | 0 | 34 | 0 | 4 | 0 | 0 | 0 | Wood 2005[1] |
| Pygmy (Western)[nb 18] | Niger–Congo (NC) | 60 | 5 | 53.3 | - | 28.3 | 0 | - | 0 | 3.3 | 0 | Berniell 2009[4] |
| Sandawe | Sandawe (tentative/KS) | 68 | 4 | 14 | - | 43 | 34 | - | - | - | - | Tishkoff 2007[6] |
| Senegalese | Niger–Congo (NC) | 139 | 0 | 0 | 5.0 | 81.3 | 6.5 | 2.9 | 0 | 0 | 0 | Hassan 2008[2] |
| Shilluk | Nilotic (NS) | 15 | 53.3 | 26.7 | 0 | 0 | 20 | 0 | 0 | 0 | 0 | Hassan 2008[2] |
| Shuwa Arabs | Arabic (AA) | 5 | - | - | - | - | - | - | - | 40 | - | Cruciani2010[11] |
| Somalis | Cushitic (AA) | 201 | 0.5 | 1.0 | 0 | 1.5 | 81.1 | 0.5 | 3.0 | R1a=1 | 10.4 | Sanchez2005[12] |
| South African Whites | Indo-European | 157 | 0 | 0 | 0.6 | 0.6 | 9.6 | 0 | 3.8 | 51.6 | -- | Others=33.8[7] |
| Sudan (Arabs)[nb 19] | Semitic (AA) | 102 | 2.9 | 0 | 0 | 0 | 16.7 | 0 | 47.1 | 15.7 | 0 | Hassan 2008[2] |
| South Sudan (Nilotic)[nb 20] | Nilotic (NS) | 81 | 50.6 | 24.7 | 0 | 0 | 24.7 | 0 | 0 | - | 0 | Hassan 2008[2] |
| West Sudan (Darfur)[nb 21] | Nilo-Saharan (NS) | 90 | 27.8 | 2.2 | 0 | 0 | 62.2 | 0 | 4.4 | - | 0 | Hassan 2008[2] |
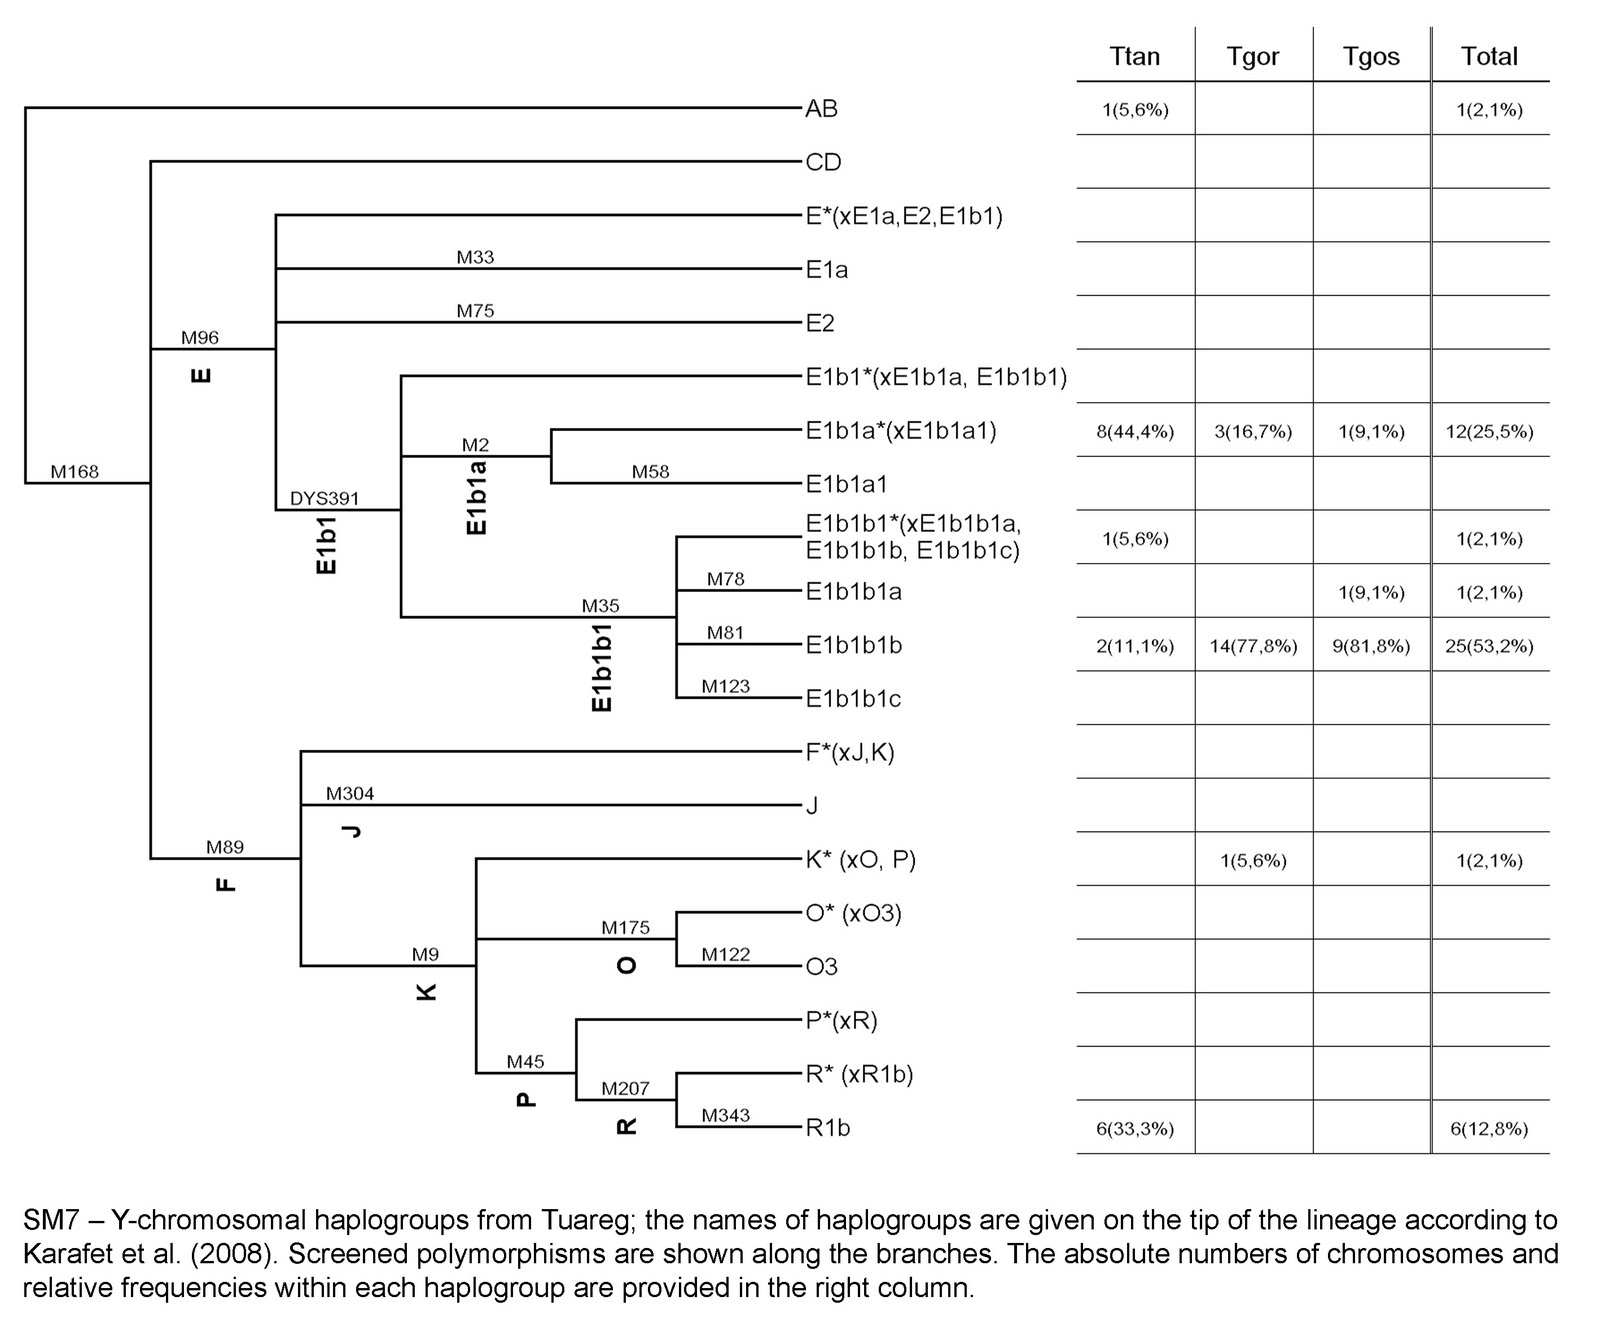
| Tuareg (Burkina Faso)[nb 22] | Tuareg (AA) | 38 | - | - | 0 | 16.7 | 77.8 | 0 | - | 0 | - | Pereira 2010[13] |
| Tuareg (Mali)[nb 23] | Tuareg (AA) | 21 | - | - | 0 | 9.1 | 90.9 | 0 | - | 0 | - | Pereira 2010[13] |
| Tuareg (Niger)[nb 24] | Tuareg (AA) | 31 | - | - | 0 | 44.4 | 16.7 | 0 | - | 33.3 | - | Pereira 2010[13] |
| Tutsi (Rwanda) | Northeast Bantu (NC) | 94 | 0 | 15 | 0 | 80 | 1 | 4 | 0 | 0 | 0 | Luis 2004[3] |
| Wolof | Senegambian (NC) | 34 | 0 | 0 | 12.0 | 68.0 | 12.0 | 3.0 | 0 | 0 | - | Wood 2005[1] |
| Yoruba | Volta–Niger (NC) | 13 | 0 | 8 | 0 | 92 | 0 | 0 | 0 | 0 | 0 | Tishkoff 2007[6] |
| Xhosa | Southern Bantu (NC) | 80 | 5 | 5 | 0 | 54 | 5 | 28 | 0 | 0 | 0 | Wood 2005[1] |
| Zulu | Southern Bantu (NC) | 29 | 3 | 20 | 0 | 55 | 0 | 21 | 0 | 0 | 0 | Wood 2005[1] |
See also
- Africa
- Y-DNA haplogroups by groups
- Y-DNA haplogroups by populations of Near East and North Africa
- Y-DNA haplogroups in European populations
- Y-DNA haplogroups by populations of the Caucasus
- Y-DNA haplogroups in South Asian populations
- Y-DNA haplogroups by populations of East and Southeast Asia
- Y-DNA haplogroups in Oceanian populations
- Y-DNA haplogroups in Central and North Asian populations
- Y-DNA haplogroups in Indigenous peoples of the Americas
Notes
- ↑ Afroasiatic from: Ethiopia, Cameroon, Egypt, Tunisia.
- ↑ Tanzania: Turu, Mbugwe, Wairak, Sukuma.
- ↑ South Africa: Sotho–Tswana, Xhosa, Zulu.
- ↑ Burkina Faso ethnic groups: Mossi, Rimaibe, Fulbe.
- ↑ Adamawa Cameroon: Fali, Tali, mixed.
- ↑ Chadic Cameroon: Ouldeme, Daba, mixed.
- ↑ Southern Cameroon: Bamileke, Ewondo, Bakaka.
- ↑ RDC: Nande, Hema.
- ↑ Fulbe from Burkina Faso and Cameroon.
- ↑ Ghana: Ewe, Ga, Fante.
- ↑ Calculated by averaging the haplogroup frequencies of the IG-C (Calabar), IG-E (Enugu) and IG-N (Nenwe) Igbo samples (see Table 1) in Table 4.
- ↑ Khoisan: !Kung/Sekele, Tsumkwe San, Dama, Nama.
- ↑ Khoisan from South Africa: Khwe, !Kung, and mixed.
- ↑ Niger–Congo from: Gambia, Senegal, Mali, Ghana, Cameroon, CAR, DRC, Tanzania, Kenya, Uganda, Namibia, South Africa, and Zimbabwe.
- ↑ Nilo-Saharan: Alur, Mbuti (R.D.Congo), Massai, Luo (Kenya). Clade was exclusively carried by the Maasai amongst the Nilo-Saharan speakers - Appendix A
- ↑ Nilo-Saharan: 14 populations from R.D.Congo, Kenya, Sudan, Tanzania and Cameroon
- ↑ Nilo-Saharans in Wood 2005, Hassan 2008, Tishkoff 2007 and Cruciani 2002
- ↑ Pygmies: Baka, Bakola.
- ↑ Northern Sudan: Gaalien, Meseria, Arakien.
- ↑ South Sudan: Dinka, Shilluk, Nuer.
- ↑ Western Sudan: Fur, Masalit, Borgu. Clade introduced from North Africa. High frequencies likely due to a population bottleneck.
- ↑ Tgor: Tuareg from Burkina Faso, around the village of Gorom-Gorom.
- ↑ Tgos: Tuareg from Mali, near Gossi.
- ↑ Ttan: Tuareg from Niger, in the vicinity of Tanut.
References
- 1 2 3 4 5 6 7 8 9 10 11 12 13 14 15 16 17 18 19 20 21 Wood, Elizabeth T et al 2005 Contrasting patterns of Y chromosome and mtDNA variation in Africa: evidence for sex-biased demographic processes; also Appendix A
- 1 2 3 4 5 6 7 8 9 10 11 12 13 14 15 16 17 Hassan, Hisham Y. et al. 2008 Y-Chromosome Variation Among Sudanese: Restricted Gene Flow, Concordance With Language, Geography, and History
- 1 2 3 4 5 J. R. Luis et al 2004, The Levant versus the Horn of Africa: Evidence for Bidirectional Corridors of Human Migrations
- 1 2 Berniell-Lee, Gemma et al 2009 Genetic and Demographic Implications of the Bantu Expansion: Insights from Human Paternal Lineages
- 1 2 Hurles, Matthew E. et al 2005, The Dual Origin of the Malagasy in Island Southeast Asia and East Africa: Evidence from Maternal and Paternal Lineages
- 1 2 3 4 5 6 7 8 Tishkoff, Sarah A. et al 2007 History of Click-Speaking Populations of Africa Inferred from mtDNA and Y Chromosome Genetic Variation
- 1 2 3 Naidoo, Thijessen et al 2010, Development of a single base extension method to resolve Y chromosome haplogroups in sub-Saharan African populations
- 1 2 3 4 5 6 7 8 Cruciani, Fulvio et al 2002, A Back Migration from Asia to Sub-Saharan Africa Is Supported by High-Resolution Analysis of Human Y-Chromosome Haplotypes
- 1 2 Veeramah, Krishna R; et al. (2010). "Little genetic differentiation as assessed by uniparental markers in the presence of substantial language variation in peoples of the Cross River region of Nigeria". BMC Evolutionary Biology. 10: 92. doi:10.1186/1471-2148-10-92. PMC 2867817
 . PMID 20356404. Retrieved 2010-09-16. & Supplementary material
 - ↑ Moran CN et al 2004, Y chromosome haplogroups of elite Ethiopian endurance runners.
- 1 2 3 Cruciani et al. 2010, Human Y chromosome haplogroup R-V88: a paternal genetic record of early mid Holocene trans-Saharan connections and the spread of Chadic languages
- ↑ Sánchez, Juan J et al 2005, High frequencies of Y chromosome lineages characterized by E3b1, DYS19-11, DYS392-12 in Somali males
- 1 2 3 Pereira, Luísa et al. (2010), Linking the sub-Saharan and West Eurasian gene pools: maternal and paternal heritage of the Tuareg nomads from the African Sahel & Supplementary Material SM7
External links
This article is issued from Wikipedia - version of the 9/13/2016. The text is available under the Creative Commons Attribution/Share Alike but additional terms may apply for the media files.