Windsor and Maidenhead Borough Council elections
Windsor and Maidenhead is a unitary authority in Berkshire, England. Until 1 April 1998 it was a non-metropolitan district.
Political control
Since the first election to the council in 1973 political control of the council has been held by the following parties:[1][2]
Non-metropolitan district
| Party in control | Years | |
|---|---|---|
| Conservative | 1973-1991 | |
| No overall control | 1991-1995 | |
| Liberal Democrats | 1995-1998 | |
Unitary authority
| Party in control | Years | |
|---|---|---|
| No overall control | 1997-1999 | |
| Liberal Democrats | 1999-2000 | |
| No overall control | 2000-2003 | |
| Liberal Democrats | 2003-2007 | |
| Conservative | 2007–present | |
Council elections
Non-metropolitan district elections
- Windsor and Maidenhead Borough Council election, 1973
- Windsor and Maidenhead Borough Council election, 1976
- Windsor and Maidenhead Borough Council election, 1979
- Windsor and Maidenhead Borough Council election, 1983 (New ward boundaries)[3]
- Windsor and Maidenhead Borough Council election, 1987
- Windsor and Maidenhead Borough Council election, 1991 (Borough boundary changes took place but the number of seats remained the same)[4]
- Windsor and Maidenhead Borough Council election, 1995
Unitary authority elections
- Windsor and Maidenhead Borough Council election, 1997
- Windsor and Maidenhead Borough Council election, 2000
- Windsor and Maidenhead Borough Council election, 2003 (New ward boundaries reduced the number of seats by 1)[5][6][7]
- Windsor and Maidenhead Borough Council election, 2007
- Windsor and Maidenhead Borough Council election, 2011
- Windsor and Maidenhead Borough Council election, 2015
Borough result maps
-
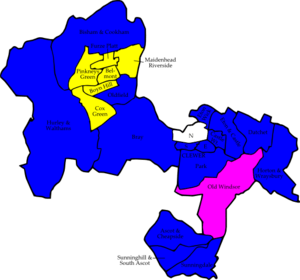
2007 results map
By-election results
1997–2000
| Party | Candidate | Votes | % | ± | |
|---|---|---|---|---|---|
| Liberal Democrat | 682 | 51.6 | -1.5 | ||
| Conservative | 502 | 38.0 | +5.0 | ||
| Labour | 103 | 7.8 | -3.1 | ||
| Independent | 25 | 1.9 | +1.9 | ||
| Independent | 10 | 0.8 | +0.8 | ||
| Majority | 180 | 13.6 | |||
| Turnout | 1,322 | 30.0 | |||
| Liberal Democrat hold | Swing | ||||
| Party | Candidate | Votes | % | ± | |
|---|---|---|---|---|---|
| Conservative | 737 | 46.7 | +1.8 | ||
| Labour | 539 | 34.2 | -0.6 | ||
| Liberal Democrat | 301 | 19.1 | -1.2 | ||
| Majority | 198 | 12.5 | |||
| Turnout | 1,577 | 26.4 | |||
| Conservative hold | Swing | ||||
| Party | Candidate | Votes | % | ± | |
|---|---|---|---|---|---|
| Liberal Democrat | 887 | 52.3 | -4.6 | ||
| Conservative | 724 | 42.6 | +7.7 | ||
| Labour | 88 | 5.2 | -3.1 | ||
| Majority | 163 | 9.7 | |||
| Turnout | 1,699 | 34.0 | |||
| Liberal Democrat hold | Swing | ||||
| Party | Candidate | Votes | % | ± | |
|---|---|---|---|---|---|
| Labour | 507 | 51.5 | +15.3 | ||
| Conservative | 347 | 35.3 | -1.2 | ||
| Liberal Democrat | 95 | 9.7 | -18.2 | ||
| Independent | 35 | 3.6 | +3.6 | ||
| Majority | 160 | 16.2 | |||
| Turnout | 984 | 50.8 | |||
| Labour gain from Conservative | Swing | ||||
| Party | Candidate | Votes | % | ± | |
|---|---|---|---|---|---|
| Conservative | 821 | 51.2 | -4.8 | ||
| Liberal Democrat | 783 | 48.8 | +18.3 | ||
| Majority | 38 | 2.4 | |||
| Turnout | 1,604 | 27.5 | |||
| Conservative hold | Swing | ||||
2000–2010
| Party | Candidate | Votes | % | ± | |
|---|---|---|---|---|---|
| Conservative | David Hilton | 752 | 51.1 | -7.0 | |
| Liberal Democrat | Enid Cross | 660 | 44.8 | +2.9 | |
| Labour | Kevin Cochrane | 60 | 4.1 | +4.1 | |
| Majority | 92 | 6.3 | |||
| Turnout | 1,472 | ||||
| Conservative hold | Swing | ||||
| Party | Candidate | Votes | % | ± | |
|---|---|---|---|---|---|
| Independent | Eileen Penfold | 599 | 69.9 | +9.9 | |
| Labour | Andrew Foakes | 258 | 30.1 | +10.7 | |
| Majority | 341 | 39.8 | |||
| Turnout | 857 | 18.1 | |||
| Independent hold | Swing | ||||
| Party | Candidate | Votes | % | ± | |
|---|---|---|---|---|---|
| Independent | John Penfold | 544 | 42.2 | +16.5 | |
| Conservative | Peter Smith | 325 | 25.2 | +13.0 | |
| Liberal Democrat | Helen Salmon | 298 | 23.1 | +15.8 | |
| Labour | Andrew Foakes | 121 | 9.4 | +2.4 | |
| Majority | 219 | 17.0 | |||
| Turnout | 1,288 | 22.5 | |||
| Independent hold | Swing | ||||
| Party | Candidate | Votes | % | ± | |
|---|---|---|---|---|---|
| Conservative | Colin Rayner | 595 | 54.4 | +16.9 | |
| Independent | Ewan Larcombe | 499 | 45.6 | -11.9 | |
| Majority | 96 | 8.8 | |||
| Turnout | 1,094 | ||||
| Conservative gain from Independent | Swing | ||||
| Party | Candidate | Votes | % | ± | |
|---|---|---|---|---|---|
| Conservative | Stephen Smith | 405 | 48.9 | +11.8 | |
| Labour | Marie Wilson | 250 | 30.1 | -32.8 | |
| Independent | Peter Lawless | 115 | 13.9 | +13.9 | |
| Liberal Democrat | Moray Barclay | 59 | 7.1 | +7.1 | |
| Majority | 155 | 18.8 | |||
| Turnout | 829 | 49.0 | |||
| Conservative gain from Labour | Swing | ||||
| Party | Candidate | Votes | % | ± | |
|---|---|---|---|---|---|
| Conservative | John Story | 1,039 | 60.5 | +12.2 | |
| Liberal Democrat | Enid Cross | 679 | 39.5 | +2.6 | |
| Majority | 360 | 21.0 | |||
| Turnout | 1,718 | 38.0 | |||
| Conservative hold | Swing | ||||
| Party | Candidate | Votes | % | ± | |
|---|---|---|---|---|---|
| Conservative | Gary Muir | 799 | 63.8 | -8.6 | |
| Liberal Democrat | Tim O'Flynn | 352 | 28.1 | +12.0 | |
| Independent | Ewan Larcombe | 102 | 8.1 | +8.1 | |
| Majority | 447 | 35.7 | |||
| Turnout | 1,253 | 35.8 | |||
| Conservative hold | Swing | ||||
2011–2020
| Party | Candidate | Votes | % | ± | |
|---|---|---|---|---|---|
| Conservative | Natahsha Lavender | 637 | 64.4 | +2.2 | |
| Liberal Democrat | Richard Fagence | 156 | 15.8 | -18.0 | |
| Labour | Laura Binnie | 149 | 15.1 | +11.0 | |
| Independent | Derek Prime | 47 | 4.8 | +4.8 | |
| Majority | 481 | 48.6 | |||
| Turnout | 989 | 27 | |||
| Conservative hold | Swing | ||||
| Party | Candidate | Votes | % | ± | |
|---|---|---|---|---|---|
| Liberal Democrat | George Fussey | 208 | 47.4 | +19.6 | |
| Conservative | Adam Demeter | 182 | 41.5 | -23.7 | |
| Labour | George Davidson | 32 | 7.3 | +0.3 | |
| UKIP | John-Paul Rye | 17 | 3.9 | N/A | |
| Majority | 26 | 5.9 | |||
| Turnout | 439 | 27.9 | -28.6 | ||
| Liberal Democrat gain from Conservative | Swing | 21.7 | |||
References
- ↑ "Council compositions". The Elections Centre. Retrieved 3 May 2016.
- ↑ "Windsor & Maidenhead Royal". BBC News Online. Retrieved 24 March 2010.
- ↑ The Royal Borough of Windsor and Maidenhead (Electoral Arrangements) Order 1980
- ↑ legislation.gov.uk - The Berkshire, Buckinghamshire, Hampshire, Oxfordshire and Surrey (County Boundaries) Order 1991. Retrieved on 5 November 2015.
- ↑ legislation.gov.uk - The Royal Borough of Windsor and Maidenhead (Electoral Changes) Order 2002. Retrieved on 4 October 2015.
- ↑ "Local elections". * BBC News Online. Retrieved 26 November 2010.
- ↑ "Councillors". The Royal Borough of Windsor and Maidenhead. Retrieved 24 March 2010.
- 1 2 3 4 5 6 7 8 "Borough By-Election Results". The Royal Borough of Windsor and Maidenhead. Retrieved 24 March 2010.
- ↑ "'Grim day' for Lib Dems in Windsor by-election". Maidenhead Advertiser. 7 January 2011. Retrieved 7 January 2011.
- ↑ "New councillor for Park ward". The Royal Borough of Windsor and Maidenhead. Retrieved 7 January 2011.
External links
| Bracknell Forest Borough Council |
|
|---|---|
| Reading Borough Council | |
| Slough Borough Council | |
| West Berkshire Council | |
| Windsor and Maidenhead Borough Council | |
| Wokingham Borough Council | |
| Berkshire County Council |
|
| |
This article is issued from Wikipedia - version of the 8/6/2016. The text is available under the Creative Commons Attribution/Share Alike but additional terms may apply for the media files.