Wind power in California
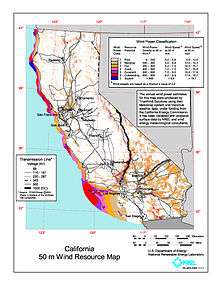
As of December 31, 2015, California has 6,108 megawatts (MW) of wind powered electricity generating capacity.[1] California's wind power capacity has grown by nearly 350% since 2001, when it was less than 1,700 MW.[1][2] As of the end of September 2012, wind energy (including that supplied by other states) now supplies about 5% of California’s total electricity needs, or enough to power more than 400,000 households. Most of California's wind generation is found in the Tehachapi area of Kern County, with some big projects in Solano, Contra Costa and Riverside counties as well. California presently ranks third nationwide in terms of capacity, behind Texas and Iowa.[1]
History
Wind power in California has been an area of considerable activity for many years. California was the first U.S. state where large wind farms were developed, beginning in the early 1980s.[3] By 1995, California produced 30 percent of the entire world's wind-generated electricity.[4] However, this situation has changed and Texas is currently the leader in wind power development in the USA.
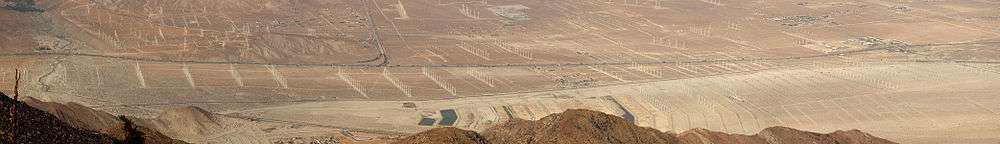
Historically, most of California's wind power output has been in three primary regions: Altamont Pass Wind Farm (east of San Francisco); Tehachapi Pass Wind Farm (south east of Bakersfield) and San Gorgonio Pass Wind Farm (near Palm Springs, east of Los Angeles).[4] A fourth area, the Montezuma Hills of Solano County, was developed in 2005–2009, with the large Shiloh Wind Power Plant.
The Alta Wind Energy Center is a windfarm located in Tehachapi Pass in Kern County, California.[5] Kern County is reviewing a number of other proposed wind projects that would generate a combined 4,600 megawatts of renewable energy if approved.[6]
|
 Ocotillo Wind Energy Project California wind farms |
Growth
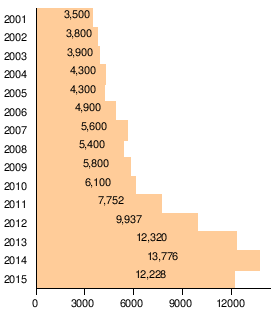 |
| Thousand Megawatt-hours of generated energy since 2001[2][9] |
The graph at right shows the growth in wind generated electricity for California since 2001.
California has a total of 6,108 megawatts installed wind generation capacity, as of the end of December 2015.[2] Wind energy (including power supplied from other states) now supplies about 5% of California’s total electricity needs.[10][11]
In 2011, 921.3 megawatts of new production were installed. Most of that activity occurred in the Tehachapi area of Kern County, with some big projects in Solano, Contra Costa and Riverside counties as well. After leading the country for many years, California now ranks third nationwide in terms of capacity, behind Texas and Iowa.[11][12][13] Due to higher average winds in Oklahoma, California is fourth in wind generation.[14]
California uses about 265,000 GWh each year.[15]
Offshore wind potential
A 2009 Stanford University study of California offshore wind potential identified a site off Cape Mendocino that could provide uninterrupted year round power from a 1500 MW wind farm that would produce an average of 790 MW. Three types of offshore wind power were studied, with the conclusion that from 12,300 to 19,700 GWh/yr could be delivered from 1,997 to 3,331 MW of monopile wind turbines installed in up to 20 meter deep water, from 38,200 to 73,000 GWh/yr could be delivered from 6,202 to 12,374 MW of multi-leg wind turbines in 20 to 50 meter deep water, and from 462,100 to 568,200 GWh/yr from 73,025 to 91,707 MW of floating turbine foundation wind turbines in from 50 to 200 meter deep water,[16] such as those being studied for use off the coast of Maine by the Ocean Energy Institute and the DeepCwind Consortium.[17]
Wind generation
| California Wind Generation (GWh, Million kWh) | |||||||||||||
|---|---|---|---|---|---|---|---|---|---|---|---|---|---|
| Year | Total | Jan | Feb | Mar | Apr | May | Jun | Jul | Aug | Sep | Oct | Nov | Dec |
| 2011 | 7,752 | 302 | 497 | 676 | 942 | 1,003 | 1,055 | 835 | 859 | 534 | 415 | 428 | 325 |
| 2012 | 9,937 | 624 | 637 | 826 | 828 | 1,255 | 1,274 | 891 | 930 | 694 | 806 | 428 | 743 |
| 2013 | 12,320 | 531 | 789 | 1,110 | 1,594 | 1,842 | 1,679 | 1,460 | 1,334 | 1,193 | 786 | 590 | 487 |
| 2014 | 13,776 | 607 | 881 | 1,140 | 1,389 | 1,804 | 1,914 | 1,439 | 1,312 | 995 | 829 | 810 | 656 |
| 2015 | 12,228 | 219 | 633 | 827 | 1,261 | 1,672 | 1,620 | 1,433 | 1,500 | 821 | 674 | 639 | 928 |
|

|

See also
- Renewable energy in the United States
- Wind power in the United States
- List of wind farms
- Clipper Windpower
- Anti-nuclear movement in California
References
- 1 2 3 "Wind Powering America: Installed U.S. Wind Capacity and Wind Project Locations". U.S. Department of Energy. 2016-02-17. Retrieved 2016-03-06.
- 1 2 3 "AWEA 4th quarter 2012 Public Market Report" (PDF). American Wind Energy Association (AWEA). January 2013. Retrieved January 30, 2013.
- ↑ Major CA Wind Energy Resource Areas
- 1 2 Overview of Wind Energy in California
- ↑ World's Largest Wind Project is Underway Renewable Energy World, July 29, 2010.
- ↑ California's largest wind power projects has been approved by Kern County December 17, 2009.
- 1 2 3 4 "U.S. Wind Energy Projects – California". American Wind Energy Association. July 2010. Retrieved July 28, 2010.
- ↑ "Ocotillo Express Wind Energy Project". U.S. Department of the Interior Bureau of Land Management. September 10, 2012. Retrieved January 6, 2013.
- ↑ "Energy Information Administration, Electricity Data Browser". U.S. Energy Information Administration. Retrieved March 7, 2015.
- ↑ AWEA 2012 Q1 Report
- 1 2 "Five Percent of California's Energy Supply Now Comes From Wind" (pdf). California Wind Energy Assn. Retrieved February 2, 2012.
- ↑ Marla Dickerson (January 31, 2012). "Wind power blowing up in California". LA Times.
- ↑ 2012 Third Quarter Market Report, American Wind Energy Association
- ↑ Electric Power Monthly Table 1.14.B. Utility Scale Facility Net Generation from Wind
- ↑ How high is California’s electricity demand, and where does the power come from?
- ↑ California offshore wind energy potential
- ↑ "Ocean Energy Institute". 2008. Retrieved 2008-12-15.
- ↑ EIA (July 27, 2012). "Electric Power Monthly Table 1.17.A.". United States Department of Energy. Retrieved 2012-08-15.
- ↑ EIA (July 27, 2012). "Electric Power Monthly Table 1.17.B.". United States Department of Energy. Retrieved 2013-02-28.
- ↑ EIA (Dec 20, 2013). "Electric Power Monthly Table 1.17.A.". United States Department of Energy. Retrieved 2014-01-18.
External links
| Wikimedia Commons has media related to Wind power in California. |
| Wind power by state |
| |
|---|---|---|
| Large wind farms | ||
| Wind power companies | ||