Wiltshire Council elections
As a result of the 2009 structural changes to local government in England, the former Wiltshire County Council and the four districts within its geographical area were replaced by the new Wiltshire Council, which is a unitary authority covering the same area, with elections continuing to be held every four years, beginning in June 2009. Previously, Wiltshire County Council had been elected between 1889 and 2005, initially every three years, later every four years.
History
The county council was established in 1889 as the principal local authority for the historic county of Wiltshire. It continued as such until April 1997, when the borough of Swindon became a unitary authority, taking almost a third of the population out of the area then falling under Wiltshire County Council. From 2009, it became Wiltshire Council.
Election results
Wiltshire County Council
- 5 May 1977: the Conservatives held onto control, winning fifty-seven seats, a gain of seventeen. Labour won fourteen, the Liberals and Independents four each.[1]
- 7 May 1981: following boundary changes, the Conservatives again retained control, winning forty seats, Labour had twenty, the Liberals twelve, and Independents two, including one Ratepayer.[2]
- 2 May 1985: the Conservatives lost their majority, winning only thirty seats, resulting in no overall control. The Liberals took seventeen seats and their Social Democrat allies eight, Labour seventeen, plus three Independents, including one Ratepayer.[3] Following the elections, an agreement between the leader of the Liberals, Jack Ainslie, and the leader of the Labour members, Mary Salisbury, led to the formation of a minority SDP–Liberal Alliance administration.[4]
- 4 May 1989: Conservatives 35, Liberal Democrats 18, Labour 18, Independents 2, Liberal 1, SDP 1, resulting in a continuation of no overall control, this time with the Liberal Democrats and Labour forming a joint administration.
- 6 May 1993: Liberal Democrats 33, Conservatives 18, Labour 17, resulting in a further four years of no overall control, with a Liberal Democrat and Labour administration.
- On 1 April 1997, Swindon was separated from Wiltshire to become a new unitary authority, giving the Liberal Democrats a brief period of overall control before that year's election.
- 1 May 1997 (the same day as the general election of 1997): Conservatives 22, Liberal Democrats 20, Labour 4, Independent 1, resulting in a continuation of no overall control, with a new Liberal Democrat and Labour administration being formed.
- On 2 April 1998 the Conservatives won a by-election in the Whorwellsdown division by 17 votes, and at the annual meeting in May 1998 a Conservative and Independent administration was formed.
- On 13 January 2000, the Conservatives won another by-election, this time in Melksham Without, gaining an overall majority which they were able to hold until the following year's elections.
- 7 June 2001 (a later date than usual to coincide with the general election of 2001): Conservatives 28, Liberal Democrats 14, Labour 3, Independents 2.
- 5 May 2005 (again coinciding with a general election): Conservatives 28, Liberal Democrats 16, Labour 3, Independents 2. Wiltshire County Council came to an end on 1 April 2009, when a new Wiltshire Council unitary authority was formed.
Wiltshire Council
Council elections
County Council elections
Unitary authority elections
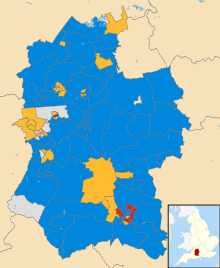
County result maps
By-election results
1997–2001
2001–2005
Salisbury St Paul By-Election 14 November 2002[5]
| Party |
Candidate |
Votes |
% |
± |
|
Labour |
Clive Robert Vincent |
534 |
36.8 |
-14.8 |
|
Conservative |
Terence John Lindley |
288 |
19.8 |
-6.2 |
|
Liberal Democrat |
Ben Gerald Rawlence |
272 |
18.7 |
-0.1 |
|
Independent |
Stephen Michael Dauwalder |
252 |
17.4 |
+17.4 |
|
UKIP |
Derek William Sales |
56 |
3.8 |
+3.8 |
|
Green |
Susan Isabel Wright |
50 |
3.4 |
-0.3 |
| Majority |
246 |
17.0 |
|
| Turnout |
1,482 |
24.3 |
|
|
Labour hold |
Swing |
|
|
2005–2009
2009–2013
2013–2016
References
- ↑ Conservatives triumph in Greater London and metropolitan counties in The Times of London, issue 59997 dated 7 May 1977, p. 3
- ↑ 'Declarations from the county councils' in The Times of London, issue 60923 dated Saturday, 9 May 1981, p. 4
- ↑ Hugh Clayton (Local Government Correspondent), 'Local Elections' in The Times of London, issue 62129 dated 4 May 1985, p. 4
- ↑ Hugh Clayton (Local Government Correspondent), 'Emerging figure in new Lib-Lab pact: an Alliance shire leader cast in Tory mould', in The Times of London, issue 62135 dated 11 May 1985, p. 2
- ↑ "Salisbury St Paul By Election result". Wiltshire Council. 2002-11-15. Retrieved 2009-09-02.
- ↑ "Chippenham Sheldon by-election result". Wiltshire Council. 2004-02-27. Retrieved 2009-09-02.
- ↑ "New councillors for Warminster ward". Wiltshire Times. 2006-11-10. Retrieved 2009-09-02.
- 1 2 "Local Authority Byelection Results - February 2008". www.gwydir.demon.co.uk. Retrieved 2010-11-19.
- ↑ "Id: 88010 - Friday 4th September 2009 - Press Release by election results". Wiltshire Council. 2008-02-08. Retrieved 2009-09-02.
- ↑ http://www.wiltshire.gov.uk/elections-declation-of-result-bromham-rowde-potterne.pdf
- ↑ Ethandune result at wiltshire.gov.uk/elections, accessed 19 July 2014
- ↑ by-election result at wiltshire.gov.uk, accessed 10 May 2015
External links
|
|---|
|
| Districts | | |
|---|
|
| Councils | |
|---|
|
| Local elections | |
|---|