William Playfair

William Playfair (22 September 1759 – 11 February 1823) was a Scottish engineer and political economist, the founder of graphical methods of statistics.[1]
William Playfair invented several types of diagrams: in 1786 the line, area and bar chart of economic data, and in 1801 the pie chart and circle graph, used to show part-whole relations.[2]
Biography
Playfair was born in 1759 in Scotland during the Enlightenment, a Golden Age in the arts, sciences, industry and commerce. He was the fourth son (named after his grandfather) of the Reverend James Playfair of the parish of Liff & Benvie near the city of Dundee in Scotland; his notable brothers were architect James Playfair and mathematician John Playfair. His father died in 1772 when William was 13, leaving the eldest brother John to care for the family and his education. After his apprenticeship with Andrew Meikle, the inventor of the threshing machine, Playfair became draftsman and personal assistant to James Watt at the Boulton and Watt steam engine manufactory in Soho, Birmingham.[3]
Playfair had a variety of careers. He was in turn a millwright, engineer, draftsman, accountant, inventor, silversmith, merchant, investment broker, economist, statistician, pamphleteer, translator, publicist, land speculator, convict, banker, ardent royalist, editor, blackmailer and journalist. On leaving Watt's company in 1782, he set up a silversmithing business and shop in London, which failed. In 1787 he moved to Paris, taking part in the storming of the Bastille two years later. He returned to London in 1793, where he opened a "security bank", which also failed. From 1775 he worked as a writer and pamphleteer and did some engineering work.[3]
Work
Ian Spence and Howard Wainer in 2001 describe Playfair as "engineer, political economist and scoundrel" while "Eminent Scotsmen" calls him an "ingenious mechanic and miscellaneous writer." It compares his career with the glorious one of his older brother John Playfair, the distinguished Edinburgh professor, and draws a moral about the importance of "steadiness and consistency of plan" as well as of "genius."[4]
Bar chart
Two decades before Playfair's first achievements, in 1765 Joseph Priestley had created the innovation of the first timeline charts, in which individual bars were used to visualise the life span of a person, and the whole can be used to compare the life spans of multiple persons. According to James R. Beniger and Robyn (1978) "Priestley's timelines proved a commercial success and a popular sensation, and went through dozens of editions".[5]

These timelines directly inspired Wiliam Playfair's invention of the bar chart, which first appeared in his Commercial and Political Atlas, published in 1786. According to Beniger and Robyn (1978) "Playfair was driven to this invention by a lack of data. In his Atlas he had collected a series of 34 plates about the import and export from different countries over the years, which he presented as line graphs or surface charts: line graphs shaded or tinted between abscissa and function. Because Playfair lacked the necessary series data for Scotland, he graphed its trade data for a single year as a series of 34 bars, one for each of 17 trading partners".[5]

In this bar chart Scotland's imports and exports from and to 17 countries in 1781 are represented. "This bar chart was the first quantitative graphical form that did not locate data either in space, as had coordinates and tables, or time, as had Priestley's timelines. It constitutes a pure solution to the problem of discrete quantitative comparison".[5]
The idea of representing data as a series of bars had earlier (14th century) been published by Jacobus de Sancto Martino and attributed to Nicole Oresme. Oresme used the bars to generate a graph of velocity against continuously varying time. Playfair's use of bars was to generate a chart of discrete measurements.[6]
Graphics
Playfair, who argued that charts communicated better than tables of data, has been credited with inventing the line, bar, area, and pie charts. His time-series plots are still presented as models of clarity.
Playfair first published The Commercial and Political Atlas in London in 1786. It contained 43 time-series plots and one bar chart, a form apparently introduced in this work. It has been described as the first major work to contain statistical graphs.
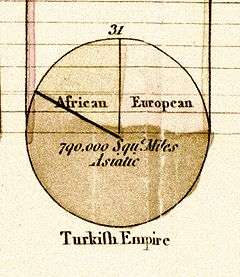
Playfair's Statistical Breviary, published in London in 1801, contains what is generally credited as the first pie chart.[7][8][9]
Playfair cycle
The following quotation, known as the "Playfair cycle," has achieved notoriety as it pertains to the "Tytler cycle":
:...wealth and power have never been long permanent in any place.
- ...they travel over the face of the earth,
- something like a caravan of merchants.
- On their arrival, every thing is found green and fresh;
- while they remain all is bustle and abundance,
- and, when gone, all is left trampled down, barren, and bare.[10]
Works
- 1785. The Increase of Manufactures, Commerce, and Finance, with the Extension of Civil Liberty, Proposed in Regulations for the Interest of Money. London: G.J. & J. Robinson.
- 1786. The Commercial and Political Atlas: Representing, by Means of Stained Copper-Plate Charts, the Progress of the Commerce, Revenues, Expenditure and Debts of England during the Whole of the Eighteenth Century.
- 1787. Joseph and Benjamin, a Conversation Translated from a French Manuscript. London: J. Murray.
- 1793. Thoughts on the Present State of French Politics, and the Necessity and Policy of Diminishing France, for Her Internal Peace, and to Secure the Tranquillity of Europe. London: J. Stockdale.
- 1793. A general view of the actual force and resources of France, in January, M. DCC. XCIII: to which is added, a table, shewing the depreciation of assignats, arising from their increase in quantity. J. Stockdale.
- 1796. The History of Jacobinism, Its Crimes, Cruelties and Perfidies: Comprimising an Inquiry into the Manner of Disseminating, under the Appearance of Philosophy and Virtue, Principles which are Equally Subversive of Order, Virtue, Religion, Liberty and Happiness. Vol. I.. Philadelphia: W. Cobbett.
- 1796. For the Use of the Enemies of England, a Real Statement of the Finances and Resources of Great Britain
- 1798. Lineal arithmetic, Applied to Shew the Progress of the Commerce and Revenue of England During the Present Century. A. Paris.
- 1799. Stricture on the Asiatic Establishments of Great Britain, With a View to an Enquiry into the True Interests of the East India Company. Bunney & Gold.
- 1801. Statistical Breviary; Shewing, on a Principle Entirely New, the Resources of Every State and Kingdom in Europe. London: Wallis.
- 1805. An Inquiry into the Permanent Causes of the Decline and Fall of Powerful and Wealthy Nations. London: Greenland & Norris.
- 1805. European commerce, shewing new and secure channels of trade with the continent of Europe...
- 1805. Statistical Account of the United States of America by D. F. Donnant. London: J. Whiting. William Playfair, Trans.
- 1807. European Commerce, Shewing New and Secure Channels of Trade with the Continent of Europe. Vol. I.. Philadelphia: J. Humphreys.
- 1808. Inevitable Consequences of a Reform in Parliament
- 1809. A Fair and Candid Address to the Nobility and Baronets of the United Kingdom; Accompanied with Illustrations and Proofs of the Advantage of Hereditary Rank and Title in a Free Country
- 1811. British Family Antiquity: Index to the 9 Volumes of William Playfair's Family Antiquity of the British Nobility
- 1813. Outlines of a Plan for a New and Solid Balance of Power in Europe. J. Stockdale.
- 1814. Political Portraits in This New Æra, Vol. II . London: C. Chapple.
- 1816. Supplementary Volume to Political Portraits in This New Æra. London: C. Chapple.
- 1818. The History of England, from the Revolution in 1688 to the Death of George II. Vol. II. R. Scholey.
- 1819. France as it Is, Not Lady Morgan's France, Vol. I. London: C. Chapple.
- 1820. France as it Is, Not Lady Morgan's France, Vol. II. London: C. Chapple.
References
- ↑ Paul J. FitzPatrick (1960). "Leading British Statisticians of the Nineteenth Century". In: Journal of the American Statistical Association, Vol. 55, No. 289 (Mar. 1960), pp. 38–70.
- ↑ Michael Friendly (2008). "Milestones in the history of thematic cartography, statistical graphics, and data visualization". pp 13–14. Retrieved 7 July 2008.
- 1 2 Ian Spence and Howard Wainer (1997). "Who Was Playfair?". In: Chance 10, p. 35–37.
- ↑ Ian Spence and Howard Wainer (2001). "William Playfair". In: Statisticians of the Centuries. C.C. Heyde and E. Seneta (eds.) New York: Springer. pp. 105–110.
- 1 2 3 James R. Beniger and Dorothy L. Robyn (1978). "Quantitative graphics in statistics: A brief history". In: The American Statistician. 32: pp. 1–11.
- ↑ Der, Geoff; Everitt, Brian S. (2014). A Handbook of Statistical Graphics Using SAS ODS. Chapman and Hall - CRC. p. 4. ISBN 1-584-88784-2.
William Playfair, for example, is often credited with inventing the bar chart (see Chapter 3) in the last part of the 18th century, although a Frenchman, Nicole Oresme, used a bar chart in a 14th century publication, The Latitude of Forms to plot the velocity of a constantly accelerating object against time. But it was Playfair who popularized the idea of graphic depiction of quantitative information.
- ↑ Edward R. Tufte (2001). The Visual Display of Quantitative Information. Chesire, CT: Graphics Press, p. 44.
- ↑ Ian Spence (2005). "No Humble Pie: The Origins and Usage of a statistical Chart". In: Journal of Educational and Behavioral Statistics. Winter 2005, 30 (4), 353–368.
- ↑ Playfair, William; Wainer, Howard; Spence, Ian (2005). Playfair's Commercial and Political Atlas and Statistical Breviary. Cambridge University Press. ISBN 9780521855549.
- ↑ William Playfair (1807). An Inquiry into the Permanent Causes of the Decline and Fall of Powerful and Wealthy Nations, p. 102.
External links
| Wikimedia Commons has media related to William Playfair. |
- Playfair, William (1759–1823) at oxforddnb.com
- William PLAYFAIR b. 22 September 1759 - d. 11 February 1823 at statprob.com
- "Biographical Dictionary of Eminent Scotsmen"
- Works by William Playfair at Project Gutenberg
- Works by or about William Playfair at Internet Archive