List of California wildfires
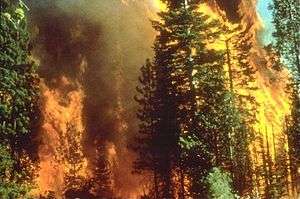
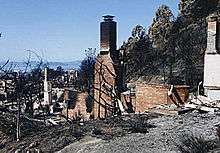
California has dry, windy, and often hot weather conditions from late spring through autumn that can produce moderate to devastating wildfires. At times, these wildfires are fanned or made worse from strong, dry winds, known as Diablo winds in the northern part of the state and Santa Ana Winds to the south. Wildfires in California are growing more dangerous and costly. U.S. taxpayers are paying about $3 billion a year to fight wildfires, triple what it cost in the 1990s, and big fires can lead to billions of dollars in property losses.[1]
The following is a list of major wildfires of various sizes that have occurred in California.
Largest Fires
Since 1932, when accurate records started to be kept, these are the 20 largest wildfires in California according to CAL FIRE.[2]
Note: ![]() means fire is currently burning. Total size and position in list subject to change.
means fire is currently burning. Total size and position in list subject to change.
| Name | County | Acres | Km2 | Start Date | Structures | Deaths | Notes |
|---|---|---|---|---|---|---|---|
| Rush | Lassen | 315,577 | 1,277.1 | August 2012 | 0 | 0 | Of this fire, 43,666 acres (176.7 km2) burned in Nevada |
| Cedar | San Diego | 273,246 | 1,105.8 | October 2003 | 2,820 | 15 | |
| Rim | Tuolumne | 257,314 | 1,041.3 | August 2013 | 112 | 0 | |
| Zaca | Santa Barbara | 240,207 | 972.1 | July 2007 | 1 | 0 | |
| Matilija | Ventura | 220,000 | 890.3 | September 1932 | 0 | 0 | |
| Witch | San Diego | 197,990 | 801.2 | October 2007 | 1,650 | 2 | |
| Klamath Theater Complex | Siskiyou | 192,038 | 777.2 | June 2008 | 0 | 2 | |
| Marble Cone | Monterey | 177,866 | 719.8 | July 1977 | 0 | 0 | |
| Laguna | San Diego | 175,425 | 709.9 | September 1970 | 382 | 8 | |
| Basin Complex | Monterey | 162,818 | 658.9 | June 2008 | 58 | 0 | |
| Day | Ventura | 162,702 | 658.4 | September 2006 | 11 | 0 | |
| Station | Los Angeles | 160,557 | 649.8 | August 2009 | 209 | 2 | |
| Rough | Fresno | 151,623 | 613.6 | July 2015 | 4 | 0 | |
| McNally | Tulare | 150,696 | 609.8 | July 2002 | 17 | 0 | |
| Stanislaus Complex | Tuolumne | 145,980 | 590.8 | August 1987 | 28 | 1 | |
| Big Bar Complex | Trinity | 140,948 | 570.4 | August 1999 | 0 | 0 | |
| Happy Camp Complex | Siskiyou | 132,833 | 537.6 | August 2014 | 6 | 0 | |
| Soberanes | Monterey | 132,127 | 534.7 | July 2016 | 68 | 1 | |
| Campbell Complex | Tehama | 125,892 | 509.5 | August 1990 | 27 | 0 | |
| Wheeler | Ventura | 118,000 | 477.5 | July 1985 | 26 | 0 | |
Pre-2000
- Santiago Canyon Fire (1889). Burned on the order of 310,000 acres (130,000 ha).
- Berkeley Fire (1923): destroyed 640 structures, including 584 homes
- Griffith Park Fire (1933). Official death toll was 29 firefighters, but may have killed up to 58.
- Rattlesnake Fire (1953). 15 firefighters were killed in this arsonist's fire.
- Bel Air Fire (1961). 484 homes were destroyed; 112 injuries.
- Laguna Fire (1970). 382 homes burned, killing eight people.
- Painted Cave Fire (1990). 1 death and 430 buildings burnt in this arson fire near Santa Barbara.
- Oakland Hills firestorm (1991): killed 25 people. Destroyed 2,843 single-family homes and 437 multi-family units.
- Mount Vision fire (1995). 45 homes destroyed. Cause: illegal campfire.
Post 2000
Starting in 2001, the National Interagency Fire Center began keeping more accurate records about total fire acreage burned in each state.[3]
Yearly Stats
| Year | Fires | Acres | Mi2 | Km2 | Ref |
|---|---|---|---|---|---|
| 2001 | 9,458 | 329,126 | 514.3 | 1,331.9 | [4] |
| 2002 | 8,328 | 506,696 | 791.7 | 2,050.5 | [5] |
| 2003 | 9,116 | 793,402 | 1,239.7 | 3,210.8 | [6] |
| 2004 | 8,415 | 242,057 | 378.2 | 979.6 | [7] |
| 2005 | 7,162 | 202,754 | 316.8 | 820.5 | [8] |
| 2006 | 8,202 | 678,919 | 1,060.8 | 2,747.5 | [9] |
| 2007 | 9,093 | 1,087,110 | 1,698.6 | 4,399.4 | [10] |
| 2008 | 4,108 | 1,375,781 | 2,149.7 | 5,567.6 | [11] |
| 2009 | 9,159 | 405,585 | 633.7 | 1,641.3 | [12] |
| 2010 | 6,554 | 109,529 | 171.1 | 443.2 | [13] |
| 2011 | 7,989 | 126,854 | 198.2 | 513.4 | [14] |
| 2012 | 7,950 | 869,599 | 1,358.7 | 3,519.1 | [15] |
| 2013 | 9,907 | 577,675 | 902.6 | 2,337.8 | [16] |
| 2014 | 7,865 | 555,044 | 867.3 | 2,246.2 | [17] |
| 2015 | 8,745 | 893,362 | 1,395.9 | 3,615.3 | [18] |
| Average | 8,137 | 583,566 | 911.8 | 2,361.6 | |
A 2015 study indicates that the increase in fire risk in California is attributable to human-induced climate change.[19]
Notable Fires
| Name | County | Acres | Km2 | Start | Contained | Notes | Ref |
|---|---|---|---|---|---|---|---|
| Simi | Ventura | 108,204 | 437.9 | 25 October 2003 | 5 November 2003 | 315 structures destroyed | [20] |
| Old | San Bernardino | 91,281 | 369.4 | 25 October 2003 | 25 November 2003 | 975 structures destroyed | [21] |
| Rumsey | Yolo | 39,138 | 158.4 | 10 October 2004 | 16 October 2004 | 5 structures destroyed | [22] |
| Topanga | Los Angeles | 24,175 | 97.8 | 28 September 2005 | 6 October 2005 | [23] | |
| Island | Los Angeles | 4,750 | 19.2 | 10 May 2007 | 15 May 2007 | 6 structures destroyed | [24] |
| Zaca | Santa Barbara | 240,207 | 972.1 | 4 July 2007 | 2 September 2007 | 1 structure destroyed | [25] |
| Witch | San Diego | 197,990 | 801.2 | 21 October 2007 | 31 October 2007 | 1,650 structures destroyed | [26] |
| Harris | San Diego | 90,440 | 366.0 | 21 October 2007 | 9 November 2007 | 472 structures destroyed; 1 fatality | [27] |
| Santiago | Orange | 28,400 | 114.9 | 21 October 2007 | 8 November 2007 | 24 structures destroyed | [28] |
| Corral | Los Angeles | 4,901 | 19.8 | 24 November 2007 | 27 November 2007 | 86 structures destroyed | [29] |
| Indians | Monterey | 81,378 | 329.3 | 8 June 2008 | 10 July 2008 | [30] | |
| Basin Complex | Monterey | 162,818 | 658.9 | 21 June 2008 | 27 July 2008 | [31] | |
| Sesnon | Los Angeles | 14,703 | 59.5 | 13 October 2008 | 18 October 2008 | [32] | |
| Guiberson | Ventura | 17,500 | 70.8 | 22 September 2009 | 1 October 2009 | [33] | |
| Jesusita | Santa Barbara | 8,733 | 35.3 | 5 May 2009 | 20 May 2009 | 160 structures destroyed | [34] |
| La Brea | Santa Barbara | 89,489 | 362.1 | 8 August 2009 | 23 August 2009 | [35] | |
| Lockheed | Santa Cruz | 7,817 | 31.6 | 12 August 2009 | 23 August 2009 | 13 structures destroyed | [36] |
| Station | Los Angeles | 160,577 | 649.8 | 26 August 2009 | 16 October 2009 | 209 structures destroyed; 2 fatalities | [37] |
| Rush | Lassen | 315,557 | 1,277.0 | 12 August 2012 | 30 August 2012 | 1 barn destroyed | [38] |
| Springs | Ventura | 28,000 | 110 | 2 May 2013 | 6 May 2013 | 20 outbuildings destroyed | [39] |
| Powerhouse | Los Angeles | 30,000 | 120 | 30 May 2013 | 10 June 2013 | 24 structures destroyed | [40] |
| Mountain | Riverside | 27,531 | 111.4 | 15 July 2013 | 21 July 2013 | 23 structures destroyed | [41] |
| Rim | Tuolumne | 257,314 | 1,041.3 | 17 August 2013 | 24 October 2013 | 112 structures destroyed | [42] |
| Clover | Shasta | 8,073 | 32.7 | 9 September 2013 | 15 September 2013 | 68 homes destroyed; 1 fatality | [43] |
| Happy Camp Complex | Siskiyou | 134,056 | 542.5 | 14 August 2014 | 31 October 2014 | 6 structures destroyed | [44] |
| King | El Dorado | 97,717 | 395.4 | 13 September 2014 | 9 October 2014 | 80 structures destroyed | [45] |
| Boles | Siskiyou | 516 | 2.1 | 15 September 2014 | 11 October 2014 | 157 structures destroyed | [46] |
| Lake | San Bernardino | 31,359 | 126.9 | 17 June 2015 | 1 August 2015 | 4 structures destroyed | [47] |
| North | San Bernardino | 4,250 | 17.2 | 17 July 2015 | 21 July 2015 | 7 structures destroyed | [48] |
| Rocky | Lake | 69,438 | 281.0 | 29 July 2015 | 14 August 2015 | 43 structures destroyed | [49] |
| Butte | Amador and Calaveras | 70,868 | 286.8 | 9 September 2015 | 1 October 2015 | 818 structures destroyed; 2 fatalities | [50] |
| Valley | Lake, Napa and Sonoma | 76,067 | 307.8 | 12 September 2015 | 15 October 2015 | 1,955 structures destroyed; 4 fatalities | [51] |
| Erskine | Kern | 47,864 | 193.7 | 23 June 2016 | 11 July 2016 | 309 buildings destroyed; 2 fatalities | [52] |
| Sand | Los Angeles | 41,432 | 167.7 | 22 July 2016 | 3 August 2016 | 18 homes destroyed, 2 fatalities | [53] |
| Soberanes | Monterey | 132,127 | 534.7 | 22 July 2016 | 12 October 2016 | 57 homes, 11 outbuildings destroyed, 1 fatality | [54] |
| Chimney | San Luis Obispo | 46,344 | 187.5 | 13 August 2016 | 6 September 2016 | 68 structures destroyed | [55] |
| Clayton | Lake | 3,929 | 15.9 | 13 August 2016 | 26 August 2016 | 175 structures destroyed, including a Habitat for Humanity office | [56] |
| Blue Cut | San Bernardino | 37,000 | 149.7 | 16 August 2016 | 23 August 2016 | 105 homes, 213 outbuildings destroyed, 82,000+ evacuated | [57] |
| Loma | Santa Clara | 4,474 | 18.1 | 26 September 2016 | 12 October 2016 | 28 structures destroyed | [58] |
Areas of repeated ignition
In some parts of California, fires can sometimes recur in areas that have had past histories of fires. Examples of this are in Oakland, which fires of various size and ignition occurred in 1923, 1931, 1933, 1937, 1946, 1955, 1960, 1961, 1968, 1970, 1980, 1990, 1991, 1995, 2002, and 2008.[59][60] Other examples being Orange County, Riverside County, San Bernardino County, and Los Angeles County. In the case of Orange and San Bernardino, these two counties share a county border that runs north to south through the Chino Hills State Park, with the parks landscape ranging from large green coastal sage scrub, grassland, and woodland, to areas of brown sparsely dense vegetation made drier by droughts or hot summers. The valley's grass and barren land can become easily susceptible to dry spells and drought, therefore making it a prime spot for brush fires and conflagration, which many have occurred since 1914. Hills and canyons that have seen brush or wildfires in one or similar locations have occurred in 1914, the 1920s, 1930s, 1940s, 1950s, 1960s, 1970s, 1980s, 1990s, 2000s, and into today.[61]
On occasion, freak lightning strikes from thunderstorms may also inadvertently spark wildfires in areas that have seen past ignition. Examples of this are the 1999 Megram Fire, the Summer 2008 California wildfires, among others.
See also
References
- ↑ "Wildfires are growing more costly". NBC News. 2014-05-14.
- ↑ "Top 20 Largest California Wildfires" (PDF). CAL FIRE. Retrieved 22 September 2016.
- ↑ "Statistics". National Interagency Fire Center. Retrieved 24 August 2015.
- ↑ "National Report of Wildland Fires and Acres Burned by State 2001" (PDF). National Interagency Fire Center. Retrieved 12 August 2015.
- ↑ "National Report of Wildland Fires and Acres Burned by State 2002" (PDF). National Interagency Fire Center. Retrieved 12 August 2015.
- ↑ "National Report of Wildland Fires and Acres Burned by State 2003" (PDF). National Interagency Fire Center. Retrieved 12 August 2015.
- ↑ "National Report of Wildland Fires and Acres Burned by State 2004" (PDF). National Interagency Fire Center. Retrieved 12 August 2015.
- ↑ "National Report of Wildland Fires and Acres Burned by State 2005" (PDF). National Interagency Fire Center. Retrieved 12 August 2015.
- ↑ "National Report of Wildland Fires and Acres Burned by State 2006" (PDF). National Interagency Fire Center. Retrieved 12 August 2015.
- ↑ "National Report of Wildland Fires and Acres Burned by State 2007" (PDF). National Interagency Fire Center. Retrieved 12 August 2015.
- ↑ "National Report of Wildland Fires and Acres Burned by State 2008" (PDF). National Interagency Fire Center. Retrieved 12 August 2015.
- ↑ "National Report of Wildland Fires and Acres Burned by State 2009" (PDF). National Interagency Fire Center. Retrieved 12 August 2015.
- ↑ "National Report of Wildland Fires and Acres Burned by State 2010" (PDF). National Interagency Fire Center. Retrieved 12 August 2015.
- ↑ "National Report of Wildland Fires and Acres Burned by State 2011" (PDF). National Interagency Fire Center. Retrieved 12 August 2015.
- ↑ "National Report of Wildland Fires and Acres Burned by State 2012" (PDF). National Interagency Fire Center. Retrieved 12 August 2015.
- ↑ "National Report of Wildland Fires and Acres Burned by State 2013" (PDF). National Interagency Fire Center. Retrieved 12 August 2015.
- ↑ "National Report of Wildland Fires and Acres Burned by State 2014" (PDF). National Interagency Fire Center. Retrieved 12 August 2015.
- ↑ "National Report of Wildland Fires and Acres Burned by State 2015" (PDF). National Interagency Fire Center. Retrieved 26 June 2016.
- ↑ Yoon et al. (2015) EXTREME FIRE SEASON IN CALIFORNIA: A GLIMPSE INTO THE FUTURE?. https://www.researchgate.net/publication/283425168_EXTREME_FIRE_SEASON_IN_CALIFORNIA_A_GLIMPSE_INTO_THE_FUTURE#full-text
- ↑ "Simi Fire". CAL FIRE. Retrieved 28 August 2015.
- ↑ "Old Fire" (PDF). FIRESCOPE. Retrieved 31 August 2015.
- ↑ "Rumsey Fire". CAL FIRE. Retrieved 28 August 2015.
- ↑ "Topanga Fire". CAL FIRE. Retrieved 28 August 2015.
- ↑ "Large Fires 2007" (PDF). CAL FIRE. Retrieved 21 August 2015.
- ↑ "Zaca Fire". CAL FIRE. Retrieved 25 August 2015.
- ↑ "Witch Fire". CAL FIRE. Retrieved 22 August 2015.
- ↑ "Harris Fire". CAL FIRE. Retrieved 22 August 2015.
- ↑ "Officials: Arson Behind Santiago Fire". CBS.com. 2007-10-25. pp. 1–2. Retrieved 2007-10-26.
- ↑ "Corral Fire". CAL FIRE. Retrieved 24 August 2015.
- ↑ "Large Fires 2008" (PDF). CAL FIRE. Retrieved 14 August 2015.
- ↑ "Top 20 Largest California Wildfires" (PDF). CAL FIRE. Retrieved 14 August 2015.
- ↑ "Sesnon Fire". CAL FIRE. Retrieved 24 August 2015.
- ↑ "Guiberson Fire". CAL FIRE. Retrieved 21 August 2015.
- ↑ "Jesusita Fire". CAL FIRE. Retrieved 20 August 2015.
- ↑ "La Brea Fire". CAL FIRE. Retrieved 21 August 2015.
- ↑ "Lockheed Fire". CAL FIRE. Retrieved 24 August 2015.
- ↑ "Station Fire". CAL FIRE. Retrieved 20 August 2015.
- ↑ "Rush Fire". Inciweb. Retrieved 2015-08-07.
- ↑ Bernstein, Sharon (May 6, 2013). "Firefighters, helped by rain, mop up California wildfire". Reuters. Retrieved 21 July 2013.
- ↑ Watt, Brian (June 6, 2013). "Powerhouse Fire: 53 structures, 24 homes burned as officials revise estimates upward (map)". KPCC. Retrieved 20 July 2013.
- ↑ Cocca, Christine (July 31, 2013). "Mountain Fire Fully Contained After Raging for 16 Days". NBC 4 Southern California. Retrieved 31 July 2013.
- ↑ "Rim Fire". InciWeb. Retrieved 24 October 2013.
- ↑ "Incident information: Clover Fire". CalFire. Retrieved 31 January 2014.
- ↑ "Happy Camp Complex Fire". CAL FIRE. Retrieved 5 August 2015.
- ↑ "King Fire". CAL FIRE. Retrieved 5 August 2015.
- ↑ "Boles Fire". CAL FIRE. Retrieved 6 August 2015.
- ↑ "Lake Fire". InciWeb. Retrieved 6 August 2015.
- ↑ "NORTH FIRE: Blaze completely contained". Press Enterprise. July 21, 2015. Retrieved July 21, 2015.
- ↑ "Rocky Fire". CAL FIRE. Retrieved 6 August 2015.
- ↑ "Butte Fire". CAL FIRE. Retrieved 8 May 2016.
- ↑ "Valley Fire". CAL FIRE. Retrieved 8 May 2016.
- ↑ "Erskine Fire". InciWeb. Retrieved June 29, 2016.
- ↑ Carr, Ada and Wright, Pam (24 July 2016). "Body Found As Firefighters Continue to Battle 'Sand Fire' Near Los Angeles; 18 Homes Destroyed". The Weather Channel. Retrieved 25 July 2016.
- ↑ "Soberanes Fire". InciWeb. Retrieved 22 September 2016.
- ↑ "Chimney Fire approaching Monterey Co, threatens Hearst Castle". abc7news.com. 23 August 2016.
- ↑ "Clayton Fire devastates Lake County town; thousands flee". sfgate.com. 15 August 2016.
- ↑ "Blue Cut Fire burns 18,000 acres, 82,000 evacuated in San Bernardino County". abc7.com. 17 August 2016.
- ↑ "Loma Fire". CAL FIRE. 20 October 2016.
- ↑ http://montclairoak.com/tag/oakland-hills-fire/
- ↑ http://www2.oaklandnet.com/oakca1/groups/fire/documents/webcontent/oak042168.pdf
- ↑ http://www.hillsforeveryone.org/projects/fire-files/A-100-Year-History-of-Wildfires-Near-CHSP.pdf
External links
| Wikimedia Commons has media related to Wildfires in California. |
- Official California Department of Forestry and Fire Protection (CAL FIRE) website
- CAL FIRE Blogspot: California Fire News
- California wildfires on the US Forestry Incident Information System (InciWeb)
- Iawfonline.org: Infamous World Fires. Compiled by the International Association of Wildland Fire (revised May 15, 2008)
| |