Weoley (ward)
| Weoley Ward | |
| Population | 25,925 (2011) |
|---|---|
| District | City of Birmingham |
| Ceremonial county | West Midlands |
| Region | West Midlands |
| Country | England |
| Sovereign state | United Kingdom |
| EU Parliament | West Midlands |
| UK Parliament | Birmingham Northfield |
| Councillors | Peter Douglas Osborn (Conservatives) |
| Julie Johnson JP (Labour) | |
| Steve Booton (Labour) | |
|
|
Coordinates: 52°26′15″N 1°58′13″W / 52.4376°N 1.9702°W The Weoley local council ward is one of the 40 electoral wards for the City of Birmingham, England. It is also one of the four wards that make up the local council constituency of Birmingham Northfield, the other three being the wards of Northfield, Longbridge and King's Norton.
Ward Description
The ward covers an area of west Birmingham. It is predominantly based upon the Weoley Castle area of Birmingham. Other communities within Weoley are Allens Cross, Weoley Hill, Middle Park and Spicelands Road.[1]
Ward Demographics (from the census of 2011)
The 2011 Population Census recorded that there were 25,925 people living in the ward. Eighty per cent (20,744) of the ward's population are of white ethnicity, compared with 57.9% for Birmingham.[2][3]
Ward History
The Ward was created in May 1950[4] as a result of the boundary changes of that year. The boundaries have been changed on a number of occasions since then.
Parliamentary Representation
The ward has been part of Birmingham Northfield constituency since 1950.
Politics
As of 2016, the Ward is served by three councillors on Birmingham City Council: Peter Douglas Osborn, Conservatives, and Steve Booton and Julie Johnson JP, both of whom represent the Labour Party.
Election results
2010s
| Party | Candidate | Votes | % | ± | |
|---|---|---|---|---|---|
| Labour | Julie Johnson* | 2,125 | 40.7 | ||
| Conservative | Eddie Freeman (incumbent) | 1,943 | 37.2 | ||
| UKIP | Steven Brookes | 739 | 14.2 | ||
| Liberal Democrat | Steve Haynes | 213 | 4.1 | ||
| Green | Ben Kerr-Morgan | 200 | 3.8 | ||
| Majority | 182 | 3.5 | |||
| Turnout | 5,220 | 30.1 | |||
| Labour gain from Conservative | Swing | ||||
| Party | Candidate | Votes | % | ± | |
|---|---|---|---|---|---|
| Labour | Steve Booton* | 4,118 | 40.4 | ||
| Conservative | Jayne Elizabeth Freeman | 3,519 | 34.6 | ||
| UKIP | Tony Hayes | 1,641 | 16.1 | ||
| Green | Anna Lucille Masters | 494 | 4.9 | ||
| Liberal Democrat | Steven Alan Haynes | 412 | 4.1 | ||
| Majority | 599 | 5.9 | |||
| Turnout | 10,184 | 58 | |||
| Labour gain from Conservative | Swing | ||||
| Party | Candidate | Votes | % | ± | |
|---|---|---|---|---|---|
| Conservative | Peter Douglas Osborn* | 2,287 | 39.4 | ||
| Labour | Steve Booton | 1,780 | 30.7 | ||
| UKIP | Kevin Morris | 1,205 | 20.8 | ||
| Green | Anna Masters | 305 | 5.3 | ||
| Liberal Democrat | Sally Haynes-Preece | 223 | 3.8 | ||
| Majority | 507 | 8.7 | |||
| Turnout | 5,800 | 33[10] | |||
| Conservative hold | Swing | ||||
| Party | Candidate | Votes | % | ± | |
|---|---|---|---|---|---|
| Conservative | Eddie Freeman* | 2,117 | 43.20 | ||
| Labour | Steve Booton | 2,115 | 43.16 | ||
| Green | Ross Kendall Axe | 239 | 4.88 | ||
| Liberal Democrat | Steven Alan Haynes | 216 | 4.41 | ||
| BNP | Leslie John Orton | 213 | 4.35 | ||
| Majority | 2 | 0.04 | |||
| Turnout | 4,900 | 27.18 | |||
| Conservative hold | Swing | ||||
| Party | Candidate | Votes | % | ± | |
|---|---|---|---|---|---|
| Conservative | Adrian Joseph Delaney* | 2,599 | 41.66 | ||
| Labour Co-op | Chris Hillcox | 2,587 | 41.46 | ||
| Liberal Democrat | Trevor Peter Sword | 402 | 6.44 | ||
| Green | David Owen Williams | 312 | 5.00 | ||
| BNP | John Grainger | 305 | 4.89 | ||
| Majority | 12 | 0.19 | |||
| Turnout | 6,239 | 35.33 | |||
| Conservative hold | Swing | ||||
| Party | Candidate | Votes | % | ± | |
|---|---|---|---|---|---|
| Conservative | Peter Douglas Osborn | 3,639 | 36.05 | ||
| Labour | Christopher Peter Hillcox | 3,575 | 35.42 | ||
| Liberal Democrat | Trevor Peter Sword | 1,694 | 16.78 | ||
| BNP | Trevor John Shearer | 873 | 8.65 | ||
| Green | David Toke | 277 | 2.74 | ||
| Majority | 64 | 0.63 | |||
| Turnout | 10,094 | 57.82 | |||
| Conservative hold | Swing | ||||
2000s
| Party | Candidate | Votes | % | ± | |
|---|---|---|---|---|---|
| Conservative | Eddie Freeman* | 2,389 | 45.51% | ||
| Labour Co-op | Jan Drinkwater | 1,791 | 34.12% | ||
| Liberal Democrat | Gary Davies | 453 | 8.63% | ||
| BNP | Roy Charles Orton | 406 | 7.73% | ||
| Green | Mina Coalter | 198 | 3.77% | ||
| Majority | 598 | 11.4% | |||
| Turnout | 5,249 | 29.95% | |||
| Conservative gain from Labour | Swing | ||||
| Party | Candidate | Votes | % | ± | |
|---|---|---|---|---|---|
| Conservative | Adrian Delaney* | 2,187 | 37% | ||
| Labour Co-op | Mike Drinkwater | 1,860 | 31.5% | ||
| BNP | Norman Ashton | 548 | 9.3% | ||
| Liberal Democrat | Trevor Sword | 534 | 9% | ||
| Independent | Mark Jastrzebski | 264 | 4.5% | ||
| Green | Stuart Masters | 237 | 4% | ||
| Common Good | Dick Rodgers | 198 | 3.3% | ||
| UKIP | David Collin | 83 | 1.4% | ||
| Majority | % | ||||
| Turnout | |||||
| Conservative hold | Swing | ||||
| Party | Candidate | Votes | % | ± | |
|---|---|---|---|---|---|
| Conservative | Peter Douglas Osborn* | 2,207 | 35.9% | ||
| Labour | Michael Drinkwater | 1,873 | 30.5% | ||
| BNP | Julie Ashton | 1,004 | 16.3% | ||
| Liberal Democrat | Trevor Sword | 758 | 12.3% | ||
| Green | David Toke | 307 | 5% | ||
| Majority | % | ||||
| Turnout | |||||
| Conservative hold | Swing | ||||
| Party | Candidate | Votes | % | ± | |
|---|---|---|---|---|---|
| Labour | Jan Drinkwater | 2,001 | 25.8% | ||
| Conservative | Adrian Delaney | 1,971 | 25.4% | ||
| Conservative | Peter Douglas Osborn | 1,971 | 25.4% | ||
| Conservative | Edwin Freeman | 1,957 | 25.4% | ||
| Labour | Peter Mayer | 1,849 | |||
| Labour | Fiona Williams | 1,645 | |||
| Liberal | Raymond Holtom | 1,057 | 13.6% | ||
| Liberal | Marjorie Morrison | 976 | |||
| BNP | Lee Windridge | 947 | 12.2% | ||
| Liberal | John Axe | 900 | |||
| UKIP | David Collin | 986 | 11.5% | ||
| Green | David Toke | 622 | 8% | ||
| Independent | Mark Jastrzebski | 275 | 3.5% | ||
| Majority | |||||
| Turnout | |||||
| Party | Candidate | Votes | % | ± | |
|---|---|---|---|---|---|
| Labour | Ray Holtom* | 1,713 | 37.2% | ||
| Conservative | Adrian Delaney | 1,595 | 34.6% | ||
| BNP | Lee Windridge | 709 | 15.4% | ||
| Liberal Democrat | Steven Tomlin | 593 | 12.9% | ||
| Majority | 2.6% | ||||
| Turnout | 30.6% | ||||
| Labour hold | Swing | ||||
| Party | Candidate | Votes | % | ± | |
|---|---|---|---|---|---|
| Labour | Fiona Williams* | 1,716 | 35.8% | ||
| Conservative | Adrian Delaney | 1,634 | 34.1% | ||
| Independent | Peter Spybey | 573 | 11.9% | ||
| Liberal Democrat | Steven Tomlin | 523 | 10.9% | ||
| BNP | Lee Windridge | 351 | 7.3% | ||
| Majority | 1.7% | ||||
| Turnout | 31.7% | ||||
| Labour hold | Swing | ||||
| Party | Candidate | Votes | % | ± | |
|---|---|---|---|---|---|
| Conservative | % | ||||
| Labour | % | ||||
| Liberal | % | ||||
| Independent | % | ||||
| Majority | % | ||||
| Turnout | |||||
| Party | Candidate | Votes | % | ± | |
|---|---|---|---|---|---|
| Conservative | % | ||||
| Labour | % | ||||
| Liberal | % | ||||
| Independent | % | ||||
| Majority | % | ||||
| Turnout | |||||
1990s
| Party | Candidate | Votes | % | ± | |
|---|---|---|---|---|---|
| Conservative | % | ||||
| Labour | % | ||||
| Liberal | % | ||||
| Independent | % | ||||
| Majority | % | ||||
| Labour gain from Liberal | Swing | ||||
| Conservative hold | Swing | ||||
| Party | Candidate | Votes | % | ± | |
|---|---|---|---|---|---|
| Conservative | % | ||||
| Labour | % | ||||
| Liberal | % | ||||
| Independent | % | ||||
| Majority | % | ||||
| Labour gain from Liberal | Swing | ||||
| Conservative hold | Swing | ||||
| Party | Candidate | Votes | % | ± | |
|---|---|---|---|---|---|
| Conservative | % | ||||
| Labour | % | ||||
| Liberal | % | ||||
| Independent | % | ||||
| Majority | % | ||||
| Labour gain from Liberal | Swing | ||||
| Conservative hold | Swing | ||||
| Party | Candidate | Votes | % | ± | |
|---|---|---|---|---|---|
| Conservative | % | ||||
| Labour | % | ||||
| Liberal | % | ||||
| Independent | % | ||||
| Majority | % | ||||
| Labour gain from Liberal | Swing | ||||
| Conservative hold | Swing | ||||
| Party | Candidate | Votes | % | ± | |
|---|---|---|---|---|---|
| Conservative | % | ||||
| Labour | % | ||||
| Liberal | % | ||||
| Independent | % | ||||
| Majority | % | ||||
| Labour gain from Liberal | Swing | ||||
| Conservative hold | Swing | ||||
| Party | Candidate | Votes | % | ± | |
|---|---|---|---|---|---|
| Conservative | % | ||||
| Labour | % | ||||
| Liberal | % | ||||
| Independent | % | ||||
| Majority | % | ||||
| Labour gain from Liberal | Swing | ||||
| Conservative hold | Swing | ||||
| Party | Candidate | Votes | % | ± | |
|---|---|---|---|---|---|
| Conservative | % | ||||
| Labour | % | ||||
| Liberal | % | ||||
| Independent | % | ||||
| Majority | % | ||||
| Labour gain from Liberal | Swing | ||||
| Conservative hold | Swing | ||||
| Party | Candidate | Votes | % | ± | |
|---|---|---|---|---|---|
| Conservative | % | ||||
| Labour | % | ||||
| Liberal | % | ||||
| Independent | % | ||||
| Majority | % | ||||
| Labour gain from Liberal | Swing | ||||
| Conservative hold | Swing | ||||
| Party | Candidate | Votes | % | ± | |
|---|---|---|---|---|---|
| Conservative | % | ||||
| Labour | % | ||||
| Liberal | % | ||||
| Independent | % | ||||
| Majority | % | ||||
| Labour gain from Liberal | Swing | ||||
| Conservative hold | Swing | ||||
| Party | Candidate | Votes | % | ± | |
|---|---|---|---|---|---|
| Conservative | % | ||||
| Labour | % | ||||
| Liberal | % | ||||
| Independent | % | ||||
| Majority | % | ||||
| Labour gain from Liberal | Swing | ||||
| Conservative hold | Swing | ||||
1980s
| Party | Candidate | Votes | % | ± | |
|---|---|---|---|---|---|
| Conservative | % | ||||
| Labour | % | ||||
| Liberal | % | ||||
| Independent | % | ||||
| Majority | % | ||||
| Labour gain from Liberal | Swing | ||||
| Conservative hold | Swing | ||||
| Party | Candidate | Votes | % | ± | |
|---|---|---|---|---|---|
| Conservative | % | ||||
| Labour | % | ||||
| Liberal | % | ||||
| Independent | % | ||||
| Majority | % | ||||
| Labour gain from Liberal | Swing | ||||
| Conservative hold | Swing | ||||
| Party | Candidate | Votes | % | ± | |
|---|---|---|---|---|---|
| Conservative | % | ||||
| Labour | % | ||||
| Liberal | % | ||||
| Independent | % | ||||
| Majority | % | ||||
| Labour gain from Liberal | Swing | ||||
| Conservative hold | Swing | ||||
| Party | Candidate | Votes | % | ± | |
|---|---|---|---|---|---|
| Conservative | % | ||||
| Labour | % | ||||
| Liberal | % | ||||
| Independent | % | ||||
| Majority | % | ||||
| Labour gain from Liberal | Swing | ||||
| Conservative hold | Swing | ||||
| Party | Candidate | Votes | % | ± | |
|---|---|---|---|---|---|
| Conservative | % | ||||
| Labour | % | ||||
| Liberal | % | ||||
| Independent | % | ||||
| Majority | % | ||||
| Labour gain from Liberal | Swing | ||||
| Conservative hold | Swing | ||||
| Party | Candidate | Votes | % | ± | |
|---|---|---|---|---|---|
| Conservative | % | ||||
| Labour | % | ||||
| Liberal | % | ||||
| Independent | % | ||||
| Majority | % | ||||
| Labour gain from Liberal | Swing | ||||
| Conservative hold | Swing | ||||
| Party | Candidate | Votes | % | ± | |
|---|---|---|---|---|---|
| Conservative | % | ||||
| Labour | % | ||||
| Liberal | % | ||||
| Independent | % | ||||
| Majority | % | ||||
| Labour gain from Liberal | Swing | ||||
| Conservative hold | Swing | ||||
| Party | Candidate | Votes | % | ± | |
|---|---|---|---|---|---|
| Conservative | % | ||||
| Labour | % | ||||
| Liberal | % | ||||
| Independent | % | ||||
| Majority | % | ||||
| Labour gain from Liberal | Swing | ||||
| Conservative hold | Swing | ||||
| Party | Candidate | Votes | % | ± | |
|---|---|---|---|---|---|
| Conservative | % | ||||
| Labour | % | ||||
| Liberal | % | ||||
| Independent | % | ||||
| Majority | % | ||||
| Labour gain from Liberal | Swing | ||||
| Conservative hold | Swing | ||||
| Party | Candidate | Votes | % | ± | |
|---|---|---|---|---|---|
| Conservative | % | ||||
| Labour | % | ||||
| Liberal | % | ||||
| Independent | % | ||||
| Majority | % | ||||
| Labour gain from Liberal | Swing | ||||
| Conservative hold | Swing | ||||
1970s
| Party | Candidate | Votes | % | ± | |
|---|---|---|---|---|---|
| Conservative | % | ||||
| Labour | % | ||||
| Liberal | % | ||||
| Independent | % | ||||
| Majority | % | ||||
| Labour gain from Liberal | Swing | ||||
| Conservative hold | Swing | ||||
| Party | Candidate | Votes | % | ± | |
|---|---|---|---|---|---|
| Conservative | % | ||||
| Labour | % | ||||
| Liberal | % | ||||
| Independent | % | ||||
| Majority | % | ||||
| Labour gain from Liberal | Swing | ||||
| Conservative hold | Swing | ||||
| Party | Candidate | Votes | % | ± | |
|---|---|---|---|---|---|
| Conservative | % | ||||
| Labour | % | ||||
| Liberal | % | ||||
| Independent | % | ||||
| Majority | % | ||||
| Labour gain from Liberal | Swing | ||||
| Conservative hold | Swing | ||||
| Party | Candidate | Votes | % | ± | |
|---|---|---|---|---|---|
| Conservative | % | ||||
| Labour | % | ||||
| Liberal | % | ||||
| Independent | % | ||||
| Majority | % | ||||
| Labour gain from Liberal | Swing | ||||
| Conservative hold | Swing | ||||
| Party | Candidate | Votes | % | ± | |
|---|---|---|---|---|---|
| Conservative | % | ||||
| Labour | % | ||||
| Liberal | % | ||||
| Independent | % | ||||
| Majority | % | ||||
| Labour gain from Liberal | Swing | ||||
| Conservative hold | Swing | ||||
| Party | Candidate | Votes | % | ± | |
|---|---|---|---|---|---|
| Conservative | % | ||||
| Labour | % | ||||
| Liberal | % | ||||
| Independent | % | ||||
| Majority | % | ||||
| Labour gain from Liberal | Swing | ||||
| Conservative hold | Swing | ||||
| Party | Candidate | Votes | % | ± | |
|---|---|---|---|---|---|
| Conservative | % | ||||
| Labour | % | ||||
| Liberal | % | ||||
| Independent | % | ||||
| Majority | % | ||||
| Labour gain from Liberal | Swing | ||||
| Conservative hold | Swing | ||||
| Party | Candidate | Votes | % | ± | |
|---|---|---|---|---|---|
| Conservative | % | ||||
| Labour | % | ||||
| Liberal | % | ||||
| Independent | % | ||||
| Majority | % | ||||
| Labour gain from Liberal | Swing | ||||
| Conservative hold | Swing | ||||
| Party | Candidate | Votes | % | ± | |
|---|---|---|---|---|---|
| Conservative | % | ||||
| Labour | % | ||||
| Liberal | % | ||||
| Independent | % | ||||
| Majority | % | ||||
| Labour gain from Liberal | Swing | ||||
| Conservative hold | Swing | ||||
| Party | Candidate | Votes | % | ± | |
|---|---|---|---|---|---|
| Conservative | % | ||||
| Labour | % | ||||
| Liberal | % | ||||
| Independent | % | ||||
| Majority | % | ||||
| Labour gain from Liberal | Swing | ||||
| Conservative hold | Swing | ||||
1960s
| Party | Candidate | Votes | % | ± | |
|---|---|---|---|---|---|
| Conservative | % | ||||
| Labour | % | ||||
| Liberal | % | ||||
| Independent | % | ||||
| Majority | % | ||||
| Labour gain from Liberal | Swing | ||||
| Conservative hold | Swing | ||||
| Party | Candidate | Votes | % | ± | |
|---|---|---|---|---|---|
| Conservative | % | ||||
| Labour | % | ||||
| Liberal | % | ||||
| Independent | % | ||||
| Majority | % | ||||
| Labour gain from Liberal | Swing | ||||
| Conservative hold | Swing | ||||
| Party | Candidate | Votes | % | ± | |
|---|---|---|---|---|---|
| Conservative | % | ||||
| Labour | % | ||||
| Liberal | % | ||||
| Independent | % | ||||
| Majority | % | ||||
| Labour gain from Liberal | Swing | ||||
| Conservative hold | Swing | ||||
| Party | Candidate | Votes | % | ± | |
|---|---|---|---|---|---|
| Conservative | % | ||||
| Labour | % | ||||
| Liberal | % | ||||
| Independent | % | ||||
| Majority | % | ||||
| Labour gain from Liberal | Swing | ||||
| Conservative hold | Swing | ||||
| Party | Candidate | Votes | % | ± | |
|---|---|---|---|---|---|
| Conservative | % | ||||
| Labour | % | ||||
| Liberal | % | ||||
| Independent | % | ||||
| Majority | % | ||||
| Labour gain from Liberal | Swing | ||||
| Conservative hold | Swing | ||||
| Party | Candidate | Votes | % | ± | |
|---|---|---|---|---|---|
| Conservative | % | ||||
| Labour | % | ||||
| Liberal | % | ||||
| Independent | % | ||||
| Majority | % | ||||
| Labour gain from Liberal | Swing | ||||
| Conservative hold | Swing | ||||
| Party | Candidate | Votes | % | ± | |
|---|---|---|---|---|---|
| Conservative | % | ||||
| Labour | % | ||||
| Liberal | % | ||||
| Independent | % | ||||
| Majority | % | ||||
| Labour gain from Liberal | Swing | ||||
| Conservative hold | Swing | ||||
| Party | Candidate | Votes | % | ± | |
|---|---|---|---|---|---|
| Conservative | % | ||||
| Labour | % | ||||
| Liberal | % | ||||
| Independent | % | ||||
| Majority | % | ||||
| Labour gain from Liberal | Swing | ||||
| Conservative hold | Swing | ||||
| Party | Candidate | Votes | % | ± | |
|---|---|---|---|---|---|
| Conservative | % | ||||
| Labour | % | ||||
| Liberal | % | ||||
| Independent | % | ||||
| Majority | % | ||||
| Labour gain from Liberal | Swing | ||||
| Conservative hold | Swing | ||||
| Party | Candidate | Votes | % | ± | |
|---|---|---|---|---|---|
| Conservative | % | ||||
| Labour | % | ||||
| Liberal | % | ||||
| Independent | % | ||||
| Majority | % | ||||
| Labour gain from Liberal | Swing | ||||
| Conservative hold | Swing | ||||
1950s
| Party | Candidate | Votes | % | ± | |
|---|---|---|---|---|---|
| Conservative | % | ||||
| Labour | % | ||||
| Liberal | % | ||||
| Independent | % | ||||
| Majority | % | ||||
| Labour gain from Liberal | Swing | ||||
| Conservative hold | Swing | ||||
| Party | Candidate | Votes | % | ± | |
|---|---|---|---|---|---|
| Conservative | % | ||||
| Labour | % | ||||
| Liberal | % | ||||
| Independent | % | ||||
| Majority | % | ||||
| Labour gain from Liberal | Swing | ||||
| Conservative hold | Swing | ||||
| Party | Candidate | Votes | % | ± | |
|---|---|---|---|---|---|
| Conservative | % | ||||
| Labour | % | ||||
| Liberal | % | ||||
| Independent | % | ||||
| Majority | % | ||||
| Labour gain from Liberal | Swing | ||||
| Conservative hold | Swing | ||||
| Party | Candidate | Votes | % | ± | |
|---|---|---|---|---|---|
| Conservative | % | ||||
| Labour | % | ||||
| Liberal | % | ||||
| Independent | % | ||||
| Majority | % | ||||
| Labour gain from Liberal | Swing | ||||
| Conservative hold | Swing | ||||
| Party | Candidate | Votes | % | ± | |
|---|---|---|---|---|---|
| Labour | William Henry Milner* | 5,225 | 61.30% | ||
| Conservative | Ernest Frank Scadding | 2,875 | 33.73% | ||
| Liberal | Kenneth Arnold Day | 261 | 3.06% | ||
| Communist | Albert Charles Norton | 163 | 1.91% | ||
| Majority | 2,350 | 27.57% | |||
| Turnout | 39.61% | ||||
| Labour hold | Swing | 5.66% | |||
| Party | Candidate | Votes | % | ± | |
|---|---|---|---|---|---|
| Labour | Edmund John Haynes* | 5,702 | 68.62% | ||
| Conservative | Amy Kathleen Whitehouse | 2,471 | 29.74% | ||
| Communist | Albert Charles Norton | 136 | 1.64% | ||
| Majority | 3,231 | 38.88% | |||
| Turnout | 40.82% | ||||
| Labour hold | Swing | 3.41% | |||
| Party | Candidate | Votes | % | ± | |
|---|---|---|---|---|---|
| Labour | Bertha Hardy Briggs* | 5,119 | 66.03%% | ||
| Conservative | Lillian Louisa Budd | 2,634 | 33.97% | ||
| Majority | 2,565 | 32.06% | |||
| Turnout | 40.28% | ||||
| Labour hold | Swing | 6.96% | |||
| Party | Candidate | Votes | % | ± | |
|---|---|---|---|---|---|
| Labour | William Henry Milner* | 6,618 | 72.99% | ||
| Conservative | Dudley Thomas Scandrett | 2,449 | 27.01% | ||
| Majority | 4,169 | 45.98% | |||
| Turnout | 51.56% | ||||
| Labour hold | Swing | 13.59% | |||
| Party | Candidate | Votes | % | ± | |
|---|---|---|---|---|---|
| Labour | Edmund John Haynes* | 4,352 | 59.40% | ||
| Conservative | Dudley Thomas Scandrett | 2,975 | 40.60% | ||
| Majority | 1,377 | 18.80% | |||
| Turnout | 43.21% | ||||
| Labour hold | Swing | 5.53% | |||
| Party | Candidate | Votes | % | ± | |
|---|---|---|---|---|---|
| Labour | Bertha Hardy Briggs | 4,815 | 63.46% | ||
| Labour | William Henry Milner | 4,623 | % | ||
| Labour | Edmund John Haynes | 4,611 | % | ||
| Conservative | John Alfred Gopsill | 2,550 | 33.61% | ||
| Conservative | William Henry Rathbone | 2,533 | % | ||
| Conservative | Dudley Thomas Scandrett | 2,496 | % | ||
| Communist | John Watson Elder | 222 | 2.93% | ||
| Communist | Daisy Edith Vaughan | 210 | |||
| Majority | 2,265 | 29.85% | |||
| Majority | 2,073 | % | |||
| Majority | 2,061 | % | |||
| Turnout | 7,644 | 45.59% | |||
See also
References
Notes
- ↑ Birmingham City Council: Weoley Ward
- ↑ Birmingham City Council: Ward Information
- ↑ Birmingham City Council: Population in Birmingham
- ↑ Phillips (2003), Birmingham Votes: 1911-2000, p. 51.
- ↑ Birmingham City Council: Elections: Weoley Ward 2016
- ↑ Birmingham City Council: Elections: Ward-by-ward local elections electorate 2016
- ↑ Birmingham City Council: Elections: Weoley Ward 2015
- ↑ Birmingham City Council: Elections: Ward-by-ward local elections electorate 2015
- ↑ Birmingham City Council: Local Election Results 2014
- ↑ B31 Voices
- ↑ Birmingham City Council: Local Election Results 2012
- ↑ Birmingham City Council: Local Election Results 2011
- ↑ Birmingham City Council: Local Election Results 2010
- ↑ Local Elections Archive Project
- ↑ Local Elections Archive Project
- ↑ Local Elections Archive Project
- ↑ Local Elections Archive Project
- ↑ Local Elections Archive Project
- ↑ Rallings (2003), Local Elections Handbook 2003, p. 22.
- ↑ Local elections archive Project
- ↑ Rallings (2002), Local Elections Handbook 2002, p. 61.
Bibliography
- Phillips, Christopher (2000), Birmingham Votes: 1911-2000, Twentieth Century Local Election Results, Volume 4, (Local Government Chronicle Elections Centre, University of Plymouth, Plymouth), ISBN 0-948858-30-3
- Rallings, Colin; Thrasher, Michael (2002), Local Elections Handbook 2002: The 2002 Local Election Results, (Local Government Chronicle Elections Centre, University of Plymouth, Plymouth), ISBN 0-948858-33-8 Cite uses deprecated parameter
|coauthors=(help) - Rallings, Colin; Thrasher, Michael (2003), Local Elections Handbook 2003: The 2003 Local Election Results, (Local Government Chronicle Elections Centre, University of Plymouth, Plymouth), ISBN 0-948858-35-4 Cite uses deprecated parameter
|coauthors=(help)
External links
Birmingham council constituencies and wards | ||
| Edgbaston | 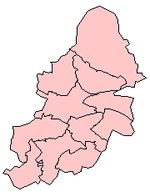 | |
| Erdington | ||
| Hall Green | ||
| Hodge Hill | ||
| Ladywood | ||
| Northfield | ||
| Perry Barr | ||
| Selly Oak | ||
| Sutton Coldfield | ||
| Yardley | ||