Usage share of web browsers
The usage share of web browsers is the proportion, often expressed as a percentage, of visitors to a group of web sites that use a particular web browser. Web browser usage share varies from region to region as well as through time. Depending on how "usage share" is defined, the results can vary greatly. In particular, page views versus unique visits will produce different results.
Accuracy
Measuring browser usage in the number of requests (page hits) made by each user agent can be misleading.
Overestimation
Not all requests are generated by a user, as a user agent can make requests at regular time intervals without user input. In this case, the user's activity might be overestimated. Some examples:
- Certain anti-virus products fake their user agent string to appear to be popular browsers. This is done to trick attack sites that might display clean content to the scanner, but not to the browser. The Register reported in June 2008 that traffic from AVG Linkscanner, using an IE6 user agent string, outstripped human link clicks by nearly 10 to 1.[2]
- A user who revisits a site shortly after changing or upgrading browsers may be double-counted under some methods; overall numbers at the time of a new version's release may be skewed.[3]
- Occasionally websites are written in such a way that they effectively block certain browsers. One common reason for this is that the website has been tested to work with only a limited number of browsers, and so the site owners enforce that only tested browsers are allowed to view the content, while all other browsers are sent a "failure" message, and instruction to use another browser.[4] Many of the untested browsers may still be otherwise capable of rendering the content. Sophisticated users who are aware of this may then "spoof" the user agent string in order to gain access to the site.
- The browsers Firefox, Chrome, Safari, and Opera will under some circumstances fetch resources before they need to render them, so that the resources can be used faster if they are needed. This technique, prerendering or pre-loading, may inflate the statistics for the browsers using it because of pre-loading of resources which are not used in the end.[5]
Underestimation
It is also possible to underestimate the usage share by using the number of requests, for example:
- Firefox 1.5 (and other Gecko-based browsers) and later versions, use fast Document Object Model (DOM) caching. JavaScript is only executed on pageload from net or disk cache, but not if it is loaded from DOM cache. This can affect JavaScript-based tracking of browser statistics.[6]
- While most browsers generate additional page hits by refreshing web pages when the user navigates back through page history, some browsers (such as Opera) reuse cached content without resending requests to the server.[7][8]
- Generally, the more faithfully a browser implements HTTP's cache specifications, the more it will be under-reported relative to browsers that implement those specifications poorly.[8]
- Browser users may run site, cookie and JavaScript blockers which cause those users to be under-counted. For example, common AdBlock blocklists such as EasyBlock include sites such as StatCounter in their privacy lists, and NoScript blocks all JavaScript by default. addons.mozilla.org reports 15.0 million users of AdBlock variants and 2.2 million users of NoScript.
- Users behind a caching proxy (e.g. Squid) may have repeat requests for certain pages served to the browser from the cache, rather than retrieving it again from the Internet.
User agent spoofing
Websites often include code to detect browser version to adjust the page design sent according to the user agent string received. This may mean that less-popular browsers are not sent complex content (even though they might be able to deal with it correctly) or, in extreme cases, refused all content.[9] Thus, various browsers have a feature to cloak or spoof their identification to force certain server-side content.
- Default user agent strings of most browsers have pieces of strings from one or more other browsers, so that if the browser is unknown to a website, it can be identified as one of those. For example, Safari has not only “Mozilla/5.0”, but also “KHTML” (from which Safari’s WebKit was forked) and “Gecko” (the engine of Firefox).
- Some Ubuntu Linux browsers identify themselves as Safari in order to aid compatibility.[10]
Differences in measurement
Net Applications, in their NetMarketShare report, uses unique visitors to measure web usage.[11] This has the effect that users visiting a site ten times will only be counted once by these sources, while they are counted ten times by statistics companies that measure page hits.
To supplement statistics from their unique visitors measurements Net Applications uses country-level weighting.[12] The goal of weighting countries based on their usage is to combat selection area based sampling bias caused by discrepancies in the percentage of tracked hits in the sample and the percentage of global usage documented by third party sources caused by the heavier levels of market usage.[13]
Statistics from the United States government's Digital Analytics Program (DAP) clearly do not represent world-wide usage patterns, although at least one expert considers it the most reliable US data source.[14] DAP uses raw data from a unified Google Analytics account.
Summary tables
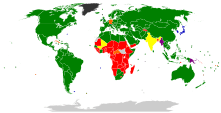
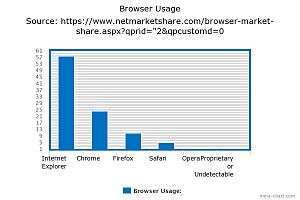
According to StatCounter, as of January 2016, Chrome is not only the most popular browser on phones (or phones plus tablets)[15] (while for tablet only browsing, Safari on iPad has 61.13%[16] share, followed by Chrome, that inherited its engine and web standard support; Safari is not available for Android); when counting across all platforms, Chrome is also the most popular and if only desktop platforms are counted, it has more than half of that market.[17] No desktop browser has had a clear majority for a long time, since Internet Explorer lost it and Netscape before it. Other statistics/analysts show similar numbers except for NetApplications, which shows Internet Explorer ranked first at 46.09% (with Chrome second at 35.1%) and Safari as the most popular mobile browser.
The following tables summarize the usage share of all browsers for the indicated months. For the "all browsers" stats, since all Apple Inc.'s platforms use the Safari browser, including macOS and iOS (such as in iPhone and iPad) with the WebKit engine, Safari's percentage is counting all these users.[18]
| Source | Chrome | Safari | Firefox | UC Browser | Opera | Others |
|---|---|---|---|---|---|---|
| StatCounter | 49.82% | 13.61% | 7.78% | 6.67% | 5.71% | 2.43% |
| Source | Chrome | IE + Edge | Firefox | Safari | Opera | Others |
|---|---|---|---|---|---|---|
| NetMarketShare | 53.97% | 32.54% | 7.69% | 4.28% | 1.14% | 0.17% |
| Source | Chrome + Android |
Internet Explorer |
Firefox | Safari | Opera |
Others |
|---|---|---|---|---|---|---|
| StatCounter | 50.25% | 12.88% | 10.72% | 13.39% | 5.16%†† | 7.6% |
| Source | Chrome + Android |
Internet Explorer |
Firefox | Safari | Opera |
Others |
|---|---|---|---|---|---|---|
| Wikimedia | 47.07% | 11.06% | 15.43% | 20.47% | 2.17% | 3.8%† |
| StatCounter | 50.15% | 13.75% | 11.56% | 13.8% | 3.79%†† | 6.95% |
| Source | Chrome + Android |
Internet Explorer |
Firefox | Safari | Opera |
Others |
|---|---|---|---|---|---|---|
| StatCounter | 48.0% | 15.21% | 11.27% | 14.0% | 3.87%†† | 7.63% |
| Wikimedia | 46.42% | 10.67% | 14.97% | 21.73% | 2.33% | 3.88%† |
The following tables summarize the usage share of desktop web browsers for the indicated months.
| Source | Chrome | Internet Explorer |
Firefox | Safari | Edge |
Others |
|---|---|---|---|---|---|---|
| Net Applications | 54.99% | 23.13% | 11.4% | 3.69% | 5.26% | 1.79% |
| StatCounter | 63.19% | 9.73% | 14.59% | 5.29% | 3.06% | 4.15% |
| W3Counter | 57.1% | 8.0% | 10.4% | 15.4% | 1.9% | 4.4% |
Note†: Percentages are found by only looking at the "Browsers, non mobile" list. Until August 2014 Wikimedia did not detect Internet Explorer 11 and figures for that browser were recorded as "Other".[19]
Note††: The Opera browser uses the same Blink engine as Chrome. It is possible that some of Opera's stats are combined with Chrome's stats or recorded as Other.[20]
Crossover to mobile more popular
According to StatCounter web use statistics (a proxy for all use), in the week from 7–13 November 2016, "mobile" (meaning smartphones) alone (without tablets) overtook desktop, for the first time, with them highest ranked at 48.13%.[21] Since 27 October, the desktop hasn't shown majority, not even on weekdays.
Previously according to StatCounter press release, the world has turned desktop-minority;[22] as of October 2016, at about 49% desktop use for that month. The two biggest continents, Asia and Africa, have been mobile-majority for a while. A few countries in Europe and South America have also followed this trend of being mobile-majority.
In March 2015, for the first time in the US the number of mobile-only adult internet users exceeded the number of desktop-only internet users with 11.6% of the digital population only using mobile compared to 10.6% only using desktop; this also means the majority, 78%, use both desktop and mobile to access the internet.[23]
Historical usage share
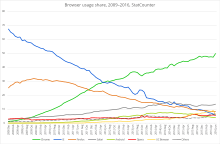
StatCounter (July 2008 to present)
.svg.png)
StatCounter statistics are directly derived from hits (not unique visitors) from 3 million sites using StatCounter totaling more than 15 billion hits per month.[24] No weightings are used.
Desktop and mobile browser usage
StatCounter reports desktop (including laptop) and mobile browser share separately. For consistency, each desktop browser share has been reduced by multiplying it by the current overall desktop share versus mobile. Similarly, mobile browser shares have each been multiplied by the overall mobile percentage. This avoids having greater than 100% usage share when combining mobile and desktop.
| Date |
Internet Explorer [Note 1] |
Chrome | Firefox | Safari | Opera | Android | Mobile Total | ||||
|---|---|---|---|---|---|---|---|---|---|---|---|
| Desktop+Laptop | Mobile | Total | Desktop+Laptop | Mobile | Total | ||||||
| July 2013 | 20.27% | 36.29% | 16.60% | 7.10% | 4.27% | 11.37% | 1.01% | 2.73% | 3.74% | 4.97% | 17.35% |
| June 2013 | 21.35% | 35.82% | 16.79% | 7.04% | 3.79% | 10.83% | 1.03% | 2.28% | 3.31% | 4.66% | 16.08% |
| May 2013 | 23.67% | 35.66% | 16.87% | 6.80% | 3.67% | 10.55% | 0.87% | 2.13% | 3.00% | 4.45% | 14.62% |
| April 2013 | 25.58% | 33.71% | 17.27% | 6.89% | 3.76% | 10.65% | 0.85% | 2.26% | 3.11% | 4.30% | 13.90% |
| March 2013 | 25.08% | 32.88% | 17.86% | 7.28% | 3.90% | 11.18% | 1.00% | 2.24% | 3.24% | 4.43% | 14.44% |
| February 2013 | 25.54% | 31.96% | 18.28% | 7.37% | 3.89% | 11.26% | 1.04% | 2.21% | 3.25% | 4.53% | 14.35% |
| January 2013 | 26.37% | 31.51% | 18.39% | 7.12% | 3.64% | 10.76% | 1.02% | 2.17% | 3.19% | 4.36% | 14.13% |
| July 2012 | 28.49% | 30.06% | 21.01% | 6.33% | 2.77% | 9.10% | 1.53% | 2.15% | 3.68% | 2.57% | 11.09% |
| January 2012 | 34.27% | 25.99% | 22.68% | 6.06% | 1.92% | 7.98% | 1.78% | 2.06% | 3.84% | 1.71% | 8.49% |
| July 2011 | 39.47% | 20.59% | 25.99% | 4.81% | 1.40% | 6.21% | 1.54% | 1.54% | 3.08% | 1.28% | 7.02% |
| June 2011 | 40.73% | 19.30% | 26.49% | 4.74% | 1.63% | 6.53% | |||||
- ↑ StatCounter reports desktop and mobile browser share separately; we report them together. For consistency, each desktop browser share has been reduced by multiplying it by the current overall desktop share versus mobile. Similarly, mobile browser shares have each been multiplied by the overall mobile percentage.
| Date |
Internet Explorer |
Chrome |
Firefox |
Safari |
Opera |
Mobile |
|---|---|---|---|---|---|---|
| February 2015 | 18.91% | 48.71% | 16.53% | 10.21% | 1.63% | 32.98% |
| January 2015 | 19.28% | 48.15% | 16.96% | 10.28% | 1.58% | 33.24% |
| December 2014 | 22.30% | 46.13% | 16.34% | 10.30% | N/A | 34.03% |
| November 2014 | 19.60% | 48.06% | 16.74% | 10.63% | N/A | 33.74% |
| October 2014 | 19.30% | 47.63% | 17.04% | 10.99% | N/A | 32.83% |
| September 2014 | 20.46% | 45.58% | 17.44% | 11.21% | 1.39% | 31.50% |
| August 2014 | 20.31% | 46.26% | 17.50% | 10.81% | 1.47% | 30.64% |
| July 2014 | 21.38% | 45.28% | 17.52% | 10.60% | 1.39% | 29.48% |
| June 2014 | 20.98% | 45.46% | 17.95% | 10.30% | 1.37% | 28.49% |
| May 2014 | 20.79% | 45.60% | 18.74% | 10.01% | 1.34% | 27.04% |
| April 2014 | 21.43% | 45.22% | 18.62% | 9.79% | 1.39% | 25.02% |
| March 2014 | 22.58% | 43.66% | 18.75% | 9.91% | 1.38% | 25.42% |
| February 2014 | 22.49% | 43.89% | 19.21% | 9.74% | 1.34% | 24.68% |
| January 2014 | 22.85% | 43.67% | 18.90% | 9.73% | 1.30% | 23.77% |
| December 2013 | 23.24% | 43.92% | 18.95% | 9.14% | 1.31% | 23.41% |
| November 2013 | 27.31% | 41.87% | 18.15% | 8.50% | 1.18% | 20.04% |
| October 2013 | 28.96% | 40.44% | 18.11% | 8.54% | 1.20% | 19.71% |
| September 2013 | 28.56% | 40.80% | 18.36% | 8.52% | 1.16% | 17.81% |
| August 2013 | 25.55% | 42.78% | 19.25% | 8.57% | 1.16% | 18.00% |
| July 2013 | 24.53% | 43.12% | 20.09% | 8.59% | 1.10% | 17.35% |
| June 2013 | 25.44% | 42.68% | 20.01% | 8.39% | 1.03% | 16.08% |
| May 2013 | 27.72% | 41.38% | 19.76% | 7.96% | 1.00% | 14.62% |
| April 2013 | 29.71% | 39.15% | 20.06% | 8.00% | 1.01% | 13.90% |
| March 2013 | 29.30% | 38.07% | 20.87% | 8.60% | 1.17% | 14.44% |
| February 2013 | 29.82% | 37.09% | 21.34% | 8.60% | 1.22% | 14.35% |
| January 2013 | 30.71% | 36.52% | 21.42% | 8.29% | 1.19% | 14.13% |
| July 2012 | 32.04% | 33.81% | 23.73% | 7.12% | 1.72% | 11.09% |
| January 2012 | 37.45% | 28.40% | 24.78% | 6.62% | 1.95% | 8.49% |
| July 2011 | 42.45% | 22.14% | 27.95% | 5.17% | 1.66% | 7.02% |
| January 2011 | 46.00% | 15.68% | 30.68% | 5.09% | 2.00% | 4.30% |
| July 2010 | 52.68% | 9.88% | 30.69% | 4.09% | 1.91% | 2.86% |
| January 2010 | 55.25% | 6.04% | 31.64% | 3.76% | 2.00% | 1.56% |
| July 2009 | 60.11% | 3.01% | 30.50% | 3.02% | 2.64% | 1.05% |
| January 2009 | 65.41% | 1.38% | 27.03% | 2.57% | 2.92% | 0.67% |
| July 2008 | 68.57% | 26.14% | 3.30% | 1.78% |
W3Counter (May 2007 to present)
This site counts the last 15,000 page views from each of approximately 80,000 websites. This limits the influence of sites with more than 15,000 monthly visitors on the usage statistics. W3Counter is not affiliated with the World Wide Web Consortium (W3C).
| Date | Internet Explorer | Firefox | Google Chrome | Safari | Opera | Other Mozilla |
|---|---|---|---|---|---|---|
| April 2016 | 9.6% | 9.7% | 57.2% | 13.4% | 4.1% | |
| March 2016 | 14.3% | 10.0% | 51.9% | 16.2% | 2.7% | |
| February 2016 | 12.4% | 12.0% | 47.5% | 20.1% | 3.1% | |
| January 2016 | 12.3% | 11.4% | 47.3% | 20.7% | 3.2% | |
| December 2015 | 13.2% | 11.4% | 47.0% | 20.2% | 3.3% | |
| November 2015 | 13.2% | 11.6% | 46.1% | 21.1% | 3.0% | |
| October 2015 | 13.9% | 11.8% | 45.1% | 20.8% | 3.1% | |
| September 2015 | 13.7% | 12.5% | 45.5% | 19.9% | 3.1% | |
| August 2015 | 13.5% | 13.4% | 46.9% | 16.6% | 3.7% | |
| July 2015 | 13.6% | 13.3% | 46.5% | 16.5% | 3.9% | |
| June 2015 | 13.4% | 14.4% | 45.8% | 16.2% | 3.3% | |
| May 2015 | 15.6% | 14.2% | 44.5% | 16.1% | 3.3% | |
| April 2015 | 16.3% | 14.5% | 43.7% | 15.9% | 3.1% | |
| March 2015 | 16.1% | 14.6% | 43.9% | 15.7% | 3.2% | |
| February 2015 | 16.9% | 14.8% | 42.8% | 15.5% | 3.2% | |
| January 2015 | 17.2% | 15.1% | 43.0% | 15.2% | 3.1% | |
| December 2014 | 17.6% | 15.6% | 42.5% | 14.6% | 3.2% | |
| November 2014 | 15.6% | 16.4% | 42.7% | 15.0% | 3.3% | |
| October 2014 | 17.9% | 16.0% | 40.8% | 15.2% | 3.3% | |
| September 2014 | 18.2% | 16.3% | 40.0% | 15.4% | 3.2% | |
| August 2014 | 21.1% | 15.5% | 38.0% | 15.5% | 3.2% | |
| July 2014 | 21.2% | 15.2% | 38.5% | 15.4% | 3.1% | |
| June 2014 | 19.0% | 16.8% | 38.0% | 16.0% | 3.2% | |
| May 2014 | 19.1% | 17.6% | 37.0% | 16.7% | 3.0% | |
| April 2014 | 18.0% | 18.5% | 37.1% | 17.0% | 2.8% | |
| March 2014 | 18.3% | 18.1% | 37.2% | 16.6% | 2.9% | |
| February 2014 | 19.6% | 18.3% | 36.4% | 16.7% | 2.6% | |
| January 2014 | 20.3% | 18.3% | 34.2% | 17.8% | 2.7% | |
| December 2013 | 21.9% | 18.0% | 33.7% | 16.9% | 2.8% | |
| November 2013 | 25.8% | 16.4% | 32.7% | 13.1% | 2.3% | |
| October 2013 | 27.8% | 16.0% | 30.8% | 13.1% | 2.3% | |
| September 2013 | 25.2% | 16.8% | 31.4% | 14.3% | 2.4% | |
| August 2013 | 24.0% | 17.8% | 31.8% | 14.2% | 2.4% | |
| July 2013 | 22.2% | 18.5% | 32.3% | 14.7% | 2.3% | |
| June 2013 | 21.7% | 19.5% | 32.6% | 15.4% | 2.2% | |
| May 2013 | 22.0% | 19.2% | 32.3% | 14.8% | 2.2% | |
| April 2013 | 23.1% | 20.7% | 31.5% | 15.1% | 2.3% | |
| March 2013 | 24.6% | 19.3% | 30.3% | 16.3% | 2.3% | |
| February 2013 | 26.6% | 19.7% | 29.3% | 15.4% | 2.4% | |
| January 2013 | 27.5% | 20.0% | 30.0% | 14.8% | 2.3% | |
| July 2012 | 28.6% | 23.1% | 28.3% | 13.3% | 2.2% | |
| January 2012 | 30.9% | 24.8% | 24.6% | 6.5% | 2.5% | |
| July 2011 | 35.6% | 27.7% | 19.6% | 6.4% | 2.3% | |
| January 2011 | 40.0% | 31.1% | 14.2% | 5.9% | 2.0% | |
| July 2010 | 44.4% | 31.4% | 9.8% | 1.9% | 2.1% | |
| January 2010 | 49.7% | 32.3% | 6.3% | 5.4% | 2.1% | |
| 31 July 2009 | 53.1% | 31.7% | 3.3% | 4.6% | 1.8% | 1.1% |
| 31 January 2009 | 58.4% | 31.1% | 2.7% | 2.0% | 1.1% | |
| 31 July 2008 | 60.9% | 29.7% | 2.4% | 2.0% | 1.0% | |
| 31 January 2008 | 62.2% | 28.7% | 2.7% | 2.0% | 0.52% | |
| 30 July 2007 | 66.9% | 25.1% | 2.2% | 1.8% | 0.67% | |
| 30 May 2007 | 67.1% | 24.8% | 2.4% | 1.8% | 0.68% | |
| Date | Internet Explorer | Firefox | Google Chrome | Safari | Opera | Other Mozilla |
Net Applications (2004 Q4 to present)
Net Applications bases its usage share on statistics from 40,000 websites having around 160 million unique visitors per month. The mean site has 1300 unique visitors per day.
On 1 August 2009, Net Applications began weighing its raw data based on the number of internet users in the countries concerned, using data from the CIA ; the changes were applied retroactively to older data, starting with November 2007.[25] Quarterly data prior to Q1 2008, is reported with a different methodology compared to quarterly data starting with Q1 2008, so combining these data sets and/or using them as the basis for identifying historical trends could result in flawed information.
*Net Applications no longer reports data prior to November 2007 because of this change in methodology.
| Period |
Internet Explorer |
Firefox |
Chrome |
Safari |
Opera |
Other |
|---|---|---|---|---|---|---|
| 2015 Q1 | 57.78% | 11.75% | 24.11% | 4.93% | 1.02% | 0.33% |
| 2014 Q2 | 58.14% | 18.34% | 16.45% | 5.55% | 1.11% | 0.27% |
| 2014 Q1 | 58.10% | 17.62% | 16.95% | 5.71% | 1.23% | 0.30% |
| 2013 Q4 | 58.15% | 18.53% | 15.71% | 5.85% | 1.38% | 0.38% |
| 2013 Q3 | 57.37% | 18.59% | 16.52% | 5.61% | 1.49% | 0.42% |
| 2013 Q2 | 55.89% | 20.04% | 16.42% | 5.46% | 1.69% | 0.50% |
| 2013 Q1 | 55.58% | 20.09% | 16.76% | 5.32% | 1.77% | 0.48% |
| 2012 Q4 | 54.56% | 20.07% | 17.95% | 5.26% | 1.67% | 0.49% |
| 2012 Q3 | 53.52% | 19.87% | 19.44% | 5.07% | 1.57% | 0.53% |
| 2012 Q2 | 54.05% | 19.98% | 19.18% | 4.71% | 1.60% | 0.48% |
| 2012 Q1 | 53.16% | 20.80% | 18.83% | 5.03% | 1.67% | 0.51% |
| 2011 Q4 | 52.32% | 22.10% | 18.43% | 5.09% | 1.60% | 0.46% |
| 2011 Q3 | 55.29% | 22.63% | 15.28% | 4.74% | 1.69% | 0.37% |
| Period |
Internet Explorer |
Firefox |
Chrome |
Safari |
Opera |
Opera Mini |
Netscape |
Other Mozilla |
|---|---|---|---|---|---|---|---|---|
| 2011 Q2 | 54.36% | 21.67% | 12.51% | 7.30% | 1.97% | 1.21% | 0.79% | 0.03% |
| 2011 Q1 | 56.19% | 22.11% | 11.07% | 6.43% | 2.20% | 1.02% | 0.75% | 0.03% |
| 2010 Q4 | 58.27% | 22.80% | 9.23% | 5.59% | 2.24% | 0.96% | 0.67% | 0.03% |
| 2010 Q3 | 60.29% | 22.93% | 7.53% | 5.17% | 2.40% | 0.88% | 0.52% | 0.02% |
| 2010 Q2 | 60.01% | 24.24% | 7.00% | 4.78% | 2.33% | 0.73% | 0.49% | 0.12% |
| 2010 Q1 | 61.43% | 24.40% | 5.67% | 4.55% | 2.37% | 0.61% | 0.52% | 0.15% |
| 2009 Q4 | 63.67% | 24.46% | 4.04% | 4.41% | 2.29% | 0.45% | 0.32% | 0.11% |
| 2009 Q3 | 66.80% | 23.06% | 2.86% | 4.13% | 2.07% | 0.30% | 0.50% | 0.09% |
| 2009 Q2 | 68.06% | 23.00% | 2.13% | 3.67% | 2.05% | 0.25% | 0.68% | 0.06% |
| 2009 Q1 | 69.13% | 22.67% | 1.56% | 3.58% | 2.18% | 0.23% | 0.51% | 0.06% |
| 2008 Q4 | 71.99% | 20.78% | 1.16% | 3.11% | 2.15% | 0.24% | 0.41% | 0.07% |
| 2008 Q3 | 74.93% | 19.07% | 0.37% | 2.73% | 2.06% | 0.23% | 0.43% | 0.07% |
| 2008 Q2 | 76.24% | 18.16% | 2.73% | 1.97% | 0.20% | 0.48% | 0.08% | |
| 2008 Q1 | 77.83% | 16.86% | 2.65% | 1.84% | 0.17% | 0.41% | 0.13% | |
| *2007 Q4 | *79.16% | *15.84% | *2.39% | *1.78% | *0.12% | *0.50% | *0.09% | |
| *2007 Q3 | *78.85% | *14.69% | *4.80% | *0.51% | *0.76% | *0.11% | ||
| *2007 Q2 | *78.76% | *14.92% | *4.66% | *0.46% | *0.83% | *0.15% | ||
| *2007 Q1 | *79.38% | *14.35% | *4.70% | *0.50% | *0.77% | *0.19% | ||
| *2006 Q4 | *80.69% | *13.50% | *4.06% | *0.56% | *0.86% | *0.23% | ||
| *2006 Q3 | *82.88% | *11.89% | *3.30% | *0.62% | *0.88% | *0.26% | ||
| *2006 Q2 | *84.03% | *10.67% | *3.25% | *0.57% | *0.98% | *0.32% | ||
| *2006 Q1 | *85.01% | *9.77% | *3.10% | *0.53% | *1.09% | *0.36% | ||
| *2005 Q4 | *85.88% | *9.00% | *2.80% | *0.54% | *1.25% | *0.43% | ||
| *2005 Q3 | *86.74% | *7.97% | *2.24% | *0.55% | *1.92% | *0.48% | ||
| *2005 Q2 | *87.24% | *8.08% | *1.89% | *0.52% | *1.62% | *0.59% | ||
| *2005 Q1 | *89.02% | *6.17% | *1.70% | *0.49% | *1.89% | *0.67% | ||
| *2004 Q4 | *91.35% | *3.66% | *1.50% | *0.51% | *2.09% | *0.80% | ||
| Period |
Internet Explorer |
Firefox |
Chrome |
Safari |
Opera |
Opera Mini |
Netscape |
Other Mozilla |
Note: * indicates data generated prior to Net Applications' November 2007 change in methodology. See note above.
Wikimedia (April 2009 to present)
Wikimedia traffic analysis reports are based on server logs of about 4 billion page requests per month, based on the user agent information that accompanied the requests.[26] These server logs cover requests to all the Wikimedia Foundation projects, including Wikipedia, Wikimedia Commons, Wiktionary, Wikibooks, Wikiquote, Wikisource, Wikinews, Wikiversity and others.[27]
Note†: Wikimedia has recently had a large percentage of unrecognised browsers, previously counted as Firefox, that are now assumed to be Internet Explorer 11 fixed in the February 2014 and later numbers. And February 2014 numbers include mobile for Internet Explorer and Firefox (not included in Android). Chrome does not include the mobile numbers (Android does).
| Period | Chrome |
Firefox |
Internet Explorer |
Safari | Opera | Android |
Mobile Total | ||||
|---|---|---|---|---|---|---|---|---|---|---|---|
| Desktop | Mobile | Total | Desktop | Mobile | Total | ||||||
| March 2015 | 29.61% | 14.23% | 10.86% | 2.97% | 16.68% | 19.65% | 0.65% | 1.41% | 2.06% | 17.45% | 38.37% |
| February 2014 | 27.94% | 12.00% | 17.01% | 3.83% | 17.97% | 21.80% | 1.50% | 1.27% | 2.77% | 12.59% | 35.03% |
| January 2014 | 27.32% | 18.15% | 11.78% | 3.88% | 19.41% | 23.29% | 1.51% | 1.32% | 2.83% | 12.89% | 35.01% |
| December 2013 | 30.70% | 17.90% | 11.48% | 3.45% | 18.03% | 21.48% | 1.54% | 1.32% | 2.86% | 11.52% | 32.20% |
| November 2013 | 35.04% | 17.37% | 13.80% | 2.52% | 15.17% | 17.69% | 1.49% | 1.16% | 2.65% | 9.45% | 26.99% |
| October 2013 | 33.93% | 16.12% | 15.46% | 2.36% | 14.34% | 16.70% | 1.53% | 1.17% | 2.70% | 9.00% | 26.32% |
| August 2013 | 31.07% | 17.17% | 15.98% | 2.69% | 15.92% | 18.61% | 1.87% | 1.14% | 3.01% | 9.18% | 28.25% |
| July 2013 | 32.33% | 16.90% | 15.65% | 2.63% | 15.66% | 18.29% | 2.06% | 1.18% | 3.24% | 8.56% | 27.38% |
| June 2013 | 35.16% | 17.83% | 15.93% | 2.37% | 13.13% | 15.50% | 2.18% | 1.10% | 3.28% | 6.45% | 22.32% |
| May 2013 | 35.23% | 17.79% | 16.99% | 2.19% | 12.63% | 14.82% | 2.41% | 1.14% | 3.55% | 6.32% | 21.83% |
| April 2013 | 34.16% | 18.16% | 16.95% | 2.31% | 13.61% | 15.92% | 2.42% | 1.18% | 3.60% | 6.55% | 23.13% |
| March 2013 | 33.22% | 16.28% | 17.03% | 4.34% | 13.59% | 17.93% | 2.55% | 1.18% | 3.73% | 6.51% | 23.13% |
| February 2013 | 32.21% | 16.80% | 18.27% | 4.56% | 13.06% | 17.62% | 2.57% | 1.21% | 3.78% | 6.25% | 22.44% |
| January 2013 | 31.34% | 17.61% | 18.68% | 4.64% | 12.66% | 17.30% | 2.72% | 1.16% | 3.88% | 6.01% | 21.71% |
| July 2012 | 27.20% | 19.23% | 23.70% | 4.88% | 10.60% | 15.48% | 3.00% | 1.50% | 4.50% | 4.55% | 18.19% |
| January 2012 | 22.20% | 22.30% | 29.51% | 5.87% | 7.58% | 13.45% | 3.94% | 1.21% | 5.15% | 3.21% | 13.40% |
| July 2011 | 16.81% | 24.98% | 36.78% | 5.44% | 5.31% | 10.75% | 3.32% | 0.90% | 4.22% | 1.71% | 9.80% |
| January 2011 | 11.75% | 28.71% | 41.56% | 5.53% | 3.73% | 9.26% | 3.55% | 0.70% | 4.25% | 0.90% | 6.90% |
| Period |
Internet Explorer |
Firefox |
Chrome |
Safari |
Opera |
Other Mozilla |
Mobile |
|---|---|---|---|---|---|---|---|
| December 2010 | 42.12% | 28.82% | 11.18% | 5.70% | 3.67% | 0.52% | 6.4% |
| July 2010 | 47.74% | 30.43% | 7.52% | 5.18% | 2.89% | 0.53% | 4.5% |
| January 2010 | 51.01% | 30.85% | 4.81% | 5.13% | 3.18% | 0.56% | 3.1% |
| July 2009 | 54.55% | 31.52% | 2.77% | 4.51% | 2.38% | 0.70% | 2.4% |
| April 2009 | 57.37% | 30.71% | 1.93% | 3.86% | 2.57% | 0.68% | 1.9% |
Older reports
Clicky (September 2009 to August 2013)
| Period |
Internet Explorer |
Chrome |
Firefox |
Safari |
Opera |
Other Mozilla |
|---|---|---|---|---|---|---|
| August 2013 | 28.76% | 39.48% | 20.86% | 9.55% | 1.04% | 0.31% |
| July 2013 | 28.64% | 39.44% | 21.27% | 9.19% | 1.14% | 0.31% |
| June 2013 | 29.08% | 38.92% | 21.22% | 9.28% | 1.17% | 0.32% |
| May 2013 | 29.14% | 38.39% | 21.19% | 9.86% | 1.13% | 0.29% |
| April 2013 | 30.57% | 37.12% | 21.36% | 9.48% | 1.22% | 0.27% |
| March 2013 | 31.92% | 35.83% | 21.29% | 9.52% | 1.21% | 0.24% |
| February 2013 | 33.10% | 34.57% | 21.40% | 9.51% | 1.21% | 0.20% |
| January 2013 | 35.67% | 32.79% | 20.79% | 9.41% | 1.16% | 0.19% |
| July 2012 | 35.77% | 29.87% | 23.61% | 9.18% | 1.43% | 0.13% |
| January 2012 | 38.59% | 25.75% | 24.74% | 9.55% | 1.28% | 0.09% |
| July 2011 | 42.06% | 20.25% | 27.35% | 9.07% | 1.20% | 0.07% |
| January 2011 | 46.00% | 15.25% | 28.74% | 8.62% | 1.27% | 0.12% |
| July 2010 | 49.26% | 10.53% | 30.88% | 7.89% | 1.26% | 0.18% |
| January 2010 | 50.73% | 6.85% | 32.89% | 7.79% | 1.51% | 0.23% |
| September 2009 | 54.58% | 4.25% | 31.96% | 7.44% | 1.34% | 0.43% |
StatOwl.com (September 2008 to November 2012)
| Period |
Internet Explorer |
Firefox, Other Mozilla |
Chrome |
Safari |
Opera |
Gecko |
Netscape Navigator |
|---|---|---|---|---|---|---|---|
| November 2012 | 43.38% | 19.42% | 24.91% | 9.27% | 0.75% | 0.84% | |
| October 2012 | 44.40% | 19.62% | 24.09% | 9.42% | 0.68% | 0.55% | |
| September 2012 | 45.03% | 19.26% | 23.31% | 9.84% | 0.65% | 0.78% | |
| August 2012 | 45.87% | 19.49% | 22.53% | 10.14% | 0.59% | 0.43% | |
| July 2012 | 46.95% | 19.03% | 22.31% | 9.96% | 0.52% | 0.36% | |
| June 2012 | 46.69% | 19.42% | 21.76% | 9.80% | 0.55% | 0.30% | |
| May 2012 | 46.47% | 20.47% | 20.88% | 10.04% | 0.55% | 0.30% | |
| April 2012 | 48.28% | 19.73% | 19.39% | 10.51% | 0.44% | 0.27% | |
| March 2012 | 49.18% | 19.46% | 18.10% | 11.14% | 0.38% | 0.29% | |
| February 2012 | 50.98% | 19.00% | 17.05% | 11.16% | 0.33% | 0.22% | |
| January 2012 | 51.81% | 18.98% | 16.77% | 10.93% | 0.38% | 0.15% | |
| December 2011 | 51.42% | 19.73% | 16.78% | 10.69% | 0.39% | 0.16% | |
| November 2011 | 51.17% | 20.15% | 16.13% | 11.29% | 0.38% | 0.16% | |
| October 2011 | 52.59% | 20.06% | 15.01% | 11.13% | 0.36% | 0.17% | |
| September 2011 | 53.79% | 20.18% | 13.79% | 10.81% | 0.37% | 0.21% | |
| August 2011 | 53.81% | 20.61% | 13.64% | 10.75% | 0.39% | 0.15% | |
| July 2011 | 55.26% | 20.29% | 12.58% | 10.68% | 0.37% | 0.13% | |
| June 2011 | 56.23% | 20.85% | 12.04% | 9.77% | 0.46% | ||
| May 2011 | 57.48% | 20.43% | 11.06% | 9.88% | 0.49% | ||
| April 2011 | 57.08% | 21.40% | 10.85% | 9.47% | 0.53% | ||
| March 2011 | 60.27% | 19.57% | 9.60% | 9.62% | 0.42% | ||
| February 2011 | 60.92% | 19.21% | 9.13% | 9.59% | 0.40% | 0.42% | |
| January 2011 | 61.28% | 19.57% | 8.80% | 9.40% | 0.39% | 0.31% | |
| December 2010 | 60.98% | 20.14% | 8.61% | 9.33% | 0.40% | 0.24% | |
| November 2010 | 62.13% | 19.69% | 7.46% | 9.42% | 0.37% | 0.18% | |
| October 2010 | 62.54% | 19.76% | 7.17% | 9.03% | 0.36% | 0.15% | |
| September 2010 | 62.68% | 20.51% | 6.99% | 8.83% | 0.36% | 0.15% | |
| August 2010 | 62.66% | 20.94% | 6.83% | 8.83% | 0.35% | 0.14% | |
| July 2010 | 61.73% | 21.66% | 6.95% | 8.94% | 0.36% | 0.11% | |
| June 2010 | 63.37% | 21.26% | 6.24% | 8.52% | 0.33% | ||
| May 2010 | 64.17% | 21.12% | 5.59% | 8.31% | 0.37% | ||
| April 2010 | 64.55% | 21.35% | 5.23% | 8.12% | 0.40% | ||
| March 2010 | 66.34% | 19.90% | 4.39% | 8.59% | 0.31% | ||
| February 2010 | 66.99% | 19.48% | 3.98% | 9.00% | 0.24% | 0.06% | |
| January 2010 | 66.33% | 20.31% | 3.87% | 8.94% | 0.26% | 0.06% | |
| December 2009 | 66.12% | 20.82% | 3.51% | 8.73% | 0.30% | 0.07% | |
| November 2009 | 67.74% | 20.15% | 2.88% | 8.56% | 0.28% | 0.10% | |
| October 2009 | 68.38% | 20.32% | 2.56% | 8.09% | 0.27% | 0.14% | |
| September 2009 | 67.25% | 21.12% | 2.41% | 8.46% | 0.28% | 0.21% | |
| August 2009 | 68.37% | 21.32% | 2.21% | 7.29% | 0.28% | 0.23% | |
| July 2009 | 69.29% | 21.06% | 2.05% | 6.77% | 0.30% | 0.24% | |
| June 2009 | 71.44% | 19.48% | 1.93% | 6.30% | 0.33% | 0.22% | |
| May 2009 | 71.35% | 20.26% | 1.64% | 5.95% | 0.31% | 0.21% | |
| April 2009 | 71.38% | 20.46% | 1.43% | 5.80% | 0.31% | 0.19% | |
| March 2009 | 72.03% | 20.00% | 1.19% | 5.91% | 0.30% | 0.10% | |
| February 2009 | 74.04% | 18.64% | 0.97% | 5.57% | 0.27% | 0.10% | |
| January 2009 | 73.05% | 19.39% | 0.96% | 5.72% | 0.29% | 0.12% | |
| December 2008 | 70.89% | 20.87% | 0.95% | 6.32% | 0.33% | 0.13% | |
| November 2008 | 72.07% | 19.78% | 0.68% | 6.57% | 0.29% | 0.13% | |
| October 2008 | 73.45% | 18.88% | 0.57% | 6.22% | 0.26% | 0.16% | |
| September 2008 | 74.53% | 18.14% | 0.52% | 5.98% | 0.22% | 0.17% |
92% of sites monitored by StatOwl serve predominantly United States market.[28]
AT Internet Institute (Europe, July 2007 to June 2010)
AT Internet Institute was formerly known as XiTi.
Method: Only counts visits to local sites in 23 European countries and then averages the percentages for those 23 European countries independent of population size.
| Date | Internet Explorer | Netscape | Firefox | Opera | Safari | Chrome | Source |
|---|---|---|---|---|---|---|---|
| June 2010 | 53.8% | 30.6% | 2.4% | 6.8% | 5.7% | 2010-6 | |
| March 2010 | 57.1% | 29.6% | 2.2% | 5.2% | 5.3% | 2010-3 | |
| September 2009 | 62.0% | 28.4% | 2.2% | 4.3% | 2.8% | 2009–11 | |
| April 2009 | 63.6% | 0.6% | 28.4% | 2.2% | 3.4% | 1.7% | 2009-5 |
| March 2009 | 64.6% | 0.6% | 27.8% | 2.2% | 3.3% | 1.4% | |
| February 2009 | 65.6% | 0.5% | 27.4% | 2.1% | 3.0% | 1.3% | |
| January 2009 | 58.1% | 0.6% | 32.5% | 4.1% | 3.0% | 1.5% | 2009-1 |
| December 2008 | 58.5% | 0.6% | 32.3% | 4.5% | 2.7% | 1.3% | |
| November 2008 | 59.5% | 0.6% | 31.1% | 5.1% | 2.5% | 1.1% | 2008-12-22 |
| October 2008 | 59.2% | 0.6% | 31.1% | 5.4% | 2.4% | 1.1% | |
| September 2008 | 60.2% | 0.4% | 31.2% | 4.8% | 2.4% | 1.0% | 2008-10-10 |
| August 2008 | 59.4% | 0.3% | 33.0% | 4.5% | 2.6% | ||
| July 2008 | 60.4% | 0.3% | 32.2% | 4.5% | 2.4% | ||
| June 2008 | 60.5% | 0.3% | 31.4% | 5.1% | 2.5% | ||
| May 2008 | 61.7% | 0.4% | 30.7% | 4.7% | 2.4% | ||
| April 2008 | 64.5% | 0.5% | 28.9% | 3.6% | 2.4% | ||
| March 2008 | 65.0% | 0.5% | 28.8% | 3.3% | 2.3% | 2008-04-30 | |
| February 2008 | 65.6% | 0.5% | 28.5% | 3.2% | 2.2% | ||
| January 2008 | 66.1% | 0.5% | 28.0% | 3.2% | 2.1% | ||
| December 2007 | 66.1% | 0.5% | 28.0% | 3.3% | 2.0% | ||
| November 2007 | 66.9% | 0.5% | 27.3% | 3.2% | 1.9% | ||
| October 2007 | 67.5% | 0.4% | 27.0% | 3.1% | 1.8% | ||
| September 2007 | 66.6% | 0.3% | 27.7% | 3.4% | 1.8% | 2007-10-30 | |
| 2–8 July 2007 | 66.5% | 0.3% | 27.8% | 3.5% | 1.7% | 2007-07-18 |
TheCounter.com (2000 to 2009)
TheCounter.com identifies sixteen versions of six browsers (Internet Explorer, Firefox, Safari, Opera, Netscape, and Konqueror). Other browsers are categorised as either "Netscape compatible" (including Google Chrome, which may also be categorized as "Safari" because of its "Webkit" subtag) or "unknown". Internet Explorer 8 is identified as Internet Explorer 7. Monthly data includes all hits from 2008-02-01 until the end of the month concerned. More than the exact browser type, this data identifies the underlying rendering engine used by various browsers, and the table below aggregates them in the same column.
| Period |
Internet Explorer |
Netscape, Other Mozilla, Firefox |
Safari |
Opera |
Netscape Navigator |
Sources |
|---|---|---|---|---|---|---|
| 2009 Q4 | 66.42% | 21.13% | 10.05% | 1.00% | 0.05% | Oct, Nov, Dec |
| 2009 Q3 | 69.07% | 20.59% | 8.10% | 0.89% | 0.06% | Jul, Aug, Sep |
| 2009 Q2 | 70.31% | 20.12% | 6.44% | 0.94% | 0.06% | Apr, May, Jun |
| 2009 Q1 | 71.25% | 20.01% | 5.47% | 0.92% | 0.08% | Jan, Feb, Mar |
| 2008 Q4 | 74.24% | 18.66% | 4.52% | 0.89% | 0.07% | Oct, Nov, Dec |
| 2008 Q3 | 76.33% | 17.97% | 3.76% | 0.84% | 0.07% | Jul, Aug, Sep |
| 2008 Q2 | 78.30% | 16.36% | 3.41% | 0.81% | 0.06% | Apr, May, Jun |
| 2008 Q1 | 78.80% | 15.87% | 3.32% | 0.79% | 0.06% | Jan, Feb, Mar |
| 2007 Q4 | 81.14% | 13.81% | 3.21% | 0.67% | 0.06% | Oct, Nov, Dec |
| 2007 Q3 | 81.63% | 13.49% | 3.00% | 0.66% | 0.06% | Jul, Aug, Sep |
| 2007 Q2 | 82.97% | 12.41% | 2.87% | 0.64% | 0.06% | Apr, May, Jun |
| 2007 Q1 | 83.69% | 11.57% | 2.92% | 0.57% | 0.06% | Jan, Feb, Mar |
| 2006 Q4 | 84.11% | 11.13% | 2.80% | 0.60% | 0.05% | Nov, Dec |
| 2006 Q3 | 84.48% | 10.56% | 2.27% | 0.73% | 0.06% | Jul, Aug, Sep |
| 2006 Q2 | 86.32% | 9.03% | 1.89% | 0.70% | 0.05% | Apr, May, Jun |
| 2006 Q1 | 90.01% | 6.77% | 1.40% | 0.58% | 0.05% | Jan, Feb, Mar |
| 2005 Q4 | 87.25% | 8.60% | 1.83% | 0.71% | 0.07% | Oct, Nov, Dec |
| 2005 Q3 | 87.58% | 8.42% | 1.60% | 0.67% | 0.07% | Jul, Aug, Sep |
| 2005 Q2 | 90.90% | 6.02% | 0.99% | 0.51% | 0.09% | Apr, May, Jun |
| 2005 Q1 | 90.77% | 5.73% | 1.00% | 0.54% | 0.11% | Jan, Feb, Mar |
| 2004 Q4 | 90.98% | 5.10% | 0.77% | 0.68% | 0.18% | Oct, Nov, Dec |
| 2004 Q3 | 92.70% | 3.57% | 0.73% | 0.65% | 0.20% | Jul, Aug, Sep |
| 2004 Q2 | 95.04% | 2.37% | 0.67% | 0.51% | 0.32% | Apr, May, Jun |
| 2004 Q1 | 94.28% | 2.70% | 0.52% | 0.36% | Jan, Feb, Mar | |
| 2003 Q4 | Oct, Nov, Dec | |||||
| 2003 Q3 | Jul, Aug, Sep | |||||
| 2003 Q2 | 94.43% | 2.22% | 0.66% | 1.45% | Apr, May, Jun | |
| 2003 Q1 | 94.18% | 2.15% | 0.65% | 1.77% | Jan, Feb, Mar | |
| 2002 Q4 | 93.94% | 1.67% | 0.83% | 2.31% | Oct, Nov, Dec | |
| 2002 Q3 | 93.32% | 1.36% | 0.94% | 3.04% | Jul, Aug, Sep | |
| 2002 Q2 | 92.47% | 1.13% | 0.82% | 4.13% | Apr, May, Jun | |
| 2002 Q1 | 92.40% | 0.93% | 0.52% | 4.67% | Jan, Feb, Mar | |
| 2001 Q4 | 90.83% | 0.71% | 0.36% | 5.23% | Oct, Nov, Dec | |
| 2001 Q3 | 88.43% | 0.26% | 0.31% | 6.49% | Jul, Aug, Sep | |
| 2001 Q2 | 87.99% | 0.27% | 0.28% | 7.46% | Apr, May, Jun | |
| 2001 Q1 | 86.80% | 0.30% | 0.22% | 9.84% | Jan, Feb, Mar | |
| 2000 Q4 | 83.95% | 0.14% | 0.14% | 12.61% | Oct, Nov, Dec | |
| 2000 Q3 | 82.76% | 0.04% | 0.14% | 14.35% | Jul, Aug, Sep | |
| 2000 Q2 | 80.30% | 0.02% | 0.12% | 17.54% | Apr, May, Jun | |
| 2000 Q1 | 79.09% | 0.00% | 0.13% | 19.25% | Jan, Feb, Mar | |
| Period |
Internet Explorer |
Netscape, Other Mozilla, Firefox |
Safari |
Opera |
Netscape Navigator |
Sources |
OneStat.com (April April 2002 to March 2009)
| Period |
Internet Explorer |
Other Mozilla, Firefox |
Safari |
Chrome |
Opera |
Netscape |
Netscape Navigator |
|---|---|---|---|---|---|---|---|
| March 2009 | 79.79% | 15.59% | 2.65% | 0.86% | 0.54% | 0.31% | |
| November 2008 | 81.36% | 14.67% | 2.42% | 0.54% | 0.55% | 0.32% | |
| February 2008 | 83.27% | 13.76% | 2.18% | 0.55% | 0.14% | ||
| June 2007 | 84.66% | 12.72% | 1.79% | 0.61% | 0.11% | ||
| January 2007 | 85.81% | 11.69% | 1.64% | 0.58% | 0.13% | ||
| November 2006 | 85.24% | 12.15% | 1.61% | 0.69% | 0.11% | ||
| October 2006 | 85.85% | 11.49% | 1.61% | 0.69% | 0.12% | ||
| July 2006 | 83.05% | 12.93% | 1.84% | 1.00% | 0.16% | ||
| May 2006 | 85.17% | 11.79% | 2.02% | 0.79% | 0.15% | ||
| January 2006 | 85.82% | 11.23% | 1.88% | 0.77% | 0.16% | ||
| November 2005 | 85.45% | 11.51% | 1.75% | 0.77% | 0.26% | ||
| April 2005 | 86.63% | 8.69% | 1.26% | 1.03% | 1.08% | ||
| February 2005 | 87.28% | 8.45% | 1.21% | 1.09% | 1.11% | ||
| November 2004 | 88.90% | 7.35% | 0.91% | 1.33% | |||
| May 2004 | 93.9% | 2.1% | 0.71% | 1.02% | |||
| January 2004 | 94.8% | 1.8% | 0.48% | 0.8% | |||
| July 2003 | 95.4% | 1.6% | 0.25% | 0.6% | 1.9% | 0.6% | |
| February 2003 | 95.2% | 1.2% | 0.11% | 0.7% | 1.9% | 1.0% | |
| December 2002 | 95.0% | 1.1% | 0.8% | 1.9% | 1.1% | ||
| September 2002 | 94.9% | 0.8% | 0.9% | 1.8% | 1.2% | ||
| June 2002 | 95.3% | 0.4% | 0.7% | 1.5% | 1.9% | ||
| April 2002 | 96.6% | 0.5% | 0.7% | 2.1% |
| Period |
Internet Explorer |
Other Mozilla, Firefox |
Safari |
Chrome |
Opera |
Netscape |
|---|---|---|---|---|---|---|
| March 2009 | 72.69% | 20.40% | 4.53% | 1.05% | 0.49% | 0.38% |
| November 2008 | 75.54% | 18.74% | 3.95% | 0.62% | 0.39% | 0.50% |
| June 2007 | 75.69% | 19.65% | 3.77% | 0.61% | 0.17% | |
| January 2007 | 78.13% | 16.11% | 3.68% | 0.73% | 0.18% |
| Period |
Internet Explorer |
Other Mozilla, Firefox |
Safari |
Chrome |
Opera |
Netscape |
|---|---|---|---|---|---|---|
| March 2009 | 65.55% | 23.09% | 7.36% | 1.32% | 0.75% | 0.56% |
| November 2008 | 69.67% | 20.38% | 7.56% | 0.92% | 0.76% | 0.56% |
| June 2007 | 75.76% | 16.47% | 5.72% | 0.69% | 0.13% | |
| January 2007 | 79.00% | 14.13% | 4.70% | 0.71% | 0.14% |
| Period |
Internet Explorer |
Other Mozilla, Firefox |
Safari |
Chrome |
Opera |
Netscape |
|---|---|---|---|---|---|---|
| March 2009 | 80.91% | 15.16% | 1.94% | 0.85% | 0.60% | 0.36% |
| November 2008 | 83.77% | 11.45% | 1.76% | 0.43% | 0.60% | 0.34% |
| June 2007 | 86.00% | 11.22% | 1.61% | 0.53% | 0.10% | |
| January 2007 | 86.72% | 10.86% | 1.78% | 0.49% | 0.10% |
| Period |
Internet Explorer |
Other Mozilla, Firefox |
Safari |
Chrome |
Opera |
Netscape |
|---|---|---|---|---|---|---|
| June 2007 | 66.42% | 26.32% | 1.86% | 4.05% | 0.24% | |
| January 2007 | 65.71% | 26.68% | 1.77% | 4.28% | 0.24% |
| Period |
Internet Explorer |
Other Mozilla, Firefox |
Safari |
Chrome |
Opera |
Netscape |
|---|---|---|---|---|---|---|
| March 2009 | 71.57% | 23.48% | 2.90% | 0.86% | 0.54% | 0.46% |
| November 2008 | 71.50% | 23.45% | 3.23% | 0.59% | 0.56% | 0.51% |
ADTECH (Europe, 2004 to 2009)
| Period |
Internet Explorer |
Firefox |
Safari |
Chrome |
Opera |
Other Mozilla |
Netscape |
|---|---|---|---|---|---|---|---|
| Q4 2009 | 63.6% | 26.7% | 3.6% | 2.8% | 1.7% | 0.7% | |
| Q1 2009 | 67.7% | 25.3% | 2.6% | 1.0% | 1.4% | 1.1% | |
| Q1 2008 | 76.2% | 18.1% | 1.7% | 1.0% | 2.6% | ||
| Q4 2007 | 76.0% | 18.0% | 1.6% | 1.0% | 2.9% | ||
| July 2007 | 77.5% | 15.5% | 1.6% | 0.9% | 3.9% | ||
| February 2007 | 77.34% | 14.34% | 1.63% | 0.85% | 5.11% | ||
| February–April 2006 | 83.36% | 12.38% | 1.67% | 0.77% | 0.82% | 0.38% | |
| September 2005 | 83.31% | 12.41% | 1.40% | 0.90% | 1.06% | 0.61% | |
| June 2005 | 85.10% | 10.11% | 1.34% | 1.21% | 1.05% | 0.60% | |
| March 2005 | 86.73% | 8.96% | 1.12% | 1.14% | 0.71% | ||
| February 2005 | 87.57% | 7.85% | 1.05% | 1.26% | 0.76% | ||
| January 2005 | 87.13% | 7.43% | 1.70% | 1.33% | 0.85% | ||
| November 2004 | 89.47% | 5.51% | 1.01% | 2.50% | 0.92% | ||
| September 2004 | 92.63% | 2.91% | 1.00% | 2.10% | 0.82% | ||
| August 2004 | 93.08% | 2.15% | 0.89% | 2.18% | 0.95% | ||
| July 2004 | 93.08% | 1.64% | 0.99% | 2.62% | 0.97% | ||
| January–April 2004 | 94.72% | 0.73% | 2.50% | 1.49% |
WebSideStory (US, February 1999 to June 2006)
| Date | Internet Explorer | Netscape, Other Mozilla | Firefox | Source |
|---|---|---|---|---|
| June 2006 | 86.64% | 9.95% | 19 July 2006 | |
| 5 January 2006 | 87.63% | 8.88% | 12 January 2006 | |
| 4 November 2005 | 88.16% | 1.61% | 8.13% | 10 November 2005 |
| 23 September 2005 | 88.46% | 1.69% | 7.86% | 27 September 2005 |
| 29 April 2005 | 88.86% | 2.23% | 6.75% | 10 May 2005 |
| 18 February 2005 | 89.85% | 2.47% | 5.69% | 28 February 2005 |
| 14 January 2005 | 90.28% | 2.64% | 4.95% | |
| 3 December 2004 | 91.80% | 2.83% | 4.06% | |
| 5 November 2004 | 92.89% | 2.95% | 3.03% | |
| 8 October 2004 | 93.21% | 3.05% | 2.66% | 13 December 2004 |
| 4 June 2004 | 95.48% | 3.53% | ||
| 26 August 2002 | 95.97% | 3.39% | 28 August 2002 | |
| 25 October 2001 | 89.03% | 10.47% | 31 October 2001 | |
| 25 April 2001 | 86.61% | 13.10% | 1 May 2001 | |
| 21 February 2001 | 87.71% | 12.01% | 22 February 2001 | |
| 18 June 2000 | 86.08% | 13.90% | ||
| 2 August 1999 | 75.31% | 24.68% | 9 August 1999 | |
| 6 April 1999 | 68.75% | 29.46% | 7 April 1999 | |
| 1 March 1999 | 66.90% | 31.21% | 2 March 1999 | |
| 8 February 1999 | 64.60% | 33.43% | 22 February 2001 |
Reports from before year 2000
.svg.png)
GVU WWW user survey (January 1994 to October 1998)
| Date | Mosaic | Netscape Navigator | Internet Explorer | Source |
|---|---|---|---|---|
| October 1998 | 64% | 32.2% | Primary Browser in 12 Months | |
| April 1998 | 70% | 22.7% | Browser Expected to Use in 12 Months | |
| October 1997 | 59.67% | 15.13% | Browser Expected to Use in 12 Months | |
| April 1997 | 81.13% | 12.13% | Browser Expected to Use in 12 Months | |
| October 1996 | 80.45% | 12.18% | Browser Expected to Use in 12 Months | |
| April 1996 | 89.36% | 3.76% | Browser Expected to Use in 12 Months | |
| April 1995 | 9% | 54% | Hal Berghel's Cybernautica – "A Web Monopoly" | |
| October 1994 | 68% | 18% | Result Graph – Browser | |
| January 1994 | 97% | General Results Graphs |
EWS Web Server at UIUC (1996 Q2 to 1998)
| Date | Mosaic | Internet Explorer | Netscape Navigator | Source |
|---|---|---|---|---|
| 1998 Q4 | 50.43% | 46.87% | Oct 1998, Nov 1998, Dec 1998 | |
| 1998 Q3 | 47.90% | 48.97% | Jul 1998, Aug 1998, Sep 1998 | |
| 1998 Q2 | 43.17% | 53.57% | Apr 1998, May 1998, Jun 1998 | |
| 1998 Q1 | 39.67% | 57.63% | Jan 1998, Feb 1998, Mar 1998 | |
| 1997 Q4 | 35.53% | 62.23% | Oct 1997, Nov 1997, Dec 1997 | |
| 1997 Q3 | 32.40% | 64.93% | Jul 1997, Aug 1997, Sep 1997 | |
| 1997 Q2 | 0.37% | 27.67% | 69.77% | Apr 1997, May 1997, Jun 1997 |
| 1997 Q1 | 0.60% | 22.87% | 74.33% | Jan 1997, Feb 1997, Mar 1997 |
| 1996 Q4 | 1.20% | 19.07% | 77.13% | Oct 1996, Nov 1996, Dec 1996 |
| 1996 Q3 | 2.47% | 13.97% | 80.37% | Jul 1996, Aug 1996, Sep 1996 |
| 1996 Q2 | 6.93% | 9.60% | 82.77% | Apr 1996, May 1996, Jun 1996 |
ZD Market Intelligence (US, January 1997 to January 1998)
| Date | Internet Explorer | Netscape Navigator | Source |
|---|---|---|---|
| January 1998 | 39% | 54% | Behind the numbers: Browser market share |
| January 1997 | 21% | 63% |
Zona Research (US, Jan 1997 to Jan 1998)
| Date | Internet Explorer | Netscape Navigator | Source |
|---|---|---|---|
| July 1998 | 45% | 54% | Behind the numbers: Browser market share |
| September 1997 | 36% | 62% | |
| January 1997 | 28% | 70% |
AdKnowledge (January 1998 to June 1998)
| Date | Internet Explorer | Netscape Navigator | Source |
|---|---|---|---|
| June 1998 | 46% | 52% | Behind the numbers: Browser market share |
| March 1998 | 42% | 57% | |
| January 1998 | 36% | 61% |
Dataquest (1995 to 1997)
| Date | Internet Explorer | Netscape Navigator | Source |
|---|---|---|---|
| 1997 | 39.4% | 57.6% | Browser wars: High price, huge rewards |
| 1996 | 20% | 73% | |
| 1995 | 2.9% | 80.1% |
International Data Corporation (US, 1996 to 1997)
| Date | Internet Explorer | Netscape Navigator | Source |
|---|---|---|---|
| 1997 | 23% | 51% | Behind the numbers: Browser market share |
| 1996 | 16% | 55% |
See also
- List of web browsers
- Comparison of web browsers
- Browser wars
- Timeline of web browsers
- Market share
- Usage share of operating systems
- Usage share of BitTorrent clients
- Usage share of Instant Messaging clients
References
- ↑ http://gs.statcounter.com/#all-browser-ww-monthly-201506-201506-map
- ↑ Metz, Cade (26 June 2008). "AVG disguises fake traffic as IE6". The Register. Retrieved 12 January 2011.
- ↑ Keizer, Gregg (23 June 2008). "Firefox 3.0 boosts Mozilla's market share". Computerworld. IDG. Retrieved 12 January 2011.
- ↑ A better option for the webmaster is to validate the HTML code against prevailing standards .
- ↑ "Frequently Asked Questions". StatCounter.
- ↑ Cacycle (7 June 2010). "Using Firefox 1.5 caching". Mozilla. Retrieved 3 February 2010.
- ↑ Pettersen, Yngve Nysæter (27 February 2007). "Introducing Cache Contexts, or: Why the browser does not know you are logged out". My Opera. Opera Software. Archived from the original on 4 May 2007. Retrieved 12 January 2011.
- 1 2 Sharovatov, Vitaly (3 June 2008). "HTTP History Lists and Back Button". WordPress. Retrieved 3 February 2010.
- ↑ Burstein complaining "...I've been rejected until I come back with Netscape". January 11, 2011
- ↑ Midori wrong user agent -Launchpad 2013-05-18
- ↑ "Market share for browsers, operating systems and search engines | News". Netmarketshare.com. Retrieved 2012-12-30.
- ↑ "Market share for browsers, operating systems and search engines | News". Marketshare.hitslink.com. Retrieved 2012-12-30.
- ↑ "Visual Map of Global usage of Web Browsers by Country". statcounter.com. 2013-06-01. Retrieved 2014-01-01.
- ↑ Vaughan-Nichols, Steven. "Most popular US web browsers, according to the federal government". ZDnet. CBS Interactive. Retrieved 24 August 2015.
We finally have some clear, objective data on which web browsers and operating systems are the most popular in the United States.
- ↑ "StatCounter Global Stats - Browser, OS, Search Engine including Mobile Usage Share". statcounter.com.
- ↑ "StatCounter Global Stats - Browser, OS, Search Engine including Mobile Usage Share". statcounter.com.
- ↑ "StatCounter Global Stats - Browser, OS, Search Engine including Mobile Usage Share". statcounter.com.
- ↑ Hoffman, Chris (March 12, 2014). "Why Third-Party Browsers Will Always Be Inferior to Safari on iPhone and iPad".
- ↑ Internet Explorer 11's modified user agent string can cause improper identification as either WebKit or Gecko.
- ↑ "Google going its own way, forking WebKit rendering engine". Ars Technica. Retrieved 4 April 2013.
- ↑ "Comparison from W34 to W45 2015". StatCounter Global Stats.
- ↑ "Mobile and tablet internet usage exceeds desktop for first time worldwide". StatCounter (Press release).
- ↑ Number of Mobile-Only Internet Users Now Exceeds Desktop-Only in the U.S.. Retrieved 5 May 2015.
- ↑ "Statcounter statistics methodology". StatCounter. Retrieved 12 January 2011.
- ↑ "Country Level Weighting". Net Applications. 1 August 2009. Retrieved 12 January 2011.
- ↑ Zachte, Erik (28 February 2014). "Wikimedia Traffic Analysis Report – Browsers e.a.". Retrieved 24 March 2014.
- ↑ Zachte, Erik (15 February 2011). "Wikimedia Traffic Analysis Report – Requests by destination". Retrieved 4 March 2011.
- ↑ "About Our Data". Statowl.com. Retrieved 12 January 2011.
External links
| |||||||||||||||||||||||||||||
| |||||||||||||||||||||||||||||
| |||||||||||||||||||||||||||||
| |||||||||||||||||||||||||||||
| |||||||||||||||||||||||||||||