Water supply and sanitation in Nairobi
Water supply and sanitation in Nairobi is characterised by achievements and challenges. Among the achievements is the expansion of infrastructure to keep pace with population growth, in particular through the construction of the Thika Dam and associated water treatment plant and pipelines during the 1990s; the transformation of the municipal water department into an autonomous utility in 2003; and the more recent reduction of water losses – technically called non-revenue water – from 50 to 40%.[1]
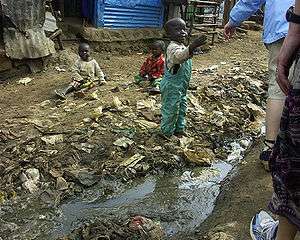
Challenges include poor quality and intermittent water supply (only 40% of those with house connections receive water continuously),[2] the loss of storage capacity in reservoirs behind dams through siltation accelerated by erosion in the Aberdare Range,[3] lack of access to adequate sanitation in slums where half the population of the city lives, blockages of sewers resulting in overflows,[4] and unused capacity in the city's largest wastewater treatment plant in Dandora.[5] Another problem is political infighting and corruption, leading to the firing of the entire Board of the Nairobi Water Company in 2009.[6]
History
The history of water supply to Nairobi since the city was founded as a rail outpost in 1899 has been to a large extent a history of tapping ever more distant water sources to supply a rapidly expanding city with sufficient water. Other challenges faced included the reduction of water distribution losses, reaching the poor in slums, expanding sewerage and wastewater treatment, and strengthening the Nairobi water utility.
Supply expansion
The source of the first piped water supply system of Nairobi were the Kikuyu springs and the Kabete treatment plant developed in 1906. This was followed by the Ruiru dam in 1936 and the Sasumua Dam on the Chania River in 1945, both located in the Aberdare Range north of Nairobi, as well as local deep wells. In the 1970s these sources were not any more sufficient to supply the growing city during the dry season and financing for a new and larger dam, the Thika Dam, was mobilised to alleviate growing water shortages. The dam and the associated pipeline and water treatment plant were financed by the World Bank, the African Development Bank, the European Investment Bank and the Japanese OECF. Gross water availability increased from 165 litres per capita and day in 1976 to 200 in 1995.[4][7] When the Thika dam came on stream the last wellfield used by the city for piped water supply was closed down so that the city began to rely exclusively on surface water.
Water loss reduction
In parallel with the tapping of new water sources, efforts were undertaken to reduce water distribution losses by introducing a metered zoning system. According to a World Bank evaluation the system allowed to "significantly reduce water losses".[4] In 1998 non-revenue water, which includes physical losses as well as administrative losses such as illegal water use and undermetering, had thus been reduced to 27–30%.[8] However, water losses subsequently must have increased again, because in 2010 the Nairobi Water and Sewer Company declared that it had successfully achieved a reduction of non-revenue water from 50 to 40%.[1] The regulatory agency WASREB estimated non-revenue water in Nairobi at 40% in 2008/09 and at 42% in 2009/10.[9]
Water kiosks in slums
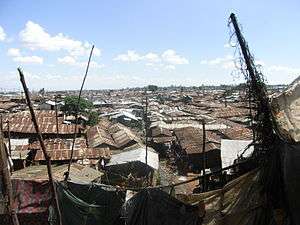
A particular challenge in Nairobi has been and still is how to provide sufficient and affordable water to half its population living in slums. Since the 1970s slum residents with piped water connections built water kiosks where they resell water to other residents in buckets. The number of water kiosks in slums increased from about 150 in 1978 to nearly 1,500 in 1994. The municipal water department recommended a resale price, but could not enforce it so that the poorest end up paying much more than those fortunate enough to have a tap in their house.[4]
Sewerage and wastewater treatment
Another challenge is sanitation. A sewer system for the central district was built in the late colonial period and the first wastewater treatment plant was completed at Kariobangi just east of the city in 1961, shortly before independence. A second wastewater treatment plant was commissioned in 1980 in Dandora further East and further downstream on the Nairobi River.[10]
In 1994 a substantial expansion of the plant was completed, making it the largest plant of its kind – a stabilization pond plant – in Africa. In parallel, an effort was made to expand the sewerage system. With the new infrastructure the discharge of liquid waste in open drains declined considerably and for a period between 1987 and 1995 the water quality of the Nairobi River improved. However, the discharge of untreated wastewater in non-sewered areas continued. Because of inadequate garbage collection and poor maintenance sewers became clogged and overflowed, so that the benefits of the sewerage were less than expected.[4] Furthermore, the Kariobangi plant was poorly maintained and stopped functioning so that the wastewater bypassed it and was discharged without treatment to the Nairobi river.[10]
Sector reforms: From city department to utility
.jpg)
Another challenge was of an institutional nature: The Water and Sewer Department (WSD) of the city had difficulties retaining qualified staff because of its salary structure that made it uncompetitive compared to the private sector and other parastatals. For example, out of 57 staff sent for training in 1996–97, one third had left by 1998. The morale of those who remained was said to be low. Furthermore, cost recovery was low and declining. For political reasons tariffs were increased less than the inflation rate, so that real tariff levels declined between 1988 and 1998. Furthermore, the devaluation of the Kenyan Shilling in the early 1990s led to high losses because the utility was indebted in foreign currency. The sustainable operation and maintenance of the water and sanitation infrastructure was thus in jeopardy because of lack of financial resources.[11]
In 2002 the government approved a major sector reform that, among other things, resulted in the transformation of the city water and sewer department into a legally and financially autonomous utility called the Nairobi City Water & Sewerage Company in 2003. Physical assets were transferred to an Asset Holding Company, the Athi Water Services Board, which signed a performance contract with the new operating utility. The reform was designed to allow utilities to offer higher salaries to qualified staff, to insulate decisions about tariff adjustments from political interference, to improve the financial viability of utilities and to ultimately improve service quality.
2009 drought
In 2009 the dry season was longer than usual and the reservoir of the Thika Dam, which has a storage capacity of 70m cubic metres, held only 26m cubic metres of water at the height of the drought. Environmentalists attributed the low water levels not only to the failed rains, but also to the destruction of forests in the Aberdare Range [12][13] Erosion reduces the storage capacity of the reservoir and water quality has been reduced by pesticide runoff.[3] The Nairobi water utility drilled emergency wells during the drought and connected them to the piped network, relying again on groundwater about a decade after the utility had closed down its last wellfield.
2009 sacking of the Nairobi Water Company Board
The drought coincided with the campaign for the Nairobi mayoral election, thus triggering a political crisis. In July 2009 the Nairobi City Council sacked the entire Board of the Nairobi City Water and Sewerage Company for "malpractices". This was in the wake of the publication of a report by Transparency International-Kenya and the Kenyan NGO Maji Na Ufanisi (Water and Development). The report had found cases of bribery for illegal connections, tampering with meter readings and diversion of water from domestic users to industries in five cities, with the highest incidence of bribery in Nairobi.[6][12] However, according to a report by NTV (Kenya) "some of the failures blamed on the Board can be traced to members of the City Council".[14] The elections were won by incumbent mayor Geoffrey Majiwa. However, he had to step down himself a year later because of corruption allegations.[15]
Plans for further supply expansion
In August 2010 the Athi Water Services Board presented a 24-year, US$1 billion master plan to more than double surface water supply to Nairobi by delivering an additional 750,000 m3 of water from the Irati, Gikigie, Maragua and other rivers north of Nairobi. Financing is expected from the French Development Agency and the World Bank.[16]
Access
Of Nairobi's 3.14 million inhabitants at night, a number that swells to about 5 million during the day, only about 50 per cent have direct access to piped water. The rest obtain water from kiosks, vendors, illegal connections or from wells. Only about 40 per cent of those with access to piped water receive water 24 hours per day.[2] On average, residents of Nairobi received water for only 11 hours per day in 2009/10, a level deemed unacceptable by the Water Sector Regulatory Board.[9]
Water quality
The Nairobi water utility NCWSC says it has a stringent water quality monitoring programs to ensure the water they supply the city is safe for drinking. However, due to high leakage in the network and intermittent supply treated water is sometimes recontaminated before it reaches the tap. According to the Water Sector Regulatory Board, in 2009/10 only 76% of drinking water samples complied with standards for bacteriological quality, a level deemed unacceptable by the regulator. This was the case despite a high level of chlorination that was deemed acceptable by the regulator with 91% of samples complying with the norms for residual chlorine.[9] Also, sometimes water is contaminated because of pipe bursts. For instance, over 10 fatalities from water borne diseases were experienced in the slum Mukuru kwa Njenga in 2009. Those who can afford it boil or filter water before drinking it, or buy bottled water. Those who cannot afford this are forced to take their chances with tap water.[17]
Water sources
Nairobi residents receive water through the piped network and pump water from their own deep wells. Water supply from both sources is about 570,000 m3/day. If one takes into account that the population of Nairobi swells to 5 million during daytime, this corresponds to less than 120 litre per capita per day before distribution losses. However, water is not equally distributed: Wealthier users with access to piped water use much more than average, while those without access to piped water receive much less. Half of Nairobi’s population lives in slums, but they consume only 34,500 m3/day, corresponding to less than 20 litre per capita per day.[18] The heavily polluted and relatively small Nairobi River that flows through the city is not used for drinking water supply.
Surface water
The Nairobi water utility relies almost exclusively on surface water to satisfy the growing city's water needs. Surface water supply for Nairobi stood at 484,500 m3/day in 2010.[1] Reservoirs have sufficient storage to supply the city during a normal dry season, but during extended droughts water supply can be lower than average. The above figure is for 99% supply reliability. At 90% reliability available water supply is higher at a total of 577,000 m3/day.[19] However, storage capacity in reservoirs is gradually reduced through sedimentation.
The Nairobi utility receives 94% of its water from the Tana River basin north of the city through three reservoirs: the Sasumua Dam on the Chania River, the Thika Dam and the Chania-B Dam. The Thika Dam is the largest, supplying 225,000 m3/day. Water from the reservoirs is treated in two treatment plants, including the largest one in Ngethu. The remaining 6% comes from local sources: the Kikuyu Springs and the Ruiru Dam, both located in the Athi River Basin and whose water is treated in two smaller treatment plants.[16][20] The spillway of the Sasumua Dam has been badly damaged during the 2003 El Nino floods. The spillway was rehabilitated between 2009 and 2011 with financing from the French Development Agency at a cost of 65m Euro.[21]
Groundwater
Groundwater supplies an additional 85.000 m3 per day or more from an estimated 3000 boreholes, up from an estimated 2250 boreholes in 2001. The groundwater table has declined; in one well it declined by 40 meters between 1958 and 1996. The average depth of new wells in 2001 was 238 meters. In that year 97 new wells were drilled because of a drought. Most wells are operated by industrial enterprises, hotels, farms for flower production in greenhouses, and private houses in parts of the city that receive only intermittent supply (e.g. Langata and Karen). Groundwater is also used to irrigate gardens and to supply tankers that resell the water. Many private well owners are also connected to the mains water supply network and use groundwater as a back-up supply. Natural groundwater quality is good. There are few data on whether the aquifer has been polluted or not.[22] At the height of another drought in 2008/2009, Athi Water Services Board drilled over 40 emergency boreholes in various parts of the city and connected them to the distribution network.[17]
Sewerage and waste water treatment
The existing sewer network of a total length of about 163 km only covers an area of about 208 km2,[23] which is less than 30% of the 696 km2 area of the city. It is unclear what share of the population is connected to the sewerage system: Estimates vary from 10 to 48%.
There are two wastewater treatment plants in Nairobi: The Dandora stabilisation ponds treat industrial and domestic sewage and have a design capacity of 80,000 cubic meters per day. They constitute the largest pond system in Africa, but as of 1996 only half its capacity has been used.[5] The Kariobangi wastewater treatment plant has a capacity of 32,000 m3 per day and uses the trickling filter technology.[24] The effluent from both plants is discharged into the Nairobi River.[25]
Institutions
The responsibility for water supply and sewerage in Nairobi is shared between an asset holding company, Athi Water Services Board (AWSB), and an operating company, the Nairobi City Water and Sewer Company that operates under contract with the AWSB. 10 other Water Service Providers (WSPs) operate under the AWSB in localities near Nairobi that are located outside of Nairobi Province. Service standards are set and monitored by a national water regulatory agency called the Water Services Regulatory Board (WASREB).
The Athi Water Services Board is under the authority of the Ministry of Water and Irrigation and covers its costs through a Regulatory Levy collected from the Water Service Providers.[26] The Minister of Water and Irrigation, a position held by Charity Ngilu since 2008, appoints the Board of AWSB. The 8-member supervisory Board is chaired by Reuben Ndolo, a member of parliament from the Orange Democratic Movement of Prime Minister Raila Odinga.[27] Since July 2011 the CEO is Malakwen Milgo, an engineer who has previously worked for the German technical advisory agency GTZ.[28] The company is ISO 9001 certified.[29]
Water and sewer services in Nairobi city are provided by the Nairobi City Water & Sewerage Company Ltd. The Company is owned by the City and has a supervisory Board of 12 Directors from the private sector, professional associations, NGOs and the City Council. The County Government appointed a new Board in March 2014 to replace the one that was chaired by Peter Kuguru. The new chairman is Mr. Raphael Nzomo. However, an activist Mr. Okiya Omtata went to court and had this new Board declared illegal since the prerequisite requirements of advertisement was not met by the county government of Nairobi. The day-to-day business of the company is run by a managing director. Managing Director Francis Mugo was retired by the Board of NCWSC in October 2011 and Eng. Philip Gichuki, a former manager of Tana Water Services Board appointed substantive MD on 18 February 2012. The politicisation of the company caused divisions among staff, leading to offices being deserted. Previously AWSB had attempted to control NWC's finances through a new Service Provision Agreement (SPA) that foresaw a new account to which AWSB would have been a signatory.[30] The company is ISO 9001 certified.[2]
The 10 other WSPs under contract with the Athi Water Services Board operate water and, in some cases, sewer systems in towns around Nairobi. They are the Kiambu Water & Sewerage Company, the Gatundu South Water & Sanitation Company, the Karimenu Community Water & Sanitation Company, the Gatanga Community Water Project, the Limuru Water & Sewerage Company, the Kikuyu Water Company, the Ruiru Juja Water & Sewerage Company, the Kitisuru Water Company, the Runda Water & Sewerage Company and the Githunguri Water and Sanitation Company.[31] Some of them are private, such as Runda Water and Sewerage Company that provides piped water to the Executive Residential Housing Estate of Old Runda since 1975.[32]
Water pricing, billing and cost recovery
Those fortunate enough to have access to piped water pay relatively low water tariffs, while slum residents typically have to rely on much more expensive water sold in cans through water kiosks.
Water tariffs are identical for all water service providers under contract with the Athi Water Service Board. Tariff increases are approved by WASREB. In June 2009 a tariff increase took effect, bringing residential and commercial tariffs to the following level:
- Between 0 and 10m3: 18.71 KSh/m3 (US$0.18/m3),
- Between 11 and 30m3: 28.07KSh/m3 (US$0.28/m3),
- Between 31 and 60m3: 42.89KSh/m3 (US$0.43/m3).
If there is a sewer connection, there is a sewer surcharge of 75%. Water kiosks in slums are billed at a lower rate of 10 shillings/m3 (US$0.10/m3) independently of consumption, if the kiosk owners are properly registered.[33] Nevertheless, slum residents end up paying much more for water. A 20-litre jerry can of water in a slum typically sells for 2 Kenyan shillings, corresponding to 100 shillings per m3 (US$1). This is double the recommended price of 1 shilling (50 shillings per m3) and more than five times the water tariff in the lowest consumption bracket (19 shillings per m3).[34] During the 2009 drought prices in slums rose to 5 and even 10 Kenyan shillings, corresponding to 250 to 500 KSh per m3 (US$2.50–5.00),[18] which is higher than water tariffs in some European countries.[34]
Fraudulent billing remains a challenge. While some parts of the city are so dangerous that meter readers do not venture to enter them, in other cases men posing as employees of the water company threaten to disconnect customers unless they pay them. To combat this type of fraud, the water company has purchased clearly marked motorcycles that will replace the Nissan cars that were previously used by meter readers and disconnection crews.[35] However, since 2010 Nairobi Water Company customers can also pay their bills via mobile phone through the money transfer service M-PESA.[36]
According to the Water Sector Regulatory Board, collection efficiency – the share of bills that were paid – was not acceptable at only 75% in 2009/10. Despite the low collection efficiency NWC covered 126% of its operation and maintenance costs, which is within the range considered acceptable by the regulator. 87% of connections were metered, a ratio that was also judged not acceptable by the regulator.[9]
Water supply to slums
In Kibera and other slums of Nairobi water is supplied through water kiosks. 98% of kiosks are privately owned and the owners financed the construction of the kiosks and the pipes to the water mains. Only 2% were operated by community-based organisations or NGOs.[34][37] Water is supplied by the Nairobi utility, but is often not paid for by the kiosk owners. Although two-thirds of the kiosks have water reservoirs, their capacity is insufficient and often water is not available due to supply interruptions.[37] A higher percentage of kiosk users reports scarcity than households with mains connections, suggesting that in times of scarcity kiosks are less likely to receive water than domestic connections.[38]
According to residents, "water is highly contaminated, smells, has a weird color and has particles inside", "because old, rusty pipes often break and water is polluted by the open drainage lines and sewage lines which run parallel to the water network".[39] In 2003, when the new water law was passed, the government threatened to shut down kiosks that were not properly registered, saying that they overcharged the poor and did not pay their bills to the city. As a result, in 2004 kiosk owners formed an association called Maji Bora Kibera (MBK) – the Swahili translation of 'better water services for Kibera'. They engaged in a dialogue with the government, paid their arrears, committed not to pay bribes and were trained on courtesy and customer relations.[34]
One of the reasons for high water prices charged by kiosks was, and perhaps still is, that kiosk owners have to pay bribes to officials, both to allow the initial construction and to operate the kiosks. To register a water connection the utility requires the applicant's plot number, address details, a landlord's certification as a proof of residence, and a certificate of employment. The kiosk operators often do not have these documents and thus pay bribes. Another reason for high prices is that unregistered kiosk owners are not charged at the preferential bulk sale rate, but rather at the increasing-block rate for residential customers.[34] A 1997 study showed that there is substantial competition between nearby water kiosks. Profits of kiosk owners were low and high prices were caused primarily by high costs.[37]
The membership in Maji Bora Kibera dropped from the initial 1500 kiosk owners to only 195 who had paid their membership dues in early 2005.[40] Six years later, the problems had apparently not been resolved. According to statements made at community meetings in the slums of Kibera and Mathare in September 2011, so-called cartels still try to monopolise water supply, resorting even to violence to keep prices high. Allegedly, local politicians back these cartels. The cartels “create artificial water shortages and, through vandalism and threats, hike up prices”.[39]
External co-operation
The World Bank, the French Development Agency and the African Development Bank finance investments in water supply and sanitation in Nairobi.
See also
External links
- Athi Water Services Board
- Nairobi City Water and Sewerage Company
- YouTube: Peter Kuguru, Chairman of the Board of NWC, in April 2011 at a news conference where he showed up apparently drunk
References
- 1 2 3 Karanja, Joseph. "Improving water provision in Nairobi through control of non-revenue water" (PDF). Global Water Summit 2011. Global Water Intelligence. pp. 212–213. Retrieved 6 November 2011.
- 1 2 3 Nairobi Water Company profile, Retrieved 6 November 2011
- 1 2 Moriasi, Daniel; et al. (2007). Hydrologic And Environmental Impacts of Conservation Practices in Oklahoma Agricultural Watersheds (abstract). United States Department of Agriculture, Agricultural Research Service. p. 1. Retrieved 6 November 2011.
- 1 2 3 4 5 World Bank Operations Evaluation Department:"Kenya: Development of Housing, Water Supply, and Sanitation in Nairobi," by Tauno Skytta and Jean-Francois Landeau. Report No. 15586, April 1996.
- 1 2 H.W. Pearson, S.T. Avery, S.W. Mills, P. Njaggah and P. Odiambo Performance of the phase II Dandora waste stabilisation ponds: The case for anaerobic ponds, Water Science and Technology Volume 33, Issue 7, 1996, Pages 91–98. Retrieved 6 November 2011
- 1 2 IRC E-source (7 August 2009). "Kenya: Nairobi water board sent packing following reports on malpractices". Retrieved 12 November 2011.
- ↑ Afrfican Development Bank (July 1998). "Project Completion Report:Third Nairobi Water Supply Project" (PDF). pp. 1 and 9. Retrieved 6 November 2011.
- ↑ African Development Bank:Project Completion Report:Third Nairobi Water Supply Project, July 1998, p. 16
- 1 2 3 4 Water Services Regulatory Board. "Impact Report 2011. A Performance Report of Kenya's Water Services Sector.". Retrieved 23 February 2012.
- 1 2 Egis Bceom International in association with Mangat, I.B. Patel & Partner (2011). "Feasibility Study and Master Plan for Developing new water sources for Nairobi and satellite towns" (PDF). Athi Water Services Board. pp. 7.2–7.3. Retrieved 7 November 2011.
- ↑ African Development Bank:Project Completion Report:Third Nairobi Water Supply Project, July 1998, p. 12-13 and p. 18
- 1 2 BBC:Nairobi water 'stolen for farms', 10 July 2009, Retrieved 6 November 2011
- ↑ K24TV (18 July 2009). "Nairobi water shortage deepens". Retrieved 13 November 2011.
- ↑ NTV (Kenya) (8 July 2009). "City Council accuses NWSC of creating water shortage". Retrieved 13 November 2011.
- ↑ Daily Nation, 28 October 2010: Nairobi mayor leaves office over cemetery scandal
- 1 2 Mbugua Njoroge: 1 USD billion Master Plan to Tap City’s Water Woes, Retrieved 6 November 2011
- 1 2 Jambo Nairobi. "Water supply to Nairobi". Retrieved 6 November 2011.
- 1 2 Aquaclean Services Limited (2010). "Environmental Impact Assessment Report for Nairobi Informal Settlements Water and Sanitation Improvement Projects". National Environment Management Authority. Retrieved 6 November 2011.
- ↑ African Development Bank:Project Completion Report:Third Nairobi Water Supply Project, July 1998, p. 9
- ↑ Nairobi City Water and Sewerage Company:Map of Nairobi water sources
- ↑ Athi Water Services Board (6 June 2011). "Sasumua Dam Commissioned". Retrieved 13 November 2011.
- ↑ Stephen Foster & Albert Tuinhof (March 2005). "Kenya: The Role of Groundwater in the Water-Supply of Greater Nairobi" (PDF). Sustainable Groundwater Management: Concepts and Tools GW•MATE Briefing Note Series Sustainable Groundwater Management Lessons from Practice. World Bank GWMATE. Retrieved 6 November 2011.
- ↑ Athi Water Services Board:Projects, 6 November 2011
- ↑ Engineering and Consulting Firms Association, Japan Nippon Koei Co., Ltd. (March 2008). "Project Formulation Study on Nairobi Metropolitan Development Planning Project" (PDF). p. 11. Retrieved 7 November 2011.
- ↑ Nairobi City Water & Sewerage Company. "Waste water treatment". Retrieved 6 November 2011.
- ↑ Athi Water Services Board Retrieved 6 November 2011
- ↑ Athi Water Services Board. "Meet the team". Retrieved 13 November 2011.
- ↑ Athi Water Services Board (22 July 2011). "Eng. Malaquen Milgo appointed new Chief Executive Officer, Athi Water Services Board". Retrieved 13 November 2011.
- ↑ Athi Water Services Board. "AWSB ISO 9001:2008 Certified". Retrieved 13 November 2011.
- ↑ Kenya Alliance of Resident Associations (13 October 2011). "Nairobi Water Crisis: Mugo fights his way back". Retrieved 13 November 2011.
- ↑ Athi Water Service Board. "Water Service Providers". Retrieved 6 November 2011.
- ↑ Runda Estate Association website Retrieved 6 November 2011
- ↑ Nairobi City Water & Sewerage Company. "Regular Tariff Adjustment in Athi Water Services Board (AWSB)" (PDF). Retrieved 6 November 2011.
- 1 2 3 4 5 Water and Sanitation Program of the World Bank:Rogues No More? Water Kiosk Operators Achieve Credibility in Kibera, June 2005, p. 9-11
- ↑ NTVKenya on Youtube (8 January 2011). "Nairobi water boost". Retrieved 13 November 2011. This video includes interviews with Philip Gichuki, managing director of Nairobi Water Company and Reuben Ndolo, Chairman of Athi Water Services Board.
- ↑ Capital Business (26 April 2010). "Kenya, Nairobi: paying water bills simplified". Retrieved 2 September 2012.
- 1 2 3 Suzanne Snell:Water and sanitation for the urban poor.Small-Scale Providers:Typology and Profiles, 1998, UNDP-World Bank Water and Sanitation Program, p.19-20
- ↑ Citizens' Report Card on urban water, sanitation and solid waste services in Kenya, 2007 6 November 2011
- 1 2 Water Hackathon: Water Problems in Nairobi, Retrieved 6 November 2011
- ↑ John Momanyi Birongo; Nhi Quyen Le (2005). "An analysis of water Governance in Kibera, Kenya" (PDF). First Year Project. Roskilde University Center – international master of science in environmental policy and the global challenges 2004/2005. pp. 70–78. Retrieved 9 November 2011.