VisIt
|
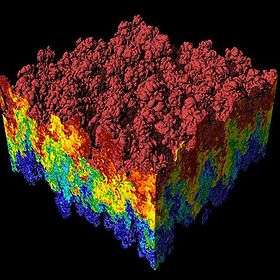
Image of Rayleigh–Taylor instability, as Visualized by VisIt | |
| Developer(s) | Lawrence Livermore National Laboratory |
|---|---|
| Stable release |
2.12[1]
|
| Written in | C, C++ |
| Operating system | Unix/Linux, Mac OS X, Microsoft Windows |
| Type | Scientific visualization, Interactive visualization |
| License | BSD |
| Website | visit.llnl.gov |
VisIt is an open source interactive parallel visualization and graphical analysis tool for viewing scientific data. It can be used to visualize scalar and vector fields defined on 2D and 3D structured and unstructured meshes. VisIt was designed to handle very large data set sizes in the terascale range and yet can also handle small data sets in the kilobyte range.[2]
History
VisIt was developed by the Department of Energy (DOE) Advanced Simulation and Computing Initiative (ASCI) to visualize and analyze the results of terascale simulations. It was developed as a framework for adding custom capabilities and rapidly deploying new visualization technologies. After an initial prototype effort, work on VisIt began in the summer of 2000, and the initial version of VisIt was released in the fall of 2002. Although the primary driving force behind the development of VisIt was for visualizing extremely large data, it is also well suited for visualizing data from typical simulations on desktop systems. Because of its applicability beyond visualizing terascale data, VisIt is made freely available. In 2005 it won an R&D 100 Award.[3][4]
VisIt is now supported by the DOE's SciDAC (Scientific Discovery Through Advanced Computing)[5] program to assist with analysis and visualization of the large datasets generated by open scientific computing. As such, it is now developed in part by many organizations, including Oak Ridge National Laboratory, Lawrence Berkeley National Laboratory, and the University of California, Davis, among others. Since VisIt is open source and released under the BSD license, many others have made contributions as well.
Summary
VisIt is an open source, turnkey application for large scale simulated and experimental data sets. Its charter goes beyond pretty pictures; the application is an infrastructure for parallelized, general post-processing of extremely massive data sets. Target use cases include data exploration, comparative analysis, visual debugging, quantitative analysis, and presentation graphics.
The VisIt product delivers the efforts of many software developers in a single package. First, VisIt leverages several third party libraries: the Qt widget library for its user interface, the Python programming language for a command line interpreter, and the Visualization ToolKit (VTK) library for its data model and many of its visualization algorithms. On top of that, an additional fifty man-years worth of effort have been devoted to the development of VisIt itself. The VisIt-specific effort has largely been focused on parallelization for large data sets, user interface, implementing custom data analysis routines, addressing non-standard data models (such as adaptive mesh refinement (AMR) and mixed materials zones), and creating a robust overall product. VisIt consists over one and a half million lines of code, and its third party libraries have an additional million lines of code. It has been ported to Windows, Mac, and many Unix variants, including AIX, IRIX, Solaris, Tru64, and Linux, including ports for SGI's Altix, Cray's XT4, and many commodity clusters.
The basic design is a client–server model, where the server is parallelized. The client–server aspect allows for effective visualization in a remote setting, while the parallelization of the server allows for the largest data sets to be processed reasonably interactively. The tool has been used to visualize many large data sets, including a twenty seven billion data point structured grid, a one billion point particle simulation, and curvilinear, unstructured, and AMR meshes with hundreds of millions to billions of elements. The most common form of the server is as a stand-alone process that reads in data from files. However, an alternate form exists where a simulation code can link in "lib-VisIt" and become itself the server, allowing for in situ visualization and analysis.
VisIt follows a data flow network paradigm where interoperable modules are connected to perform custom analysis. The modules come from VisIt's five primary user interface abstractions and there are many examples of each. There are twenty one "plots" (ways to render data), forty-two "operators" (ways to manipulate data), eighty-five file format readers, over fifty "queries" (ways to extract quantitative information), and over one hundred "expressions" (ways to create derived quantities). Further, a plugin capability allows for dynamic incorporation of new plot, operator, and database modules. These plugins can be partially code generated, even including automatic generation of Qt and Python user interfaces.
The VisIt project originated at Lawrence Livermore National Laboratory as part of the Advanced Simulation and Computing (ASC) program of the Department of Energy's (DOE) National Nuclear Security Agency, but it has gone on to become a distributed project being developed by several groups. Major hubs for the project come from:
- VACET,[6] a center for enabling technologies from DOE's SciDAC (Scientific Discovery through Advanced Computing) program from its Office of Science,
- from ASC, and
- from GNEP (the Global Nuclear Energy Partnership from the DOE's Office of Nuclear Energy).
The project has twenty developers from many organizations and universities, including five DOE Laboratories. VisIt received an R&D 100 Award in 2005 and is downloaded approximately twenty five thousand times per year.
Features
- Has rich feature set for scalar, vector, and tensor field visualization. VisIt handles 2D and 3D data equally well. VisIt also has the ability to animate data, allowing users to see the time evolution of their data.
- Provides qualitative and quantitative visualization and analysis. VisIt provides support for derived fields, which allow new fields to be calculated using existing fields. For example, if a dataset contains a velocity field, it is possible to define a new field that is the velocity magnitude. It also supports a generalized query interface, which allows you to query derived quantities such as volume or surface area.
- Supports multiple mesh types. VisIt provides support for a wide range of computational meshes, including two- and three-dimensional point, rectilinear, curvilinear, and unstructured meshes. In addition, VisIt supports structured AMR meshes and CSG meshes.
- Powerful, full-featured graphical user interface. VisIt’s graphical user interface allows novice users to quickly get started visualizing their data, as well as allowing power users access to advanced features. It automatically creates time-based animations from data sets that contain multiple time steps. In addition, it also has a keyframe animation capability that allows users to create sophisticated animations. VisIt allows users to pan, zoom, and rotate objects interactively using the mouse. It also gives users the ability to interactively size and position geometric objects such as planes and spheres.
- Parallel and distributed architecture. VisIt employs a distributed and parallel architecture in order to handle extremely large data sets interactively. VisIt’s rendering and data processing capabilities are split into viewer and engine components that may be distributed across multiple machines:
- Viewer is responsible for rendering and is typically run on a local desktop or visualization server so that it can leverage the extremely powerful graphics cards.
- Engine is responsible for the bulk of the data processing and input/output and is typically run on a remote machine where the data is located. This eliminates the need move the data and makes high-end compute and I/O resources available to it. The engine can be run serially on a single processor or in parallel on thousands of processors.
- Interfaces with C++, Python, and Java. The C++ and Java interfaces make it possible to provide alternate user interfaces for VisIt or allow existing C++ or Java applications to add visualization support. The Python scripting interface gives users the ability to batch process data using a scripting language. This feature can be used to create extremely sophisticated animations or implement regression suites.
- Extensible with dynamically loaded plug-ins. VisIt achieves extensibility through the use of dynamically loaded plugins. All of VisIt’s plots, operators, and database readers are implemented as plugins and are loaded at run-time from the plugin directory. New plugins can be added simply by installing them in this directory. VisIt comes with a graphical plugin creation tool, which greatly simplifies the process of creating new plugins.
See also
References
External links
- VisIt user community web site with wiki, forum, etc.
- Examples of visualizations on the official homepage.