United States presidential election in New York, 1996
| | |||||||||||||||||||||||||||||||||||||||
| |||||||||||||||||||||||||||||||||||||||
| |||||||||||||||||||||||||||||||||||||||
|
| |||||||||||||||||||||||||||||||||||||||
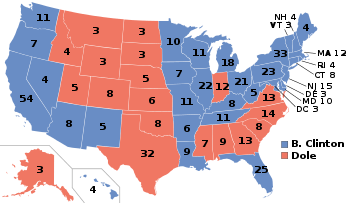
| County Results
Clinton—80-90%
Clinton—70-80%
Clinton—60-70%
Clinton—50-60%
Clinton—<50%
Dole—<50%
Dole—50-60% | |||||||||||||||||||||||||||||||||||||||
| |||||||||||||||||||||||||||||||||||||||

The 1996 United States presidential election in New York took place on November 5, 1996, as part of the 1996 United States presidential election. Voters chose 33 representatives, or electors to the Electoral College, who voted for President and Vice President.
New York, a reliable blue state that no Republican has won since 1984, was won by incumbent Democratic President Bill Clinton of Arkansas and Vice President Al Gore of Tennessee, over the Republican ticket of Senator Bob Dole of Kansas and Representative Jack Kemp of New York. Clinton carried New York by a landslide 28.86% margin of victory, taking 59.47% of the vote to Dole's 30.61%, even though Republican vice presidential candidate Jack Kemp was from New York. Reform Party candidate Ross Perot finished in third with 7.97% of the popular vote.
Clinton improved dramatically on his 1992 showing in New York, when he had won the state with a 49.73% plurality. 1996 firmly entrenched New York's status in the modern era as a Democratic stronghold, rather than the swing state it had been in the 1970s and 1980s. Many upstate counties which had usually voted Republican were won by the Democratic ticket. Clinton also managed to sweep traditionally Republican suburbs around New York City, being the first Democrat since 1964 to win Republican bastions like Staten Island and Suffolk County. In Westchester County, Clinton increased his lead from an 8.5% win in 1992 to a 21-point sweep in 1996 (he later moved to Westchester County in 2000). Many of these gains would be preserved in future elections; since 1996, no Democratic presidential candidate has gotten less than 58% of the vote in New York State.
Results
| United States presidential election in New York, 1996[1] | |||||
|---|---|---|---|---|---|
| Party | Candidate | Votes | Percentage | Electoral votes | |
| Democratic | Bill Clinton | 3,649,630 | 57.78% | ||
| Liberal | Bill Clinton | 106,547 | 1.69% | ||
| Total | Bill Clinton (incumbent) | 3,756,177 | 59.47% | 33 | |
| Republican | Bob Dole | 1,738,707 | 27.53% | ||
| Conservative | Bob Dole | 183,392 | 2.90% | ||
| Freedom | Bob Dole | 11,393 | 0.18% | ||
| Total | Bob Dole | 1,933,492 | 30.61% | 0 | |
| Reform | Ross Perot | 503,458 | 7.97% | 0 | |
| Green | Ralph Nader | 75,956 | 1.20% | 0 | |
| Right to Life (a) | Howard Phillips | 23,580 | 0.37% | 0 | |
| Libertarian | Harry Browne | 12,220 | 0.19% | 0 | |
| Natural Law | John Hagelin | 5,011 | 0.08% | 0 | |
| Workers World | Monica Moorehead | 3,473 | 0.05% | 0 | |
| Socialist Workers | James Harris | 2,762 | 0.04% | 0 | |
| Totals | 6,316,129 | 100.0% | 33 | ||
| Voter turnout | 43% | — | |||
(a) Howard Phillips was then nominee of the Constitution Party nationally.
Results Breakdown
By county
| County | Clinton | Dole | Perot | Other | ||||
|---|---|---|---|---|---|---|---|---|
| Albany | 61.0% | 85,993 | 28.2% | 39,785 | 8.5% | 11,957 | 2.3% | 3,256 |
| Allegany | 37.4% | 6,621 | 45.8% | 8,107 | 15.4% | 2,730 | 1.4% | 245 |
| Bronx | 85.8% | 248,276 | 10.5% | 30,435 | 2.5% | 7,186 | 1.2% | 3,453 |
| Broome | 51.2% | 44,407 | 36.1% | 31,327 | 10.5% | 9,114 | 2.3% | 1,966 |
| Cattaraugus | 41.2% | 13,029 | 41.0% | 12,971 | 16.3% | 5,151 | 1.6% | 492 |
| Cayuga | 49.8% | 15,879 | 34.8% | 11,093 | 13.9% | 4,420 | 1.6% | 502 |
| Chautauqua | 47.7% | 26,831 | 37.8% | 21,261 | 13.3% | 7,484 | 1.3% | 714 |
| Chemung | 47.4% | 16,977 | 39.9% | 14,287 | 11.1% | 3,967 | 1.6% | 582 |
| Chenango | 45.6% | 8,797 | 38.0% | 7,319 | 14.6% | 2,822 | 1.8% | 341 |
| Clinton | 52.9% | 15,386 | 33.6% | 9,759 | 12.0% | 3,488 | 1.5% | 427 |
| Columbia | 47.1% | 12,910 | 37.7% | 10,324 | 12.6% | 3,466 | 2.6% | 703 |
| Cortland | 46.9% | 9,130 | 39.1% | 7,606 | 12.3% | 2,398 | 1.6% | 315 |
| Delaware | 45.0% | 8,724 | 39.6% | 7,684 | 13.4% | 2,601 | 2.0% | 385 |
| Dutchess | 45.6% | 47,339 | 40.4% | 41,929 | 11.8% | 12,294 | 2.2% | 2,259 |
| Erie | 54.7% | 224,554 | 32.3% | 132,343 | 11.1% | 45,679 | 1.9% | 7,658 |
| Essex | 46.5% | 7,893 | 37.6% | 6,379 | 13.9% | 2,363 | 2.1% | 351 |
| Franklin | 51.8% | 8,494 | 30.9% | 5,072 | 15.2% | 2,499 | 2.0% | 329 |
| Fulton | 46.3% | 9,779 | 37.3% | 7,881 | 15.2% | 3,214 | 1.2% | 256 |
| Genesee | 41.6% | 10,074 | 44.6% | 10,821 | 12.4% | 2,996 | 1.4% | 347 |
| Greene | 41.0% | 8,251 | 43.3% | 8,712 | 13.9% | 2,790 | 1.8% | 371 |
| Hamilton | 34.0% | 1,228 | 51.0% | 1,841 | 13.6% | 492 | 1.4% | 51 |
| Herkimer | 44.7% | 11,910 | 37.9% | 10,085 | 15.9% | 4,235 | 1.5% | 396 |
| Jefferson | 49.2% | 16,783 | 36.2% | 12,362 | 13.4% | 4,561 | 1.2% | 421 |
| Kings | 80.1% | 432,232 | 15.1% | 81,406 | 2.8% | 15,031 | 2.1% | 11,164 |
| Lewis | 43.2% | 4,402 | 38.9% | 3,965 | 16.4% | 1,669 | 1.5% | 149 |
| Livingston | 43.2% | 10,868 | 43.7% | 10,981 | 11.5% | 2,889 | 1.6% | 400 |
| Madison | 43.8% | 11,832 | 42.0% | 11,324 | 12.5% | 3,379 | 1.7% | 453 |
| Monroe | 53.2% | 164,858 | 37.3% | 115,694 | 7.7% | 23,936 | 1.8% | 5,506 |
| Montgomery | 49.5% | 10,485 | 33.9% | 7,172 | 15.4% | 3,253 | 1.2% | 256 |
| Nassau | 55.7% | 303,587 | 36.1% | 196,820 | 6.6% | 36,122 | 1.5% | 8,135 |
| New York | 80.0% | 394,131 | 13.8% | 67,839 | 2.3% | 11,144 | 4.0% | 19,785 |
| Niagara | 49.4% | 44,203 | 35.1% | 31,438 | 14.0% | 12,564 | 1.4% | 1,239 |
| Oneida | 46.8% | 44,399 | 40.0% | 37,996 | 11.9% | 11,296 | 1.3% | 1,238 |
| Onondaga | 51.4% | 100,190 | 37.8% | 73,771 | 9.0% | 17,602 | 1.7% | 3,376 |
| Ontario | 46.2% | 19,156 | 41.6% | 17,237 | 10.6% | 4,391 | 1.6% | 655 |
| Orange | 48.0% | 54,995 | 40.1% | 45,956 | 10.3% | 11,778 | 1.6% | 1,809 |
| Orleans | 40.8% | 6,233 | 45.0% | 6,865 | 13.0% | 1,986 | 1.2% | 184 |
| Oswego | 44.8% | 20,440 | 37.6% | 17,159 | 16.4% | 7,499 | 1.3% | 575 |
| Otsego | 47.5% | 11,470 | 36.4% | 8,774 | 13.3% | 3,217 | 2.8% | 665 |
| Putnam | 42.1% | 16,173 | 45.4% | 17,452 | 10.5% | 4,032 | 2.0% | 775 |
| Queens | 72.9% | 372,925 | 21.1% | 107,650 | 4.4% | 22,288 | 1.6% | 8,433 |
| Rensselaer | 50.7% | 34,273 | 34.7% | 23,482 | 12.4% | 8,405 | 2.2% | 1,465 |
| Richmond | 50.5% | 64,684 | 40.8% | 52,207 | 7.0% | 8,968 | 1.7% | 2,148 |
| Rockland | 56.2% | 63,127 | 36.0% | 40,395 | 6.1% | 6,798 | 1.7% | 1,921 |
| St. Lawrence | 56.7% | 21,798 | 28.1% | 10,827 | 13.8% | 5,309 | 1.4% | 543 |
| Saratoga | 46.5% | 39,832 | 40.1% | 34,337 | 11.8% | 10,141 | 1.6% | 1,355 |
| Schenectady | 53.1% | 35,404 | 33.1% | 22,106 | 11.8% | 7,865 | 2.0% | 1,334 |
| Schoharie | 44.5% | 5,902 | 40.4% | 5,353 | 13.5% | 1,796 | 1.6% | 210 |
| Schuyler | 43.3% | 3,303 | 41.0% | 3,134 | 13.6% | 1,037 | 2.1% | 161 |
| Seneca | 48.9% | 6,825 | 35.9% | 5,004 | 13.5% | 1,889 | 1.7% | 237 |
| Steuben | 37.9% | 14,481 | 46.4% | 17,710 | 14.4% | 5,496 | 1.3% | 484 |
| Suffolk | 51.8% | 261,828 | 36.1% | 182,510 | 10.3% | 52,209 | 1.7% | 8,666 |
| Sullivan | 53.3% | 15,052 | 33.0% | 9,321 | 12.2% | 3,453 | 1.5% | 418 |
| Tioga | 41.2% | 8,769 | 44.2% | 9,416 | 12.8% | 2,721 | 1.8% | 376 |
| Tompkins | 56.0% | 20,772 | 31.1% | 11,532 | 7.1% | 2,623 | 5.9% | 2,197 |
| Ulster | 48.5% | 35,852 | 35.5% | 26,212 | 12.5% | 9,246 | 3.4% | 2,541 |
| Warren | 43.3% | 11,603 | 41.6% | 11,152 | 13.5% | 3,623 | 1.5% | 413 |
| Washington | 42.5% | 9,572 | 39.7% | 8,954 | 16.2% | 3,648 | 1.6% | 370 |
| Wayne | 42.1% | 15,145 | 44.0% | 15,837 | 12.8% | 4,619 | 1.1% | 396 |
| Westchester | 56.9% | 196,310 | 35.9% | 123,719 | 5.2% | 18,028 | 2.0% | 6,806 |
| Wyoming | 36.2% | 5,735 | 47.3% | 7,477 | 15.2% | 2,411 | 1.3% | 198 |
| Yates | 43.6% | 4,066 | 42.1% | 3,925 | 12.8% | 1,190 | 1.6% | 146 |
- ↑ "Dave Leip's Atlas of U.S. Presidential Elections 1996 - New York". Retrieved January 7, 2013.
| Candidates |
|  |
|---|---|---|
| General articles |
| |
| Local results |
| |
| Other 1996 elections | ||