United States presidential election in New Jersey, 2012
| | ||||||||||||||||||||||||||||||||
| ||||||||||||||||||||||||||||||||
| ||||||||||||||||||||||||||||||||
|
| ||||||||||||||||||||||||||||||||
| County Results Obama—70-80%
Obama—60-70%
Obama—50-60%
Obama—<50%
Romney—50-60% | ||||||||||||||||||||||||||||||||
| ||||||||||||||||||||||||||||||||

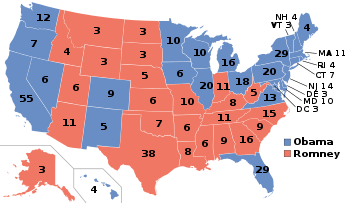
The 2012 United States presidential election in New Jersey took place on November 6, 2012 as part of the 2012 General Election in which all 50 states plus The District of Columbia participated. New Jersey voters chose 14 electors to represent them in the Electoral College via a popular vote pitting incumbent Democratic President Barack Obama and his running mate, Vice President Joe Biden, against Republican challenger and former Massachusetts Governor Mitt Romney and his running mate, Congressman Paul Ryan.
Due to the difficulty of getting to polling places because of the damage caused by Hurricane Sandy, voters who were displaced were allowed to vote electronically. Officials were not prepared for the 15 minutes that it took to validate each request, and were deluged by voters who were not displaced asking to vote electronically, so voting was extended until Friday, November 9, at 8 PM. Requests had to be submitted by 5 PM.[1]
New Jersey was won by President Obama with 58.38% of the vote to Romney's 40.59%, a 17.79% margin of victory.[2] New Jersey was one of just six states to swing in President Obama's favor between 2008 and 2012, giving him the largest vote share for a Democratic presidential nominee in the state since the 1964 Democratic landslide.
General election
Candidate Ballot Access:[3]
- Barack Obama/Joseph Biden, Democratic
- Mitt Romney/Paul Ryan, Republican
- Merlin Miller/Harry Bertram, American Third Position
- Virgil Goode/Jim Clymer, Constitution
- Jill Stein/Cheri Honkala, Green
- Gary Johnson/James P. Gray, Libertarian
- Rocky Anderson/Luis J. Rodriguez, Justice
- Jeff Boss/Bob Pasternak, NSA Did 911
- Peta Lindsay/Yari Osorio, Socialism and Liberation
- James Harris/Maura Deluca, Socialist Workers
Results
| United States presidential election in New Jersey, 2012[2] | ||||||
|---|---|---|---|---|---|---|
| Party | Candidate | Running mate | Votes | Percentage | Electoral votes | |
| Democratic | Barack Obama | Joe Biden | 2,125,101 | 58.38% | 14 | |
| Republican | Mitt Romney | Paul Ryan | 1,477,568 | 40.59% | 0 | |
| Libertarian | Gary Johnson | Jim Gray | 21,045 | 0.58% | 0 | |
| Green | Jill Stein | Cheri Honkala | 9,888 | 0.27% | 0 | |
| Constitution | Virgil Goode | Jim Clymer | 2,064 | 0.06% | 0 | |
| Justice | Rocky Anderson | Luis J. Rodriguez | 1,724 | 0.05% | 0 | |
| NSA Did 911 | Jeff Boss | Bob Pasternak | 1,007 | 0.03% | 0 | |
| Socialist Workers | James Harris | Maura Deluca | 710 | 0.02% | 0 | |
| American Third Position | Merlin Miller | Harry Bertram | 664 | 0.02% | 0 | |
| Socialism and Liberation | Peta Lindsay | Yari Osorio | 521 | 0.01% | 0 | |
| Totals | 3,640,292 | 100.00% | 14 | |||
| Voter Turnout (Registered) | 66.4% | |||||
By county

-Blue municipalities won by Obama
-Red municipalities won by Romney
| County | Obama% | Obama# | Romney% | Romney# | Johnson% | Johnson# | Stein% | Stein# | Others% | Others# | Total |
|---|---|---|---|---|---|---|---|---|---|---|---|
| Atlantic | 57.96% | 65,600 | 41.10% | 46,522 | 0.51% | 579 | 0.18% | 203 | 0.24% | 275 | 113,179 |
| Bergen | 55.20% | 212,754 | 43.87% | 169,070 | 0.45% | 1,752 | 0.33% | 1,270 | 0.15% | 561 | 385,407 |
| Burlington | 58.53% | 126,377 | 40.48% | 87,401 | 0.63% | 1,367 | 0.24% | 528 | 0.12% | 263 | 215,936 |
| Camden | 68.17% | 153,682 | 30.82% | 69,476 | 0.55% | 1,250 | 0.31% | 697 | 0.14% | 323 | 225,428 |
| Cape May | 45.18% | 21,657 | 53.79% | 25,781 | 0.53% | 253 | 0.23% | 112 | 0.27% | 128 | 47,932 |
| Cumberland | 61.59% | 34,055 | 37.36% | 20,658 | 0.51% | 283 | 0.21% | 117 | 0.32% | 179 | 55,292 |
| Essex | 78.09% | 236,618 | 21.25% | 64,406 | 0.32% | 962 | 0.20% | 602 | 0.14% | 431 | 303,019 |
| Gloucester | 54.74% | 74,013 | 43.98% | 59,456 | 0.77% | 1,040 | 0.40% | 539 | 0.11% | 155 | 135,203 |
| Hudson | 77.52% | 153,108 | 21.45% | 42,369 | 0.51% | 1,002 | 0.34% | 674 | 0.18% | 351 | 197,504 |
| Hunterdon | 40.42% | 26,876 | 58.18% | 38,687 | 0.83% | 549 | 0.36% | 238 | 0.22% | 144 | 66,495 |
| Mercer | 67.99% | 104,377 | 30.85% | 47,355 | 0.60% | 915 | 0.35% | 530 | 0.22% | 334 | 153,511 |
| Middlesex | 63.24% | 190,555 | 35.61% | 107,310 | 0.61% | 1,851 | 0.28% | 852 | 0.25% | 747 | 301,315 |
| Monmouth | 46.89% | 133,145 | 51.95% | 147,513 | 0.78% | 2,228 | 0.25% | 708 | 0.14% | 384 | 283,979 |
| Morris | 44.04% | 100,146 | 54.95% | 124,947 | 0.60% | 1,375 | 0.21% | 485 | 0.19% | 439 | 227,393 |
| Ocean | 40.71% | 102,300 | 58.29% | 146,474 | 0.58% | 1,467 | 0.20% | 507 | 0.21% | 525 | 251,274 |
| Passaic | 63.70% | 115,926 | 35.45% | 64,523 | 0.39% | 717 | 0.28% | 515 | 0.17% | 307 | 181,988 |
| Salem | 49.89% | 14,719 | 48.59% | 14,334 | 0.83% | 248 | 0.40% | 121 | 0.26% | 79 | 29,502 |
| Somerset | 52.19% | 74,592 | 46.60% | 66,603 | 0.76% | 1,088 | 0.25% | 358 | 0.20% | 280 | 142,921 |
| Sussex | 38.43% | 26,104 | 59.80% | 40,625 | 1.11% | 757 | 0.38% | 255 | 0.28% | 192 | 67,934 |
| Union | 66.60% | 139,752 | 32.56% | 68,314 | 0.45% | 952 | 0.20% | 410 | 0.19% | 403 | 209,831 |
| Warren | 41.41% | 18,745 | 56.87% | 25,744 | 0.91% | 410 | 0.37% | 167 | 0.45% | 204 | 45,271 |
| Totals | 58.38% | 2,125,101 | 40.59% | 1,477,568 | 0.58% | 21,045 | 0.27% | 9,888 | 0.18% | 6,704 | 3,640,292 |
Democratic primary
Incumbent Barack Obama ran unopposed[4] in the Democratic primary held on June 5, 2012. He received 283,673 votes[5] according to the Secretary of State, though county clerks' websites report write-in votes as well. The state's 172 delegates voted unanimously for Obama at the 2012 Democratic National Convention in Charlotte, North Carolina.[6]
Republican primary
| | ||||||||||||||||||||||||||||
| ||||||||||||||||||||||||||||
| ||||||||||||||||||||||||||||
The Republican primary occurred on June 5, 2012.[7][8]
New Jersey sent fifty delegates to the Republican National Convention on August 5, 2012. All fifty delegates were awarded by a winner-take-all statewide vote. New Jersey Republican Party rules obligate and require the delegates to cast their vote for the winner of the primary on the first three ballots at the convention.[9]
| New Jersey Republican primary, 2012[5] | |||
|---|---|---|---|
| Candidate | Votes | Percentage | Delegates |
| |
188,121 | 81.3% | 50 |
| Ron Paul | 24,017 | 10.4% | 0 |
| Rick Santorum | 12,115 | 5.2% | 0 |
| Newt Gingrich | 7,212 | 3.1% | 0 |
| Pledged leaders: | 3 | ||
| Total: | 231,465 | 100.0% | 50 |
| Key: | Withdrew prior to contest |
| Elections in New Jersey | ||||||||
|---|---|---|---|---|---|---|---|---|
 | ||||||||
|
||||||||
|
||||||||
2012 U.S. Presidential Election |
|---|
| Democratic Party |
| Republican Party |
|
References
- ↑ "New Jersey's email voting suffers major glitches, deadline extended to Friday". Retrieved 2012-11-09.
- 1 2 "New Jersey Division of Elections Official General Election Results" (PDF). Retrieved 7 December 2012.
- ↑ "Official List Candidates for President For GENERAL ELECTION 11/06/2012 Election" (PDF). New Jersey Secretary of State - Division of Elections. September 13, 2012. Retrieved December 11, 2012.
- ↑ "Official List Candidates for President For PRIMARY ELECTION 06/05/2012 Election" (PDF). New Jersey Department of State - Division of Elections. April 12, 2012. Retrieved December 11, 2012.
- 1 2 "Official List Candidates for President For PRIMARY ELECTION 06/05/2012 Election" (PDF). New Jersey Department of State - Division of Elections. July 23, 2012. Retrieved December 11, 2012.
- ↑ "New Jersey Democratic Delegation 2012". The Green Papers. November 17, 2012. Retrieved December 11, 2012.
- ↑ "Primary and Caucus Printable Calendar". CNN. Retrieved January 11, 2012.
- ↑ "Presidential Primary Dates" (PDF). Federal Election Commission. Retrieved January 23, 2012.
- ↑ "2012 Presidential Primaries, Caucuses, and Conventions". The Green Papers. Retrieved March 4, 2012.
External links
- The Green Papers: for New Jersey
- The Green Papers: Major state elections in chronological order