United States elections, 2004
| Presidential election year | |
| Election day | November 2 |
|---|---|
| Presidential election | |
| Electoral vote | |
| George W. Bush (R) | 286 |
| John Kerry (D) | 251 |
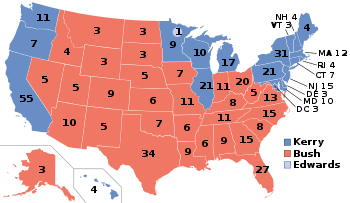 | |
| 2004 Presidential election results map. Red denotes states/districts won by Republican George W. Bush, and Blue denotes those won by Democrat John Kerry. Numbers indicate electoral votes allotted to the winner of each state. | |
| Senate elections | |
| Seats contested | 34 seats of Class III |
| Net change | Republican +4 |
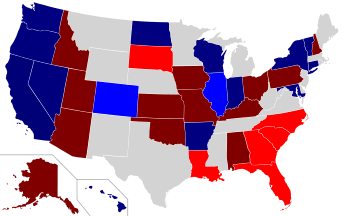 | |
| 2004 Senate election results map | |
| House elections | |
| Net change | Republican +3 |
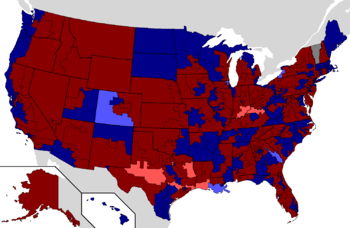 | |
| 2004 House election results map | |
| Gubernatorial elections | |
| Seats contested | 13 (11 states, 2 territories) |
| Net change | 0 |
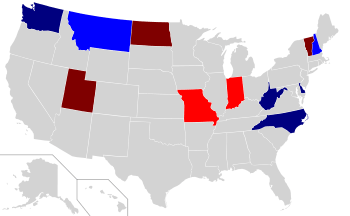 | |
| 2004 Gubernatorial election results map | |
| Legend | |
|
Democratic hold Democratic gain Republican hold Republican gain Independent hold | |
The 2004 United States elections were held on November 2, with President George W. Bush winning re-election. Riding Bush's coattails, the Republicans picked up net gains of 4 Senate seats and 3 House seats, increasing their majorities in both House in Congress. In the state governorships up for election, there was no net gain in seats for either party. Foreign policy was the dominant theme throughout the election campaign, particularly Bush's conduct of the War on Terrorism and the 2003 invasion of Iraq.
Federal
President
Republican incumbent President George W. Bush was re-elected, defeating Democratic Senator John Kerry from Massachusetts.
| Candidate | Votes | % | States led | National ECV |
|---|---|---|---|---|
| Republican George W. Bush | 62,040,610 | 50.73 | 31 | 286 |
| Democrat John Kerry | 59,028,444 | 48.27 | 19+DC | 251 |
| Independent Ralph Nader | 465,650 | 0.38 | - | - |
| Libertarian Michael Badnarik | 397,265 | 0.32 | - | - |
| Constitution Michael Peroutka | 143,630 | 0.12 | - | - |
| Green David Cobb | 119,859 | 0.096 | - | - |
| Peace and Freedom Leonard Peltier | 27,607 | 0.023 | - | - |
| Socialist Walt Brown | 10,837 | 0.009 | - | - |
| Socialist Workers Roger Calero, James Harris | 10,800 | 0.009 | - | - |
| None of these candidates (Nevada) | 3,688 | 0.003 | - | - |
| Thomas Harens | 2,387 | 0.002 | - | - |
| Prohibition Gene Amondson | 1,944 | 0.002 | - | - |
| Bill Van Auken | 1,857 | 0.002 | - | - |
| Workers World John Parker | 1,646 | 0.001 | - | - |
| Charles Jay | 946 | 0.001 | - | - |
| Stanford Andress | 804 | 0.001 | - | - |
| Prohibition Earl Dodge | 140 | 0.000 | - | - |
| Democrat John Edwards | - | - | - | 1 |
| Total | 122,267,553 | 100.000 | 50 + DC | 538 |
United States Congress
United States House of Representatives
Republicans gained a couple of seats in the House, mainly due to the 2003 Texas redistricting.
| Parties | Seats | Popular Vote | ||||||
|---|---|---|---|---|---|---|---|---|
| 2002 | 2004 | +/- | Strength | Vote | % | Change | ||
| Republican Party | 229 | 232 | +3 | 53.3% | 55,958,144 | 49.4% | -0.6% | |
| Democratic Party | 205 | 202 | -3 | 46.4% | 52,969,786 | 46.8% | +1.6% | |
| Libertarian Party | — | — | — | — | 1,056,844 | 0.9% | -0.5% | |
| Independent | 1 | 1 | 0 | 0.2% | 674,202 | 0.6% | +0.1% | |
| Green Party | — | — | — | — | 344,549 | 0.3% | -0.1% | |
| Constitution Party | — | — | — | — | 187,006 | 0.2% | - | |
| Reform Party | — | — | — | — | 85,539 | 0.1% | +0.1% | |
| Independence Party | — | — | — | — | 76,053 | 0.1% | +0.1% | |
| Conservative Party | — | — | — | — | 51,529 | <0.1% | -0.1% | |
| Peace and Freedom Party | — | — | — | — | 29,684 | <0.1% | - | |
| Peace and Justice Party | — | — | — | — | 20,106 | <0.1% | - | |
| Socialist Equality Party | — | — | — | — | 8,586 | <0.1% | - | |
| Personal Choice Party | — | — | — | — | 7,806 | <0.1% | - | |
| Marijuana Party | — | — | — | — | 4,914 | <0.1% | - | |
| Healthcare Party | — | — | — | — | 3,285 | <0.1% | - | |
| Working Families Party | — | — | — | — | 3,196 | <0.1% | - | |
| Liberty Union Party | — | — | — | — | 3,018 | <0.1% | - | |
| Socialist Workers Party | — | — | — | — | 2,976 | <0.1% | - | |
| Help Residents Party | — | — | — | — | 2,399 | <0.1% | - | |
| Natural Law Party | — | — | — | — | 2,153 | <0.1% | - | |
| Jobs Equality Business Party | — | — | — | — | 1,993 | <0.1% | - | |
| Immigration Moratorium Now Party | — | — | — | — | 1,746 | <0.1% | - | |
| Centrist Party | — | — | — | — | 1,353 | <0.1% | - | |
| Pro Life Conservative Party | — | — | — | — | 1,282 | <0.1% | - | |
| Fair Party | — | — | — | — | 1,248 | <0.1% | - | |
| Socialist Party | — | — | — | — | 1,169 | <0.1% | - | |
| Politicians are Crooks Party | — | — | — | — | 1,066 | <0.1% | - | |
| E Pluribus Unum Party | — | — | — | — | 931 | <0.1% | - | |
| Randolph for Congress Party | — | — | — | — | 857 | <0.1% | - | |
| Others | — | — | — | — | 1,688,866 | 1.5% | -0.5% | |
| Total | 434 | 435 | 0 | 100.0% | 113,192,286 | 100.0% | – | |
| Source: Election Statistics - Office of the Clerk | ||||||||
United States Senate
The 34 seats in the United States Senate Class 3 were up for election. Republicans had a net gain of 4 seats. Summary of the United States Senate elections, 2004 results []
| Parties | Total | |||||||||||||||||||||||||||||||||||||||||||||||||||||||||||||||||||||||||||||||||||||||||||||||||
|---|---|---|---|---|---|---|---|---|---|---|---|---|---|---|---|---|---|---|---|---|---|---|---|---|---|---|---|---|---|---|---|---|---|---|---|---|---|---|---|---|---|---|---|---|---|---|---|---|---|---|---|---|---|---|---|---|---|---|---|---|---|---|---|---|---|---|---|---|---|---|---|---|---|---|---|---|---|---|---|---|---|---|---|---|---|---|---|---|---|---|---|---|---|---|---|---|---|---|
| Democratic | Republican | Independent | Libertarian | Others | ||||||||||||||||||||||||||||||||||||||||||||||||||||||||||||||||||||||||||||||||||||||||||||||
| Before these elections | 48 | 51 | 1 | — | — | 100 | ||||||||||||||||||||||||||||||||||||||||||||||||||||||||||||||||||||||||||||||||||||||||||||
| End of this Congress (two months later) | 48 | 51 | 1 | — | — | 100 | ||||||||||||||||||||||||||||||||||||||||||||||||||||||||||||||||||||||||||||||||||||||||||||
| Not Up | 29 | 36 | 1 | — | — | 66 | ||||||||||||||||||||||||||||||||||||||||||||||||||||||||||||||||||||||||||||||||||||||||||||
| Up | 19 | 15 | — | — | — | 34 | ||||||||||||||||||||||||||||||||||||||||||||||||||||||||||||||||||||||||||||||||||||||||||||
| Incumbent retired |
Held by same party | — | 1 | — | — | — | 1 | |||||||||||||||||||||||||||||||||||||||||||||||||||||||||||||||||||||||||||||||||||||||||||
| Replaced by other party | replaced by |
replaced by |
— | — | — | | ||||||||||||||||||||||||||||||||||||||||||||||||||||||||||||||||||||||||||||||||||||||||||||
| Incumbent ran |
Won re-election | 13 | 12 | — | — | — | 25 | |||||||||||||||||||||||||||||||||||||||||||||||||||||||||||||||||||||||||||||||||||||||||||
| Lost re-election | replaced by |
— | — | — | | |||||||||||||||||||||||||||||||||||||||||||||||||||||||||||||||||||||||||||||||||||||||||||||
| Lost renomination, held by same party | — | — | — | — | — | 0 | ||||||||||||||||||||||||||||||||||||||||||||||||||||||||||||||||||||||||||||||||||||||||||||
| Lost renomination, and party lost | — | — | — | — | — | 0 | ||||||||||||||||||||||||||||||||||||||||||||||||||||||||||||||||||||||||||||||||||||||||||||
| Total held | 13 | 13 | — | — | — | 26 | ||||||||||||||||||||||||||||||||||||||||||||||||||||||||||||||||||||||||||||||||||||||||||||
| Total not held / gained | |
|
— | — | — | | ||||||||||||||||||||||||||||||||||||||||||||||||||||||||||||||||||||||||||||||||||||||||||||
| Total elected | 15 | 19 | — | — | — | 34 | ||||||||||||||||||||||||||||||||||||||||||||||||||||||||||||||||||||||||||||||||||||||||||||
| Result | 44 | 55 | 1 | — | — | 100 | ||||||||||||||||||||||||||||||||||||||||||||||||||||||||||||||||||||||||||||||||||||||||||||
| Popular vote |
Votes | 44,754,618 | 39,920,562 | 186,231 | 754,861 | 2,481,075 | 88,097,347 | |||||||||||||||||||||||||||||||||||||||||||||||||||||||||||||||||||||||||||||||||||||||||||
| Share | 50.8% | 45.3% | 0.21% | 0.86% | 2.82% | 100% | ||||||||||||||||||||||||||||||||||||||||||||||||||||||||||||||||||||||||||||||||||||||||||||
Sources:
State
Governors
Eleven of the fifty United States governors were up for re-election, as were the governorships of two U.S. territories. The final results were a net change of zero between the political parties. The Democrats picked up the governorships in Montana and New Hampshire, but the Republicans picked up the ones in Indiana and Missouri.
Other state-wide Officer elections
In many states where if the following positions were elective offices, voters cast votes for candidates for state executive branch offices of Lieutenant Governor (though some were voted for on the same ticket as the gubernatorial nominee), Secretary of state, state Treasurer, state Auditor, state Attorney General, state Superintendent of Education, Commissioners of Insurance, Agriculture or, Labor, etc.) and state judicial branch offices (seats on state Supreme Courts and, in some states, state appellate courts).
State Legislative elections
Many states across the nation held elections for their state legislatures.
Initiatives and Referenda

- State constitutional amendments prohibiting same-sex marriage are passed in eleven states: Arkansas, Georgia, Kentucky, Michigan, Mississippi, Montana, North Dakota, Ohio, Oklahoma, Oregon, and Utah. The measures in Oregon, Mississippi, and Montana bans same-sex marriage only, while Arkansas, Georgia, Kentucky, North Dakota, Oklahoma, Ohio, and Utah bans both same-sex marriage and civil unions and Michigan bans granting any benefits whatsoever to same-sex couples.[1]
Local elections
Mayoral elections
Some of the major American cities that held their mayoral elections in 2004 included:
- Chesapeake – Dalton S. Edge won an open seat race to succeed outgoing Mayor William E. Ward.[2]
- Jersey City- In a special election triggered due to the passing of Glenn Cunningham (D), attorney Jerramiah Healy (D) defeated General Assemblyman Louis Manzo (D) and Acting Mayor L. Harvey Smith (D) to serve the rest of the unexpired term.
- San Diego – Incumbent Mayor Dick Murphy (R) was re-elected, but resigned five months later.[3]
References
- ↑ (365Gay)
- ↑ >Armstrong, Kevin (2008-01-10). "Chesapeake mayor Dalton Edge won't run for second term". The Virginian-Pilot.
- ↑ Dillon, Jeff (2005-04-25). "San Diego mayor announces departure less than 5 months into second term". San Diego Union-Tribune.
Further reading
- Ceaser, James W. and Andrew E. Busch. Red Over Blue: The 2004 Elections and American Politics (2005), narrative history.
- Greene, John C. and Mark J. Rozell, eds. The Values Campaign?: The Christian Right and the 2004 Elections (2006).
- Sabato, Larry J. Divided States of America: The Slash And Burn Politics of the 2004 Presidential Election (2005).
- Stempel III, Guido H. and Thomas K. Hargrove, eds. The 21st-Century Voter: Who Votes, How They Vote, and Why They Vote (2 vol. 2015).
External links
- United States Election 2004 Web Archive from the U.S. Library of Congress
| |
|