United States Presidents and control of Congress
The degree to which the President of the United States's political party has control over the House of Representatives and Senate often determines his or her political strength - such as the ability to pass sponsored legislation, ratify treaties, and have Cabinet members and judges approved.
Presidential impact
Many presidents' elections produced what is known as a coattail effect, in which the success of a presidential candidate also leads to electoral success for other members of his or her party. In fact, all newly elected presidents except Zachary Taylor, Richard Nixon and George H. W. Bush were accompanied by control of at least one house of Congress.
Presidents by congressional control and terms won/served
| No. | President | President's Party | Senate with | Senate opposed | House with | House opposed | Congress with | Congress opposed | Congress divided | Years served | Elections won |
|---|---|---|---|---|---|---|---|---|---|---|---|
| 1 | George Washington | None | 8 | 0 | 6 | 2 | 6 | 0 | 2 | 8 | 2 |
| 2 | John Adams | Federalist | 4 | 0 | 4 | 0 | 4 | 0 | 0 | 4 | 1 |
| 3 | Thomas Jefferson | Democratic-Republican | 8 | 0 | 8 | 0 | 8 | 0 | 0 | 8 | 2 |
| 4 | James Madison | Democratic-Republican | 8 | 0 | 8 | 0 | 8 | 0 | 0 | 8 | 2 |
| 5 | James Monroe | Democratic-Republican | 8 | 0 | 8 | 0 | 8 | 0 | 0 | 8 | 2 |
| 6 | John Quincy Adams | Adams | 2 | 2 | 2 | 2 | 2 | 2 | 0 | 4 | 1 |
| 7 | Andrew Jackson | Democratic | 8 | 0 | 8 | 0 | 8 | 0 | 0 | 8 | 2 |
| 8 | Martin Van Buren | Democratic | 4 | 0 | 4 | 0 | 4 | 0 | 0 | 4 | 1 |
| 9 | William Harrison | Whig | 0.1 | 0 | 0.1 | 0 | 0.1 | 0 | 0 | 0.1 | 1 |
| 10 | John Tyler | Whig/Independent | 4 | 0 | 2 | 2 | 2 | 0 | 2 | 4 | 0 |
| 11 | James Polk | Democratic | 4 | 0 | 2 | 2 | 2 | 0 | 2 | 4 | 1 |
| 12 | Zachary Taylor | Whig | 0 | 1 | 0 | 1 | 0 | 1 | 0 | 1 | 1 |
| 13 | Millard Fillmore | Whig | 0 | 3 | 0 | 3 | 0 | 3 | 0 | 3 | 0 |
| 14 | Franklin Pierce | Democratic | 4 | 0 | 2 | 2 | 2 | 0 | 2 | 4 | 1 |
| 15 | James Buchanan | Democratic | 4 | 0 | 2 | 2 | 2 | 0 | 2 | 4 | 1 |
| 16 | Abraham Lincoln | Republican | 4 | 0 | 4 | 0 | 4 | 0 | 0 | 4 | 2 |
| 17 | Andrew Johnson | National Union | 0 | 4 | 0 | 4 | 0 | 4 | 0 | 4 | 0 |
| 18 | Ulysses Grant | Republican | 8 | 0 | 6 | 2 | 6 | 0 | 2 | 8 | 2 |
| 19 | Rutherford Hayes | Republican | 2 | 2 | 0 | 4 | 0 | 2 | 2 | 4 | 1 |
| 20 | James Garfield | Republican | 0 | 0.5 | 0.5 | 0 | 0 | 0 | 0.5 | 0.5 | 1 |
| 21 | Chester Arthur | Republican | 4 | 0 | 2 | 2 | 2 | 0 | 2 | 4 | 0 |
| 22 | Grover Cleveland | Democratic | 0 | 4 | 4 | 0 | 0 | 0 | 4 | 4 | 1 |
| 23 | Benjamin Harrison | Republican | 4 | 0 | 2 | 2 | 2 | 0 | 2 | 4 | 1 |
| 24 | Grover Cleveland | Democratic | 2 | 2 | 2 | 2 | 2 | 2 | 0 | 4 | 1 |
| 25 | William McKinley | Republican | 4.5 | 0 | 4.5 | 0 | 4.5 | 0 | 0 | 4.5 | 2 |
| 26 | Theodore Roosevelt | Republican | 7.5 | 0 | 7.5 | 0 | 7.5 | 0 | 0 | 7.5 | 1 |
| 27 | William Taft | Republican | 4 | 0 | 2 | 2 | 2 | 0 | 2 | 4 | 1 |
| 28 | Woodrow Wilson | Democratic | 6 | 2 | 6 | 2 | 6 | 2 | 0 | 8 | 2 |
| 29 | Warren Harding | Republican | 2 | 0 | 2 | 0 | 2 | 0 | 0 | 2 | 1 |
| 30 | Calvin Coolidge | Republican | 6 | 0 | 6 | 0 | 6 | 0 | 0 | 6 | 1 |
| 31 | Herbert Hoover | Republican | 4 | 0 | 2 | 2 | 2 | 0 | 2 | 4 | 1 |
| 32 | Franklin Roosevelt | Democratic | 12 | 0 | 12 | 0 | 12 | 0 | 0 | 12 | 4 |
| 33 | Harry Truman | Democratic | 6 | 2 | 6 | 2 | 6 | 2 | 0 | 8 | 1 |
| 34 | Dwight Eisenhower | Republican | 2 | 6 | 2 | 6 | 2 | 6 | 0 | 8 | 2 |
| 35 | John Kennedy | Democratic | 3 | 0 | 3 | 0 | 3 | 0 | 0 | 3 | 1 |
| 36 | Lyndon Johnson | Democratic | 5 | 0 | 5 | 0 | 5 | 0 | 0 | 5 | 1 |
| 37 | Richard Nixon | Republican | 0 | 6 | 0 | 6 | 0 | 6 | 0 | 6 | 2 |
| 38 | Gerald Ford | Republican | 0 | 2 | 0 | 2 | 0 | 2 | 0 | 2 | 0 |
| 39 | Jimmy Carter | Democratic | 4 | 0 | 4 | 0 | 4 | 0 | 0 | 4 | 1 |
| 40 | Ronald Reagan | Republican | 6 | 2 | 0 | 8 | 0 | 2 | 6 | 8 | 2 |
| 41 | George H. W. Bush | Republican | 0 | 4 | 0 | 4 | 0 | 4 | 0 | 4 | 1 |
| 42 | Bill Clinton | Democratic | 2 | 6 | 2 | 6 | 2 | 6 | 0 | 8 | 2 |
| 43 | George W. Bush | Republican | 4.5 | 3.5 | 6 | 2 | 4.5 | 2 | 1.5 | 8 | 2 |
| 44 | Barack Obama | Democratic | 6 | 2 | 2 | 6 | 2 | 2 | 4 | 8 | 2 |
| No. | President | President's Party | Senate with | Senate opposed | House with | House opposed | Congress with | Congress opposed | Congress divided | Years served | Elections won |
See also
- Divided government in the United States
- Party divisions of United States Congresses
- Political power in the United States over time
- Political party strength in U.S. states
References
- ↑ "Party In Power - Congress and Presidency - A Visual Guide To The Balance of Power In Congress, 1945-2008". Uspolitics.about.com. Retrieved September 17, 2012.
- ↑ "Chart of Presidents of the United States". Filibustercartoons.com. Retrieved September 17, 2012.
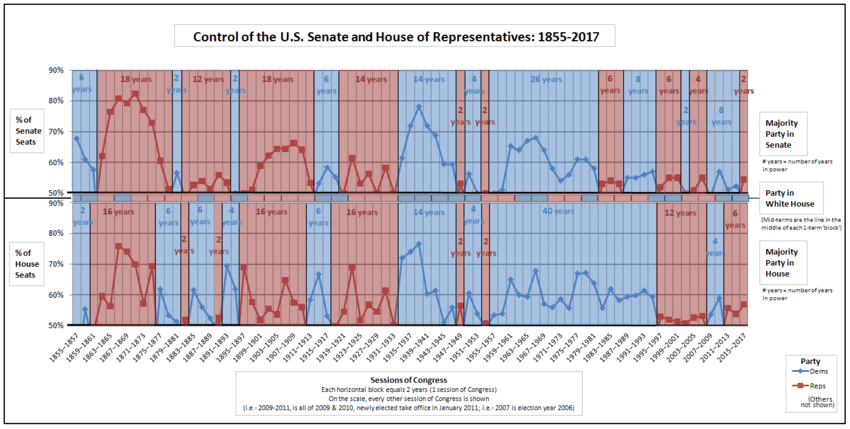
- ↑ "Composition of Congress by Party 1855–2013". Infoplease.com. Retrieved September 17, 2012.
| Presidents | |
|---|---|
| Professional careers | |
| Personal life | |
| Vice Presidents | |
| Succession | |
| Elections | |
| Candidates | |
| Families | |
| Namesakes, honors | |
| In fiction | |
US Government Portal • Biography Portal • | |
This article is issued from Wikipedia - version of the 11/23/2016. The text is available under the Creative Commons Attribution/Share Alike but additional terms may apply for the media files.