United States House of Representatives elections, 2006
| | ||||||||||||||||||||||||||||||||||||||||||||
| ||||||||||||||||||||||||||||||||||||||||||||
| ||||||||||||||||||||||||||||||||||||||||||||
|
| ||||||||||||||||||||||||||||||||||||||||||||
| Republican hold Democratic hold Democratic pickup | ||||||||||||||||||||||||||||||||||||||||||||
| ||||||||||||||||||||||||||||||||||||||||||||


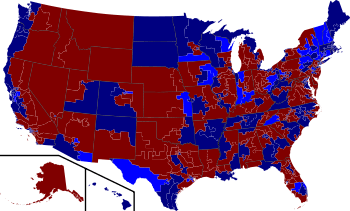
The 2006 United States House of Representatives elections were held on November 7, 2006 to elect members to the United States House of Representatives. It took place in the middle of President George W. Bush's second term in office. All 435 seats of the House were up for election. Those elected served in the 110th United States Congress from January 3, 2007 until January 3, 2009. The incumbent majority party, the Republicans, had won majorities in the House consecutively since 1994, and were defeated by the Democrats who won a majority in the chamber, ending 12 years in opposition.
The Republicans had won a 232-seat majority in 2004, and by election day 2006 the party held 229 seats, the Democrats had 201 and there was 1 Independent (who caucused with the Democrats). There were also four vacancies. Republicans held a 28 seat advantage, and Democrats needed to pick up 15 seats to take control of the House, which had had a Republican majority since January 1995. The public's perception of George W. Bush, the handling of the war in Iraq, and a series of political scandals involving mostly congressional Republicans took their toll on the party at the ballot box.[1]
The final result was a 31 seat pickup for the Democrats, including the pickup of the Vermont At-Large seat, previously held by Independent Bernie Sanders who caucused with the Democrats. Democrats defeated 22 Republican incumbents and won eight open Republican-held seats. Republicans won no seats previously held by Democrats and defeated no Democratic incumbents for the first time since the Republican party's founding.[2] It was the largest seat gain for the Democrats since the 1974 elections. Among the new Democrats were the first Muslim in Congress (Keith Ellison) and the first two Buddhists (Mazie Hirono and Hank Johnson). As a result of the Democratic victory, Nancy Pelosi became the first woman, first Italian-American, and the first Californian elected Speaker of the House.[3]

Results
A number of organizations and individuals made predictions about the election, some for the House as a whole and some for both that and individual races. For the predictions just before the election occurred, see United States House elections, 2006 - predictions.
| 233 | 202 |
| Democratic | Republican |

| Party | Seats | Popular vote | |||||||
|---|---|---|---|---|---|---|---|---|---|
| 2004 | 2006 | +/− | % | Vote | % | +/− | |||
| Democratic Party | 202 | 233 | +31 | 53.6% | 42,338,795 | 52.3% | +5.5% | ||
| Republican Party | 232 | 202 | −30 | 46.4% | 35,857,334 | 44.3% | −5.1% | ||
| Libertarian Party | − | − | − | − | 656,764 | 0.8% | −0.1% | ||
| Independent | 1 | 0 | −1 | - | 417,895 | 0.5% | −0.1% | ||
| Green Party | − | − | − | − | 243,391 | 0.3% | - | ||
| Constitution Party | − | − | − | − | 91,133 | 0.1% | -0.1% | ||
| Independence Party | − | − | − | − | 85,815 | 0.1% | - | ||
| Reform Party | − | − | − | − | 53,862 | 0.1% | - | ||
| Peace and Freedom Party | − | − | − | − | 27,467 | <0.1% | - | ||
| Socialist Workers Party | − | − | − | − | 17,089 | <0.1% | - | ||
| Unity Party | − | − | − | − | 5,508 | <0.1% | - | ||
| Conservative Party | − | − | − | − | 4,468 | <0.1% | - | ||
| Withdraw Troops Now Party | − | − | − | − | 3,176 | <0.1% | - | ||
| Impeach Now Party | − | − | − | − | 3,005 | <0.1% | - | ||
| Natural Law Party | − | − | − | − | 2,882 | <0.1% | - | ||
| Pirate Party | − | − | − | − | 2,201 | <0.1% | - | ||
| Diversity Is Strength Party | − | − | − | − | 1,619 | <0.1% | - | ||
| Moderate Choice Party | − | − | − | − | 1,363 | <0.1% | - | ||
| Patriot Movement Party | − | − | − | − | 1,179 | <0.1% | - | ||
| Politicians Are Crooks Party | − | − | − | − | 998 | <0.1% | - | ||
| American Freedom Party | − | − | − | − | 996 | <0.1% | - | ||
| A New Direction Party | − | − | − | − | 992 | <0.1% | - | ||
| Liberty Union Party | − | − | − | − | 721 | <0.1% | - | ||
| Remove Medical Negligence Party | − | − | − | − | 614 | <0.1% | - | ||
| Pro Life Conservative Party | − | − | − | − | 586 | <0.1% | - | ||
| American Party | − | − | − | − | 475 | <0.1% | - | ||
| Socialist Party | − | − | − | − | 385 | <0.1% | - | ||
| Other parties | − | − | − | − | 1,154,824 | 1.4% | −0.1% | ||
| Totals | 435 | 435 | − | 100.0% | 80,975,537 | 100.0% | − | ||
| Voter turnout: 36.8% | |||||||||
| Sources: Ballot Access News, 2006 Vote for U.S. House | |||||||||
Open seats

In the election, there were 32 open seats: 28 incumbents not seeking re-election and four vacancies. Of the 28 incumbents, 18 were Republicans, 9 Democrats, and 1 an independent.
The four vacancies were New Jersey's 13th congressional district, to be filled at the same time as the general election with the winner taking office in November immediately after the votes were certified; Texas's 22nd congressional district, with a separate special election on the same day; and Ohio's 18th congressional district and Florida's 16th congressional district, which did not have special elections to fill the vacancies before January 2007. New Jersey's 13th congressional district had been held by Democrat Bob Menendez, Texas's 22nd congressional district had been held by Republican Tom DeLay, Ohio's 18th congressional district had been held by Republican Robert Ney, and Florida's 16th congressional district had been held by Republican Mark Foley.
In addition to the open seats, two incumbents, (Democrat Cynthia McKinney in Georgia's 4th congressional district and Republican Joe Schwarz in Michigan's 7th congressional district), were defeated in their party's respective primaries, adding two seats to the number of races where the incumbent was not up for re-election in November.
Seats that changed party
Thirty Republican seats were picked up by Democrats, and one seat held by an independent was picked up by a Democrat. No Democratic seats were picked up by Republicans.
- Alabama
- Alaska
- Arizona
- Arkansas
- California
- Colorado
- Connecticut
- Delaware
- Florida
- Georgia
- Hawaii
- Idaho
- Illinois
- Indiana
- Iowa
- Kansas
- Kentucky
- Louisiana
- Maine
- Maryland
- Massachusetts
- Michigan
- Minnesota
- Mississippi
- Missouri
- Montana
- Nebraska
- Nevada
- New Hampshire
- New Jersey
- New Mexico
- New York
- North Carolina
- North Dakota
- Ohio
- Oklahoma
- Oregon
- Pennsylvania
- Rhode Island
- South Carolina
- South Dakota
- Tennessee
- Texas
- Utah
- Vermont
- Virginia
- Washington
- West Virginia
- Wisconsin
- Wyoming
Arizona
- Arizona's 5th congressional district — Early in the cycle, incumbent J.D. Hayworth (R) appeared on his way to an easy reelection. However, his seat may have become more competitive after the Congressional Page scandal broke. Democrats fielded a locally well-known candidate in State Senator Harry Mitchell, a former Mayor of Tempe. Mitchell has been a political force in his home town, one of the largest communities in the district, and Democrats became enthusiastic about his candidacy. The 5th leans Republican, but not overwhelmingly. The district includes, in addition to Tempe, Scottsdale, the prime real estate of the Phoenix area. On election night, Mitchell defeated Hayworth, 50% to 46%.

- Arizona's 8th congressional district — Incumbent Jim Kolbe (R) announced on November 23, 2005 that he would not seek re-election in 2006. His district, located in Southeastern Arizona and based in the suburbs of Tucson, is Republican-leaning, but competitive: President Bush won the district with 53% of the vote in 2004 (although only 50% in 2000). The Democratic primary in September was won by former State Senator Gabrielle Giffords, who resigned from the Arizona Legislature on December 1, 2005 in preparation for the campaign. Randy Graf, a former state Representative who lost to Kolbe in the 2004 primary, won the September 2006 Republican primary. He defeated current state Representative Steve Huffman, whom both Kolbe and the National Republican Congressional Committee supported. The NRCC reportedly became concerned that Graf (a supporter of the Minuteman Project, and a sponsor of an unsuccessful bill that would let patrons carry guns into bars and restaurants), was too conservative to win the district. The NRCC committed $122,000 for a television ad in support of Huffman, which ran the week before the primary. The Democratic party shared that assessment — prior to the primary, it spent nearly $200,000, "a large part of that for advertisements critical of Mr. Huffman in an effort to help Mr. Graf's candidacy."[4] In late September, the national GOP canceled about $1 million in advertising support.[5] Libertarian David Nolan and independent Jay Quick also ran for the seat. Giffords went on to win by a 54% to 42% margin. (For details, see Arizona 8th congressional district election, 2006.)
California
- California's 11th congressional district — Longtime incumbent Richard Pombo (R) won reelection in 2004 by a reasonably comfortable 61% to 39% margin. However, Pombo became associated with the ethical and legal scandals revolving around Jack Abramoff and became the subject of an investigation, which eroded his popular support. In addition, Rolling Stone listed him as one of the ten worst congressmen. The Democratic candidate who garnered the 39% in 2004, Jerry McNerney, joined that race as a write-in candidate two weeks before the primary election. In 2006, McNerney was challenged in the primary by Steve Filson. Filson was backed by the Democratic Congressional Campaign Committee but was upset by McNerney in the primary. Pombo was challenged for the Republican nomination by former Representative Pete McCloskey. Pombo won 63% of the primary vote to 32% for McCloskey.[6] McCloskey eventually endorsed McNerney.[7] The eleventh district is largely composed of Oakland suburbs and leans Republican. McNerney defeated Pombo 53% to 47% on election night.
Colorado
- Colorado's 7th congressional district — Incumbent Bob Beauprez (R) was reelected to a second term in 2004 with 55% of the vote, after winning his first term by only 121 votes. His retirement to make an unsuccessful run for Governor of Colorado made this seat highly competitive. The 7th District is located in the northern and eastern Denver suburbs. State education chairman Rick O'Donnell was unopposed for the Republican nomination, while State Senator Ed Perlmutter won a three-way Democratic primary. On election night, Perlmutter won Beauprez's old seat as expected, 55% to 42%. (For details, see Colorado 7th congressional district election, 2006.)
Connecticut
- Connecticut's 2nd congressional district — Incumbent Rob Simmons (R), a Vietnam War veteran and former CIA agent, won reelection by 54% to 46% in 2004, in a Democratic-leaning district encompassing eastern Connecticut, including Norwich and New London. The 2002 nominee, former state Representative Joe Courtney, decided to make another run. Even though in the past Simmons had been able to win elections in the Democratic-leaning district by painting himself as a moderate, the seat is perennially competitive. The results were so close on election night that the race was not settled until a week later. A recount was completed on November 14, 2006, with the final results giving Joe Courtney an 83-vote victory over Rob Simmons.[8] It was the closest house race of 2006.
- Connecticut's 5th congressional district — Although incumbent Nancy Johnson (R) won with at least 60% of the vote in 2004 and faced a difficult challenge (running against a fellow incumbent in a redrawn district) in 2002, winning with just 54%, she was still a Republican in a swing district. While the 5th is Connecticut's most conservative region, John Kerry won the district by about 1100 votes in 2004 and Al Gore won it when Johnson represented it as the 6th District in 2000. The district is located in Northwestern Connecticut and includes a large portion of Waterbury, Danbury, the wealthy western suburbs of Hartford, and small rural towns. Johnson faced a credible challenge from state Senator Chris Murphy. She was popular in the district, but with Bush's rating in New England at rock bottom, a Democratic victory was possible. Early in the cycle, this race was considered the least competitive of the three Republican-held seats in Connecticut, but Murphy defeated Johnson on election night, winning 56% to 44%.
Florida
- Florida's 16th congressional district — This Republican-leaning South Florida district, which includes West Palm Beach, Port St. Lucie on the state's east coast and Port Charlotte on the west coast, was represented by Mark Foley, head of the Missing and Exploited Children's Caucus. However, Foley resigned September 29, 2006 due to revelations of inappropriate contacts of a sexual nature with underage male congressional pages. The scandal immediately ballooned to include the Republican leadership's involvement in a possible cover-up, and it soon brought down Republicans nationwide. Florida law bars state parties from replacing candidates on the ballot. Within the district, the scandal created strong backlash against any Republican replacement due to Foley's name remaining on the ballot, and, by extension, made the race, which had earlier been written off by most as a "safe" Republican seat, highly competitive. Businessman Tim Mahoney, a surprisingly well-funded challenger in a seemingly uncompetitive race, quickly became favored to win. The Republican replacement, businessman Joe Negron, ran an effective "Punch Foley for Negron" campaign, but lost in a closer than expected race, with 48% to Mahoney's 49%.[9]
- Florida's 22nd congressional district — Republican E. Clay Shaw had been in Congress since 1981, and had represented the 22nd District since 1993. The district voted for John Kerry over George Bush in 2004, but re-elected Shaw with 63% against a last minute replacement Democrat. In 2000, Shaw won a close race by 599 votes in a district that Al Gore won by 4%, but in 2002, he was redistricted into a slightly less Democratic district and scored an easy victory. The district includes wealthy areas of Palm Beach County and Broward County including Boca Raton and parts of Fort Lauderdale The revelation that Shaw was being treated for a second time for lung cancer may have affected his re-election chances. This year, Shaw faced a challenge from well-funded state senator Ron Klein. Klein won on election day 51% to 47%.
Indiana
- Indiana's 2nd congressional district — Chris Chocola (R) was first elected in 2002 by a 50% to 46% margin. Democrat Joe Donnelly, who lost to Chocola 54% to 45% in 2004, ran again in 2006. Democrats blamed Donnelly's 2004 loss on a lack of funding from the national party that allowed Chocola to outspend Donnelly by a two-to-one margin. President Bush visited the South Bend-centered district seven times between 2000 and 2006, suggesting that Chocola was vulnerable. Chocola's popularity was also affected by the unpopularity of GOP Governor Mitch Daniels; among other things, Daniels decided to lease a toll road that runs through the district to a foreign corporation. Daniels also pushed to move the entire state to daylight saving time, which was opposed by local residents. In the campaign, Chocola attacked Donnelly for being delinquent in paying property taxes. On election night, Donnelly defeated Chocola 54% to 46%.
- Indiana's 8th congressional district — John Hostettler (R), who had only a 34% approval rating, was challenged by Vanderburgh County Sheriff Brad Ellsworth in this swing district that includes Evansville and Terre Haute. Hostettler had a history of winning tough reelections, but Ellsworth was considered to be his strongest opponent. The district has been nicknamed "The Bloody Eighth" due to its frequent ousting of incumbent congressmen, which has occurred in 1958, 1966, 1974, 1978, 1982, 1994, and 2006. Despite the competitive nature of the district, Hostettler was traditionally slow to raise money and lagged far behind his opponent in fundraising totals throughout the election. Rumors circulated in September that Hostettler had essentially given up on his campaign when he failed to hold any events on Labor Day weekend, the traditional kickoff of the campaign season. In the end, Ellsworth defeated Hostettler by a 61%-39% margin, the most lopsided loss for a House incumbent since 1994.
- Indiana's 9th congressional district — In 2004, incumbent Mike Sodrel (R) defeated then-incumbent Baron Hill by only 1,425 votes, the smallest winning percentage in any congressional race that year.[10] Hill ran in 2006 to reclaim his seat in this Southeast Indiana district that includes Bloomington and New Albany. He defeated anti-war challenger Gretchen Clearwater in the May 2 primary. Factors cited in the race included Sodrel being a self-described staunch Republican Party loyalist in an evenly divided district, Hill lacking the advantages of incumbency in 2006, and (according to Democrats) Hill's superior constituent service compared to Sodrel's. Hill defeated Sodrel 50% to 46%.
Iowa
- Iowa's 1st congressional district — Incumbent Jim Nussle (R) left his seat in congress to run for governor. This district is Democratic-leaning, and of the open seats was one of the most likely to change hands. It contains most of northeastern Iowa including large cities such as Dubuque, the Quad Cities and Waterloo. Nussle had been reelected in 2000 and 2004 with 55% of the vote but Al Gore and John Kerry won the district in those same years. In 2006, businessman Mike Whalen won the Republican nomination while attorney Bruce Braley was the Democratic nominee. Braley defeated Whalen 55 percent to 43 percent. (For details, see Iowa 1st congressional district election, 2006.)
- Iowa's 2nd congressional district — Incumbent Jim Leach (R) received 59% of the vote in 2004. Before the election, this was the most Democratic seat held by a Republican, as measured by presidential candidates' performances in the district. However, Leach had consistently won here since 1976, helped by his reputation for strong integrity. Also helping him was his status as one of the most liberal Republicans in the House. As a result, Leach traditionally won large numbers of crossover votes from Democrats and was expected to do so again. The Democrats nominated David Loebsack, a political science professor at small Cornell College in Mount Vernon, Iowa. Despite Leach's appeal and seniority, Loebsack prevailed on election night by a 51% to 49% margin. Leach's defeat made him the most senior House member to lose re-election in 2006 and the most senior member to lose re-election since 36-year incumbent Phil Crane lost in 2004 in an upset to Melissa Bean.
Kansas
- Kansas's 2nd congressional district — Incumbent Jim Ryun (R), a leading conservative, won re-election by 56% to 41% in 2004 and had held his seat for five terms. This year, Ryun faced a rematch with Democrat Nancy Boyda, who also ran against him in 2004. The district is home to Topeka, Manhattan (location of Kansas State University), Leavenworth, Pittsburg, and half of the liberal college town of Lawrence, home of the University of Kansas. Despite being held by Ryun, the seat had a history of electing Democrats and before 1994, Democrats held the seat for 20 out of 24 years. However, gerrymandering had made the seat tilt more Republican, and Ryun was thought to be secure. However, Ryun faced controversy over a Washington, D.C. real estate purchase, and in the wake of scandals that rocked Washington, D.C., this had a major effect on local voters, far more than had been expected. Boyda was also helped by the reelection of popular Democratic Governor Kathleen Sebelius. Boyda defeated the incumbent Ryun 51% to 47%, in one of the most shocking results of the night.
Kentucky
- Kentucky's 3rd congressional district — Incumbent Anne Northup (R) had been a target for the Democrats since her election in 1996; in 2004 and 2000, John Kerry and Al Gore both won her Louisville-centered congressional district by two percent, and Bill Clinton won the district by double-digit margins during the 1990s. While Northup had generally run close races, she won 60% of the vote in the 2004 election. Redistricting after the 2000 census added a few more suburban Republicans to the district, according to Congressional Quarterly. The Democratic candidate was John Yarmuth, the founder of local free publication LEO. In spite of Northup's electoral success, excellent constituent services, and popularity among blue-collar voters in southern Louisville, Democrats saw this race as winnable, calling attention to Northup's 91% lockstep voting record with an unpopular President Bush. Northup led in most polls until October, when Yarmuth began to gain. By election night, the race had become highly competitive. House Majority Leader John Boehner referred to Northup as the Republicans' "canary in the coal mine", meaning that her fortunes would portend the outcome of House elections nationwide. This proved to be a correct assessment, as on election night, Yarmuth defeated Northup 51% to 48% and Republicans lost control of the House.
Minnesota
- Minnesota's 1st congressional district — Incumbent Gil Gutknecht (R) was reelected in his Southern Minnesota district with 60% of the vote in 2004. A member of the 1994 Republican Revolution, Gutknecht had promised not to run for a seventh term when first elected. Though not expected to be significant, the broken promise proved to be a factor in his defeat. Geography teacher Tim Walz was the Democratic nominee and ran a much stronger campaign than expected, helped by the massive decline in President George W. Bush's popularity in Minnesota. Walz defeated Gutknecht 53%-47%.[11]
New Hampshire
- New Hampshire's 1st congressional district — Republican incumbent Jeb Bradley was seeking a third term. Rochester Democratic chair Carol Shea-Porter won the nomination in a major upset against better funded and party-favored state House Democratic Leader Jim Craig. Although this was the one house district in New England Bush carried in 2004, and Bradley had won it handily in the past, the President was highly unpopular throughout New England, which gave Democrats an opening. Still, most thought that Bradley was the strong favorite to win. Shea-Porter defeated Bradley 52% to 48% in the most shocking upset of the night, along with the victories of David Loebsack and Nancy Boyda.
- New Hampshire's 2nd congressional district — Incumbent Charles Bass (R) won reelection in 2004 with 58% percent of the vote, even as his district was won by John Kerry 52% to 47%. Bass, a political moderate, easily defeated primary challenges from Berlin Mayor Bob Danderson and Mary Maxwell. The Democratic nominee, Paul Hodes, an attorney, was also the 2004 Democratic nominee. In late September, a top Bass staffer resigned after news stories that a U.S. Government computer in Bass's DC office had been used to post anonymous concern troll messages to NH blogs. In these messages, "IndyNH" claimed to be a supporter of Paul Hodes who was discouraged by Bass's unbeatable lead. Hodes defeated Bass on election day, 53% to 46%.
New York
- New York's 19th congressional district — Incumbent Sue Kelly (R) had rarely faced stiff competition since her initial election in 1994, but the Democratic primary attracted six contenders in 2006, two of whom dropped out before the primary. Former Ulster County Legislator John Hall, who was once a member of the popular rock band, Orleans, won the Democratic nomination with 49% of the vote in a multi-candidate primary. An October 26 Majority-Watch poll had him leading 49% to 47% . Several factors played into Kelly's defeat, including the extremely weak GOP showing in the senatorial and gubernatorial races, her reluctance to answer questions about the Mark Foley Page Scandal (notoriously, she literally ran away from television cameras at one point), and Hall's quirky campaign style, which included an appearance on the satirical Comedy Central program The Colbert Report. Hall defeated Kelly 51% to 49%. Following Hall's election, Stephen Colbert took credit for the victory and attributed it entirely to Hall's appearance on the show. Hall appeared several days later to satirically thank the host for his seat in Congress.
- New York's 20th congressional district — Incumbent John E. Sweeney (R) had never faced a particularly competitive election until 2006. His competitive district fueled a strong challenge from attorney Kirsten Gillibrand. In April 2006, Sweeney was allegedly sighted intoxicated at a fraternity party.[12] On October 31, a week before the election, a police report surfaced that documented a 911 call from his wife asking for help because her husband was "knocking her around the room". Despite denials from both Sweeney and his wife, the report proved to be a turning point and Gillibrand was victorious on election night, 53% to 47%. (For details, see New York 20th congressional district election, 2006.)
- New York's 24th congressional district — Incumbent Sherwood Boehlert (R) announced his retirement after 24 years, making this a seat of considerable focus for the Democrats in the run up to the mid terms. Boehlert is considered a moderate Republican, and the district is considered to be competitive. George Bush won by 53% in the 2004 election, but by only 3,000 votes in the 2000 presidential election. The Republican nominee was state Senator Ray Meier, while the Democratic nominee was Oneida County District Attorney Mike Arcuri. Both were locally popular and proven vote-getters and the race was a toss-up. Arcuri defeated Meier 54% to 45%.
North Carolina
- North Carolina's 11th congressional district — Charles H. Taylor (R) won with 55% in 2004, far behind George W. Bush in the area. The district consists of the North Carolina Panhandle around Asheville. Dogged by ethics-related scandals, Taylor faced tougher competition from former professional quarterback Heath Shuler (D) in 2006. A July 10 poll by Public Policy Polling showed that Shuler led Taylor by 51% to 45% .[13] Shuler defeated Taylor 54%-46%.
Ohio
- Ohio's 18th congressional district — Bob Ney (R), the incumbent since 1995, part of the Jack Abramoff Indian lobbying scandal, withdrew from the race in early August 2006,[14] before pleading guilty a month later to criminal charges. Zack Space, the law director of the city of Dover, was the surprise winner of the Democratic nomination. Ney's formal withdrawal on August 14 resulted in a special election to choose his replacement; Ohio state Senator Joy Padgett won with about 65% of the vote. Her candidacy was subsequently damaged by news reports about her business and personal bankruptcies. Space defeated Padgett, 62% to 38%.
Pennsylvania
- Pennsylvania's 4th congressional district — Jason Altmire (D) upset incumbent Republican Melissa Hart in a surprise victory for the Democrats in this suburban Pittsburgh district. Altmire's background was in health care policy and legislative relations; he was overseer of the University of Pittsburgh Medical Center's Office of Charitable Giving before leaving to run for office in June 2005. Hart had seemed untouchable only a few months before the election, and was still generally expected to win on Election Day. Hart blamed her defeat on Altmire's campaign ads that tied her with the locally unpopular president.[15] Altmire defeated Hart, 52% to 48%.
- Pennsylvania's 7th congressional district — Curt Weldon (R) won reelection with 59% of the vote in 2004, but represents a Democratic-leaning district that incorporates much of Delaware County in suburban Philadelphia. He faced retired Navy Vice Admiral Joe Sestak (D). On October 13, it was reported that Weldon and his daughter are being investigated by the FBI, and two days later the FBI raided his daughter's residence.[16][17] Between Sestak's fundraising abilities,[18] and the investigation of Weldon and his daughter, Sestak defeated Weldon, 56% to 44%.
- Pennsylvania's 8th congressional district — Mike Fitzpatrick (R) won election for the first time in 2004 by a wide 56-42 margin over Virginia "Ginny" Schrader, but his district, based in suburban Bucks County, is politically moderate, having voted for Democratic presidents and Republican congressmen since 1992. His Democratic opponent in 2006 was retired Captain Patrick Murphy, an Iraq War veteran of the Army's 82nd Airborne. The Iraq War was the major issue of the campaign. In 2005, Murphy proposed a plan for phased withdrawal; Fitzpatrick stood by President Bush's stay-the-course policy through most of the campaign, before calling for a new plan. Ultimately, Murphy defeated Fitzpatrick by 1,518 votes.
- Pennsylvania's 10th congressional district — Don Sherwood (R) had strong backing as a result of redistricting in this heavy GOP district. The Democrats didn't even field a candidate to run against him in 2002 and 2004. But in 2005 details were made public regarding a five-year affair between Sherwood and Cynthia Ore, who sued Sherwood for $5.5 million alleging physical abuse. On November 8, 2005, the two settled out of court for an undisclosed amount. Sherwood was expected to win the Republican primary easily over teacher Kathy Scott, as she had very little money or campaign staff, but she polled a surprising 44% of the vote against him. His Democratic opponent was professor and U.S. Naval Reserve officer Chris Carney. Carney led in the polls for most of the fall. Carney defeated Sherwood 53% to 47%. For details, see Pennsylvania 10th congressional district election, 2006.
Texas
- Texas's 22nd congressional district — Incumbent former House Majority Leader Tom DeLay (R) won the primary, then retired, leaving his seat vacant, and dropped out of the re-election race. These events followed a number of corruption charges that made DeLay the focus of a September 28, 2005 indictment by a grand jury in Travis County (which includes Austin) over his campaign finances related to Texans for a Republican Majority (TRMPAC) and another political action committee, ARMPAC. In 2004, DeLay won 55% of the vote against a relatively unknown Democrat, environmental lawyer Richard Morrison, even though George W. Bush carried the suburban Houston district with 64% of the vote. Democrats sued to keep DeLay as the Republican nominee when he withdrew, citing a lack of proof of residence outside the district, since Texas law does not allow a party to replace its nominee unless the candidate cannot run due to extraordinary circumstances or if he or she moves away. The Democrats won the suit, and DeLay was forced to remain on the ballot or leave his party without a nominee. Republicans quickly rallied around Shelley Sekula-Gibbs to run a write-in campaign to defeat Nick Lampson the Democratic nominee. Lampson defeated Sekula-Gibbs 52%-42%.
- Texas's 23rd congressional district — In 2004, incumbent Henry Bonilla (R) received nearly 70% of the vote. However, his district, which includes several heavily Republican suburbs of San Antonio, as well as Big Bend National Park and much of Texas' border with Mexico, had to be changed after a mid-2006 U.S. Supreme Court ruling that the redistricting efforts of the Texas Legislature violated Voting Rights Act protection of minorities — largely Hispanic Laredo was in the 23rd District until the redistricting. On August 4, a federal court redrew the district and removed the portion of Webb County that was in the district, eliminating the possibility of a rematch with Cuellar, and added a heavily Democratic portion of San Antonio, the home base of liberal former congressman Ciro Rodriguez. Rodriguez ran against Bonilla in the all-candidate primary on November 7. . The winner of the now somewhat irrelevant Democratic primary, Vietnam War Combat Veteran Rick Bolanos, also ran in the November 7 election. The realigned district is less Republican than the previous version, but Bonilla was still favored against the crowded field of six Democrats, including Rodriguez and Bolanos, and one Independent candidate. A majority was required in this special election to avoid a runoff between the top two contenders. Bonilla won the November 7 election with 49% of the vote, but failed to get the needed 50% of the vote to avoid the runoff. In that runoff, he faced Rodriguez, who got 20% of the special election vote. Bonilla was seen as being the favorite. He ignored Rodriguez until the final days, then ran TV ads portraying him as politically aligned with some Islamic terror supporters, which backfired. In the special election however, Rodriguez was able to portray himself as part of an incoming majority, which would help retain federal funding for programs in the district. Rodriguez defeated Bonilla in the runoff 54% to 46%.
Vermont
- Vermont's at-large congressional district — Incumbent Bernie Sanders (I), a democratic socialist who represented the entire state of Vermont, ran for the Senate seat being vacated by Senator Jim Jeffords. Vermont state Senate President Pro Tempore Peter Welch (D-Windsor County), the Democratic nominee, faced former Vermont Adjutant General Martha Rainville, Major General, USANG (ret.), the Republican nominee. Welch was helped when state Representative David Zuckerman decided not to wage a third-party campaign. Keith Stern, a businessman and zoning board member from Springfield, ran as an Independent; Jane Newton, a retired nurse, ran on the socialist Liberty Union line; and Jerry Trudell ran as an Independent. Welch defeated Rainville 53% to 45%.
Wisconsin
- Wisconsin's 8th congressional district — Incumbent Mark Green (R) — Green ran for governor, and his seat, in northeastern Wisconsin, was Republican-leaning, although it has elected a Democratic congressman as recently as 1996 and is centered around the cities of Green Bay and Appleton. State Assembly Speaker John Gard won the September 12 Republican primary as expected, in which he faced state Assemblywoman Terri McCormick. The Democratic nominee, Steve Kagen M.D., defeated business consultant Jamie Wall and former De Pere Mayor and Brown County Executive Nancy Nusbaum after a very competitive primary. Kagen defeated Gard 51% to 49%. (For details, see Wisconsin 8th congressional district election, 2006.)
Complete list of races
- Alabama
- Alaska
- Arizona
- Arkansas
- California
- Colorado
- Connecticut
- Delaware
- Florida
- Georgia
- Hawaii
- Idaho
- Illinois
- Indiana
- Iowa
- Kansas
- Kentucky
- Louisiana
- Maine
- Maryland
- Massachusetts
- Michigan
- Minnesota
- Mississippi
- Missouri
- Montana
- Nebraska
- Nevada
- New Hampshire
- New Jersey
- New Mexico
- New York
- North Carolina
- North Dakota
- Ohio
- Oklahoma
- Oregon
- Pennsylvania
- Rhode Island
- South Carolina
- South Dakota
- Tennessee
- Texas
- Utah
- Vermont
- Virginia
- Washington
- West Virginia
- Wisconsin
- Wyoming
- Non-voting delegates
Winning candidates are listed in bold.
Key to party abbreviations:
| Abbreviation | Party |
|---|---|
| AI | American Independent |
| C | Constitution |
| D | Democrat |
| G | Green |
| I | Independent |
| IP | Independence |
| L | Libertarian |
| Ref | Reform |
| R | Republican |
| PF | Peace and Freedom Party |
| S | Socialist |
| SW | Socialist Workers Party |
Alabama
| District | Incumbent | Party | First elected |
Results | Candidates |
|---|---|---|---|---|---|
| Alabama 1 | Jo Bonner | Republican | 2002 | Re-elected | Jo Bonner (R) 68.1% Vivian Beckerle (D) 31.8% |
| Alabama 2 | Terry Everett | Republican | 1992 | Re-elected | Terry Everett (R) 69.5% Chuck James (D) 30.4% |
| Alabama 3 | Mike D. Rogers | Republican | 2002 | Re-elected | Mike D. Rogers (R) 59.4% Greg Pierce (D) 38.5% Mark Layfield (I) 2.1% |
| Alabama 4 | Robert Aderholt | Republican | 1996 | Re-elected | Robert Aderholt (R) 70.2% Barbara Bobo (D) 29.7% |
| Alabama 5 | Robert Cramer | Democratic | 1990 | Re-elected | Robert Cramer (D) unopposed |
| Alabama 6 | Spencer Bachus | Republican | 1992 | Re-elected | Spencer Bachus (R) unopposed |
| Alabama 7 | Artur Davis | Democratic | 2002 | Re-elected | Artur Davis (D) unopposed |
Alaska
| District | Incumbent | Party | First elected |
Results | Candidates |
|---|---|---|---|---|---|
| Alaska at-large | Don Young | Republican | 1973 | Re-elected | Don Young (R) 56.6% Diane Benson (D) 40.0% Alexander Crawford (L) 1.7% Eva Ince (G) 0.8% Bill Ratigan (I) 0.7% |
Arizona
| District | Incumbent | Party | First elected |
Results | Candidates |
|---|---|---|---|---|---|
| Arizona 1 | Rick Renzi | Republican | 2002 | Re-elected | Rick Renzi (R) 51.8% Ellen Simon (D) 43.4% David Schlosser (L) 4.8% |
| Arizona 2 | Trent Franks | Republican | 2002 | Re-elected | Trent Franks (R) 58.6% John Thrasher (D) 38.9% Powell Gammill (L) 2.5% |
| Arizona 3 | John Shadegg | Republican | 1994 | Re-elected | John Shadegg (R) 59.3% Don Chilton (D) 38.2% Mark Yannone (L) 2.5% |
| Arizona 4 | Ed Pastor | Democratic | 1990 | Re-elected | Ed Pastor (D) 72.5% Don Karg (R) 23.9% Ronald Harders (L) 3.6% |
| Arizona 5 | J. D. Hayworth | Republican | 1994 | Lost re-election Democratic gain |
Harry Mitchell (D) 50.4% J. D. Hayworth (R) 46.4% Warren Severin (L) 3.1% |
| Arizona 6 | Jeff Flake | Republican | 2000 | Re-elected | Jeff Flake (R) 74.8% Jason Blair (L) 25.2% |
| Arizona 7 | Raul Grijalva | Democratic | 2002 | Re-elected | Raul Grijalva (D) 61.1% Ron Drake (R) 35.4% Joe Cobb (L) 3.6% |
| Arizona 8 | Jim Kolbe | Republican | 1984 | Retired Democratic gain |
Gabrielle Giffords (D) 54.3% Randy Graf (R) 42.1% David Nolan (L) 1.9% Jay Quick (I) 1.7% |
Arkansas
| District | Incumbent | Party | First elected |
Results | Candidates |
|---|---|---|---|---|---|
| Arkansas 1 | Marion Berry | Democratic | 1996 | Re-elected | Marion Berry (D) 69.2% Mickey Stumbaugh (R) 30.8% |
| Arkansas 2 | Vic Snyder | Democratic | 1996 | Re-elected | Vic Snyder (D) 60.5% Andy Mayberry (R) 39.5% |
| Arkansas 3 | John Boozman | Republican | 2000 | Re-elected | John Boozman (R) 62.4% Woodrow Anderson (D) 37.6% |
| Arkansas 4 | Mike Ross | Democratic | 2000 | Re-elected | Mike Ross (D) 74.5% Joe Ross (R) 25.5% |
California
| District | Incumbent | Party | First elected |
Results | Candidates |
|---|---|---|---|---|---|
| California 1 | Mike Thompson | Democratic | 1998 | Re-elected | Mike Thompson (D) 66.3% John Jones (R) 29.0% Pamela Elizondo (G) 3.1% Tim Stock (PF) 1.6% |
| California 2 | Wally Herger | Republican | 1988 | Re-elected | Wally Herger (R) 64.2% Arjinderpal Sekhon (D) 32.5% E. Kent Hinesley (L) 3.3% |
| California 3 | Dan Lungren | Republican | 1998 | Re-elected | Dan Lungren (R) 59.5% Bill Durston (D) 37.9% D.A. Tuma (L) 1.6% Mike Roskey (PF) 1.0% |
| California 4 | John Doolittle | Republican | 1990 | Re-elected | John Doolittle (R) 49.9% Charles Brown (D) 45.4% Dan Warren (L) 5.0% |
| California 5 | Doris Matsui | Democratic | 2005 | Re-elected | Doris Matsui (D) 70.8% X. Claire Yan (R) 23.6% Jeff Kravitz (G) 4.3% John Reiger (PF) 1.3% |
| California 6 | Lynn Woolsey | Democratic | 1992 | Re-elected | Lynn Woolsey (D) 70.3% Todd Hopper (R) 26.1% Rich Friesen (L) 3.6% |
| California 7 | George Miller | Democratic | 1974 | Re-elected | George Miller (D) 83.9% Camden McConnell (L) 16.1% |
| California 8 | Nancy Pelosi | Democratic | 1987 | Re-elected | Nancy Pelosi (D) 80.4% Mike DeNunzio (R) 10.8% Krissy Keefer (G) 7.4% Phillip Berg (L) 1.4% |
| California 9 | Barbara Lee | Democratic | 1998 | Re-elected | Barbara Lee (D) 86.4% John den Dulk (R) 10.7% James Eyer (L) 2.9% |
| California 10 | Ellen Tauscher | Democratic | 1996 | Re-elected | Ellen Tauscher (D) 66.5% Darcy Linn (R) 33.5% |
| California 11 | Richard Pombo | Republican | 1992 | Lost re-election Democratic gain |
Jerry McNerney (D) 53.2% Richard Pombo (R) 46.8% |
| California 12 | Tom Lantos | Democratic | 1980 | Re-elected | Tom Lantos (D) 76.1% Michael Moloney (R) 23.9% |
| California 13 | Pete Stark | Democratic | 1972 | Re-elected | Pete Stark (D) 74.9% George Bruno (R) 25.1% |
| California 14 | Anna Eshoo | Democratic | 1992 | Re-elected | Anna Eshoo (D) 71.1% Rob Smith (R) 24.3% Brian Holtz (L) 2.3% Carole Brouillet (G) 2.3% |
| California 15 | Mike Honda | Democratic | 2000 | Re-elected | Mike Honda (D) 72.4% Raymond Chukwu (R) 27.6% |
| California 16 | Zoe Lofgren | Democratic | 1994 | Re-elected | Zoe Lofgren (D) 72.8% Charel Winston (R) 27.2% |
| California 17 | Sam Farr | Democratic | 1992 | Re-elected | Sam Farr (D) 75.9% Anthony DeMaio (R) 22.6% |
| California 18 | Dennis Cardoza | Democratic | 2002 | Re-elected | Dennis Cardoza (D) 65.4% John Kanno (R) 34.6% |
| California 19 | George Radanovich | Republican | 1996 | Re-elected | George Radanovich (R) 60.6% T.J. Cox (D) 39.4% |
| California 20 | Jim Costa | Democratic | 2004 | Re-elected | 'Jim Costa (D) unopposed |
| California 21 | Devin Nunes | Republican | 2000 | Re-elected | Devin Nunes (R) 66.6% Steven Haze (D) 30.1% John Miller (G) 3.3% |
| California 22 | Bill Thomas | Republican | 1978 | Retired Republican hold |
Kevin McCarthy (R) 70.8% Sharon Beery (D) 29.2% |
| California 23 | Lois Capps | Democratic | 1998 | Re-elected | Lois Capps (D) 65.2% Victor Tognazzini (R) 34.8% |
| California 24 | Elton Gallegly | Republican | 1986 | Re-elected | Elton Gallegly (R) 62.1% Jill Martinez (D) 37.9% |
| California 25 | Howard McKeon | Republican | 1992 | Re-elected | Howard McKeon (R) 60.1% Robert Rodriguez (D) 35.6% David Erickson (L) 4.3% |
| California 26 | David Dreier | Republican | 1980 | Re-elected | David Dreier (R) 57.0% Cynthia Matthews (D) 37.9% Ted Brown (L) 3.3% Elliott Graham (AI) 1.8% |
| California 27 | Brad Sherman | Democratic | 1996 | Re-elected | Brad Sherman (D) 68.8% Peter Hankwitz (R) 31.2% |
| California 28 | Howard Berman | Democratic | 1982 | Re-elected | Howard Berman (D) 74.0% Stanley Kesselman (R) 19.1% Byron De Lear (G) 3.5% Kelley Ross (L) 3.4% |
| California 29 | Adam Schiff | Democratic | 2000 | Re-elected | Adam Schiff (D) 63.5% Bill Bodell (R) 27.5% Bill Paparian (G) 5.7% Lydia Llamas (PF) 1.8% Jim Keller (L) 1.5% |
| California 30 | Henry Waxman | Democratic | 1974 | Re-elected | Henry Waxman (D) 71.5% David Jones (R) 26.4% Adele Cannon (PF) 2.1% |
| California 31 | Xavier Becerra | Democratic | 1992 | Re-elected | Xavier Becerra (D) unopposed |
| California 32 | Hilda Solis | Democratic | 2000 | Re-elected | Hilda Solis (D) 83.0% Leland Faegre (L) 17.0% |
| California 33 | Diane Watson | Democratic | 2001 | Re-elected | Diane Watson (D) unopposed |
| California 34 | Lucille Roybal-Allard | Democratic | 1992 | Re-elected | Lucille Roybal-Allard (D) 76.8% Wayne Miller (R) 23.2% |
| California 35 | Maxine Waters | Democratic | 1990 | Re-elected | Maxine Waters (D) 83.8% Gordon Mego (AI) 8.5% Paul Ireland (L) 7.7% |
| California 36 | Jane Harman | Democratic | 1986 | Re-elected | Jane Harman (D) 63.4% Brian Gibson (R) 32.0% Jim Smith (PF) 2.7% Mike Binkley (L) 1.9% |
| California 37 | Juanita Millender-McDonald | Democratic | 1996 | Re-elected | Juanita Millender-McDonald (D) 82.4% Herb Peters (L) 17.6% |
| California 38 | Grace Napolitano | Democratic | 1998 | Re-elected | Grace Napolitano (D) 75.4% Sid Street (R) 24.6% |
| California 39 | Linda Sánchez | Democratic | 2002 | Re-elected | Linda Sánchez (D) 65.9% James Andion (R) 34.1% |
| California 40 | Ed Royce | Republican | 1992 | Re-elected | Ed Royce (R) 66.8% Florice Hoffman (D) 30.7% Philip Inman (L) 2.5% |
| California 41 | Jerry Lewis | Republican | 1978 | Re-elected | Jerry Lewis (R) 67.0% Louis Contreras (D) 33.0% |
| California 42 | Gary Miller | Republican | 1998 | Re-elected | Gary Miller (R) unopposed |
| California 43 | Joe Baca | Democratic | 1999 | Re-elected | Joe Baca (D) 64.5% Scott Folkens (R) 35.5% |
| California 44 | Ken Calvert | Republican | 1992 | Re-elected | Ken Calvert (R) 60.0% Louis Vandenberg (D) 37.1% Kevin Akin (PF) 2.9% |
| California 45 | Mary Bono | Republican | 1998 | Re-elected | Mary Bono (R) 60.7% David Roth (D) 39.3% |
| California 46 | Dana Rohrabacher | Republican | 1988 | Re-elected | Dana Rohrabacher (R) 59.6% Jim Brandt (D) 36.7% Dennis Chang (L) 3.7% |
| California 47 | Loretta Sanchez | Democratic | 1996 | Re-elected | Loretta Sanchez (D) 62.4% Tan Nguyan (R) 37.6% |
| California 48 | John Campbell | Republican | 2005 | Re-elected | John Campbell (R) 60.0% Steve Young (D) 37.2% Bruce David Cohen (L) 2.8% |
| California 49 | Darrell Issa | Republican | 2000 | Re-elected | Darrell Issa (R) 63.4% Jeeni Criscenzo (D) 33.5% Lars Grossmith (L) 3.1% |
| California 50 | Brian Bilbray | Republican | 2006 | Re-elected | Brian Bilbray (R) 53.2% Francine Busby (D) 43.5% Paul King (L) 1.8% Miriam Clark (PF) 1.5% |
| California 51 | Bob Filner | Democratic | 1992 | Re-elected | Bob Filner (D) 67.5% Blake Miles (R) 30.1% Dan Litwin (L) 2.4% |
| California 52 | Duncan Hunter | Republican | 1980 | Re-elected | Duncan Hunter (R) 64.7% John Rinaldi (D) 32.0% Mike Benoit (L) 3.3% |
| California 53 | Susan Davis | Democratic | 2000 | Re-elected | Susan Davis (D) 67.6% John Woodrum (R) 30.0% Ernie Lippe (L) 2.4% |
Colorado
| District | Incumbent | Party | First elected |
Results | Candidates |
|---|---|---|---|---|---|
| Colorado 1 | Diana DeGette | Democratic | 1996 | Re-elected | Diana DeGette (D) 79.8% Tom Kelly (G) 20.2% |
| Colorado 2 | Mark Udall | Democratic | 1998 | Re-elected | Mark Udall (D) 68.3% Rich Mancuso (R) 28.3% Norm Olsen (L) 2.2% Joe Calhoun (G) 1.3% |
| Colorado 3 | John Salazar | Democratic | 2004 | Re-elected | John Salazar (D) 61.6% Scott Tipton (R) 36.5% Bob Sargent (L) 1.9% |
| Colorado 4 | Marilyn Musgrave | Republican | 2002 | Re-elected | Marilyn Musgrave (R) 45.6% Angie Paccione (D) 43.1% Eric Eidsness (Ref) 11.3% |
| Colorado 5 | Joel Hefley | Republican | 1986 | Retired Republican hold |
Doug Lamborn (R) 59.6% Jay Fawcett (D) 40.4% |
| Colorado 6 | Tom Tancredo | Republican | 1998 | Re-elected | Tom Tancredo (R) 58.6% Bill Winter (D) 39.9% Jack Woehr (L) 1.5% |
| Colorado 7 | Bob Beauprez | Republican | 2002 | Retired to run for Governor Democratic gain |
Ed Perlmutter (D) 54.9% Rick O'Donnell (R) 42.1% Dave Chandler (G) 1.6% Roger McCarville (C) 1.4% |
Connecticut
| District | Incumbent | Party | First elected |
Results | Candidates |
|---|---|---|---|---|---|
| Connecticut 1 | John Larson | Democratic | 1998 | Re-elected | John Larson (D) 74.5% Scott MacLean (R) 25.5% |
| Connecticut 2 | Rob Simmons | Republican | 2000 | Lost re-election Democratic gain |
Joe Courtney (D) 50.02% Rob Simmons (R) 49.98% |
| Connecticut 3 | Rosa DeLauro | Democratic | 1990 | Re-elected | Rosa DeLauro (D) 76.0% Joseph Vollano (R) 22.4% Daniel Sumrall (G) 1.6% |
| Connecticut 4 | Chris Shays | Republican | 1987 | Re-elected | Chris Shays (R) 50.9% Diane Farrell (D) 47.6% Phil Maymin (L) 1.5% |
| Connecticut 5 | Nancy Johnson | Republican | 1982 | Lost re-election Democratic gain |
Chris Murphy (D) 56.5% Nancy Johnson (R) 43.5% |
Delaware
| District | Incumbent | Party | First elected |
Results | Candidates |
|---|---|---|---|---|---|
| Delaware at-large | Michael Castle | Republican | 1992 | Re-elected | Michael Castle (R) 57.2% Dennis Spivack (D) 38.8% Karen Hartley-Nagle (I) 2.2% Michael Berg (G) 1.8% |
Florida
| District | Incumbent | Party | First elected |
Results | Candidates |
|---|---|---|---|---|---|
| Florida 1 | Jeff Miller | Republican | 2001 | Re-elected | Jeff Miller (R) 68.5% Joe Roberts (D) 31.5% |
| Florida 2 | Allen Boyd | Democratic | 1996 | Re-elected | Allen Boyd (D) unopposed |
| Florida 3 | Corrine Brown | Democratic | 1992 | Re-elected | Corrine Brown (D) unopposed |
| Florida 4 | Ander Crenshaw | Republican | 2000 | Re-elected | Ander Crenshaw (R) 69.7% Bob Harms (D) 30.3% |
| Florida 5 | Ginny Brown-Waite | Republican | 2002 | Re-elected | Ginny Brown-Waite (R) 59.9% John T. Russell (D) 40.1% |
| Florida 6 | Cliff Stearns | Republican | 1988 | Re-elected | Cliff Stearns (R) 59.9% Dave Bruderly (D) 40.1% |
| Florida 7 | John Mica | Republican | 1992 | Re-elected | John Mica (R) 63.1% Jack Chagnon (D) 36.9% |
| Florida 8 | Ric Keller | Republican | 2000 | Re-elected | Ric Keller (R) 52.8% Charlie Stuart (D) 45.7% Wesley Hoaglund (I) 1.5% |
| Florida 9 | Michael Bilirakis | Republican | 1982 | Retired Republican hold |
Gus Bilirakis (R) 55.9% Phyllis Busansky (D) 44.1% |
| Florida 10 | Bill Young | Republican | 1970 | Re-elected | Bill Young (R) 65.9% Samm Simpson (D) 34.1% |
| Florida 11 | Jim Davis | Democratic | 1996 | Retired to run for Governor Democratic hold |
Kathy Castor (D) 69.7% Eddie Adams (R) 30.3% |
| Florida 12 | Adam Putnam | Republican | 2000 | Re-elected | Adam Putnam (R) 69.1% Joe Viscusi (I) 19.4% Ed Bowlin III (I) 11.5% |
| Florida 13 | Katherine Harris | Republican | 2002 | Retired to run for U.S. Senate Republican hold |
Vern Buchanan (R) 50.1% Christine Jennings (D) 49.9% |
| Florida 14 | Connie Mack IV | Republican | 2004 | Re-elected | Connie Mack IV (R) 64.4% Robert Neeld (D) 35.6% |
| Florida 15 | Dave Weldon | Republican | 1994 | Re-elected | Dave Weldon (R) 56.3% Bob Bowman (D) 43.7% |
| Florida 16 | Vacant | Mark Foley (R) resigned September 29, 2006 Democratic gain |
Tim Mahoney (D) 49.5% Joe Negron (R)* 47.7% Emmie Lee Ross (I) 2.8% | ||
| Florida 17 | Kendrick Meek | Democratic | 2002 | Re-elected | Kendrick Meek (D) unopposed |
| Florida 18 | Ileana Ros-Lehtinen | Republican | 1989 | Re-elected | Ileana Ros-Lehtinen (R) 62.1% David Patlak (D) 37.9% |
| Florida 19 | Robert Wexler | Democratic | 1996 | Re-elected | Robert Wexler (D) unopposed |
| Florida 20 | Debbie Wasserman Schultz | Democratic | 2004 | Re-elected | Debbie Wasserman Schultz (D) unopposed |
| Florida 21 | Lincoln Diaz-Balart | Republican | 1992 | Re-elected | Lincoln Diaz-Balart (R) 59.5% Frank Gonzalez (D) 40.5% |
| Florida 22 | Clay Shaw | Republican | 1980 | Lost re-election Democratic gain |
Ron Klein (D) 50.9% Clay Shaw (R) 47.1% Neil Evangelista (L) 2.0% |
| Florida 23 | Alcee Hastings | Democratic | 1992 | Re-elected | Alcee Hastings (D) unopposed |
| Florida 24 | Tom Feeney | Republican | 2002 | Re-elected | Tom Feeney (R) 57.9% Clint Curtis (D) 42.1% |
| Florida 25 | Mario Diaz-Balart | Republican | 2002 | Re-elected | Mario Diaz-Balart (R) 58.5% Michael Calderin (D) 41.5% |
- Incumbent Mark Foley resigned on September 29, 2006, simultaneously withdrawing from the race. Republican leaders in this district chose State Rep. Joe Negron to replace Foley, but due to Florida election law, Foley's name remained on the ballot, and all votes for Foley counted as votes for Negron.
Georgia
(With 2005 Redistricting)
| District | Incumbent | Party | First elected |
Results | Candidates |
|---|---|---|---|---|---|
| Georgia 1 | Jack Kingston | Republican | 1992 | Re-elected | Jack Kingston (R) 68.5% Jim Nelson (D) 31.5% |
| Georgia 2 | Sanford Bishop | Democratic | 1992 | Re-elected | Sanford Bishop (D) 67.9% Brad Hughes (R) 32.1% |
| Georgia 3 | Lynn Westmoreland | Republican | 2004 | Re-elected | Lynn Westmoreland (R) 67.6% Mike McGraw (D) 32.4% |
| Georgia 4 | Cynthia McKinney | Democratic | 2002 | Lost renomination Democratic hold |
Hank Johnson (D) 75.4% Catherine Davis (R) 24.6% |
| Georgia 5 | John Lewis | Democratic | 1986 | Re-elected | John Lewis (D) unopposed |
| Georgia 6 | Tom Price | Republican | 2004 | Re-elected | Tom Price (R) 72.4% Steve Sinton (D) 27.6% |
| Georgia 7 | John Linder | Republican | 1992 | Re-elected | John Linder (R) 70.9% Allan Burns (D) 29.1% |
| Georgia 8 | Jim Marshall | Democratic | 2002 | Re-elected | Jim Marshall (D) 50.5% Mac Collins (R) 49.5% |
| Georgia 9 | Nathan Deal | Republican | 1992 | Re-elected | Nathan Deal (R) 76.6% John Bradbury (D) 23.4% |
| Georgia 10 | Charlie Norwood | Republican | 1994 | Re-elected | Charlie Norwood (R) 67.4% Terry Holley (D) 32.6% |
| Georgia 11 | Phil Gingrey | Republican | 2002 | Re-elected | Phil Gingrey (R) 71.1% Patrick Pillion (D) 28.9% |
| Georgia 12 | John Barrow | Democratic | 2004 | Re-elected | John Barrow (D) 50.3% Max Burns (R) 49.7% |
| Georgia 13 | David Scott | Democratic | 2002 | Re-elected | David Scott (D) 69.2% Deborah Honeycutt (R) 30.8% |
Hawaii
| District | Incumbent | Party | First elected |
Results | Candidates |
|---|---|---|---|---|---|
| Hawaii 1 | Neil Abercrombie | Democratic | 1990 | Re-elected | Neil Abercrombie (D) 69.4% Richard Hough (R) 30.6% |
| Hawaii 2 | Ed Case | Democratic | 2002 | Retired to run for U.S. Senate Democratic hold |
Mazie Hirono (D) 61.0% Bob Hogue (R) 39.0% |
Idaho
| District | Incumbent | Party | First elected |
Results | Candidates |
|---|---|---|---|---|---|
| Idaho 1 | C. L. Otter | Republican | 2000 | Retired to run for Governor Republican hold |
Bill Sali (R) 49.9% Larry Grant (D) 44.8% Dave Olson (I) 3.0% Andy Hedden-Nicely (United) 1.2% Paul Smith (C) 1.1% |
| Idaho 2 | Mike Simpson | Republican | 1998 | Re-elected | Mike Simpson (R) 62.0% Jim Hansen (D) 34.4% Cameron Firth (I) 2.4% Travis Hedrick (C) 1.2% |
Illinois
| District | Incumbent | Party | First elected |
Results | Candidates |
|---|---|---|---|---|---|
| Illinois 1 | Bobby Rush | Democratic | 1992 | Re-elected | Bobby Rush (D) 84.1% Jason Tabour (R) 15.9% |
| Illinois 2 | Jesse Jackson, Jr. | Democratic | 1995 | Re-elected | Jesse Jackson, Jr. (D) 84.8% Robert Belin (R) 11.8% Anthony Williams (L) 3.3% |
| Illinois 3 | Dan Lipinski | Democratic | 2004 | Re-elected | Dan Lipinski (D) 77.1% Ray Wardingly (R) 22.9% |
| Illinois 4 | Luis Gutierrez | Democratic | 1992 | Re-elected | Luis Gutierrez (D) 85.8% Ann Melichar (R) 14.2% |
| Illinois 5 | Rahm Emanuel | Democratic | 2002 | Re-elected | Rahm Emanuel (D) 78.0% Kevin White (R) 22.0% |
| Illinois 6 | Henry Hyde | Republican | 1974 | Retired Republican hold |
Peter Roskam (R) 51.4% Tammy Duckworth (D) 48.6% |
| Illinois 7 | Danny Davis | Democratic | 1996 | Re-elected | Danny Davis (D) 86.7% Charles Hutchinson (R) 13.3% |
| Illinois 8 | Melissa Bean | Democratic | 2004 | Re-elected | Melissa Bean (D) 50.9% David McSweeney (R) 44.0% Bill Scheurer (I) 5.1% |
| Illinois 9 | Jan Schakowsky | Democratic | 1998 | Re-elected | Jan Schakowsky (D) 74.6% Michael Shannon (R) 25.4% |
| Illinois 10 | Mark Kirk | Republican | 2000 | Re-elected | Mark Kirk (R) 53.4% Daniel Seals (D) 46.6% |
| Illinois 11 | Jerry Weller | Republican | 1994 | Re-elected | Jerry Weller (R) 55.1% John Pavich (D) 44.9% |
| Illinois 12 | Jerry Costello | Democratic | 1988 | Re-elected | Jerry Costello (D) unopposed |
| Illinois 13 | Judy Biggert | Republican | 1998 | Re-elected | Judy Biggert (R) 58.3% Joseph Shannon (D) 41.7% |
| Illinois 14 | Dennis Hastert | Republican | 1986 | Re-elected | Dennis Hastert (R) 59.8% John Laesch (D) 40.2% |
| Illinois 15 | Tim Johnson | Republican | 2000 | Re-elected | Tim Johnson (R) 57.6% David Gill (D) 42.4% |
| Illinois 16 | Donald Manzullo | Republican | 1992 | Re-elected | Donald Manzullo (R) 63.6% Richard Auman (D) 32.1% John L. Borling (Write-in) 4.3% |
| Illinois 17 | Lane Evans | Democratic | 1982 | Retired Democratic hold |
Phil Hare (D) 57.2% Andrea Lane Zinga (R) 42.8% |
| Illinois 18 | Ray LaHood | Republican | 1994 | Re-elected | Ray LaHood (R) 67.3% Steve Waterworth (D) 32.7% |
| Illinois 19 | John Shimkus | Republican | 1996 | Re-elected | John Shimkus (R) 60.3% Dan Stover (D) 39.7% |
Indiana
| District | Incumbent | Party | First elected |
Results | Candidates |
|---|---|---|---|---|---|
| Indiana 1 | Pete Visclosky | Democratic | 1984 | Re-elected | Pete Visclosky (D) 69.7% Mark Leyva (R) 26.8% Charles Barman (I) 3.5% |
| Indiana 2 | Chris Chocola | Republican | 2002 | Lost re-election Democratic gain |
Joe Donnelly (D) 54.0% Chris Chocola (R) 46.0% |
| Indiana 3 | Mark Souder | Republican | 1994 | Re-elected | Mark Souder (R) 54.3% Tom Hayhurst (D) 45.7% |
| Indiana 4 | Steve Buyer | Republican | 1992 | Re-elected | Steve Buyer (R) 62.4% David Sanders (D) 37.6% |
| Indiana 5 | Dan Burton | Republican | 1982 | Re-elected | Dan Burton (R) 65.0% Katherine Fox Carr (D) 31.4% Sheri Conover Sharlow (L) 3.6% |
| Indiana 6 | Mike Pence | Republican | 2000 | Re-elected | Mike Pence (R) 60.0% Barry Welsh (D) 40.0% |
| Indiana 7 | Julia Carson | Democratic | 1996 | Re-elected | Julia Carson (D) 53.8% Eric Dickerson (R) 46.2% |
| Indiana 8 | John Hostettler | Republican | 1994 | Lost re-election Democratic gain |
Brad Ellsworth (D) 61.0% John Hostettler (R) 39.0% |
| Indiana 9 | Mike Sodrel | Republican | 2004 | Lost re-election Democratic gain |
Baron Hill (D) 50.0% Mike Sodrel (R) 45.5% D. Eric Schansberg (L) 4.5% |
Iowa
| District | Incumbent | Party | First elected |
Results | Candidates |
|---|---|---|---|---|---|
| Iowa 1 | Jim Nussle | Republican | 1990 | Retired to run for Governor Democratic gain |
Bruce Braley (D) 55.0% Mike Whalen (R) 43.3% James Hill (Pirate) 1.1% Al Schoeman (L) 0.6% |
| Iowa 2 | Jim Leach | Republican | 1976 | Lost re-election Democratic gain |
David Loebsack (D) 51.4% Jim Leach (R) 48.6% |
| Iowa 3 | Leonard Boswell | Democratic | 1996 | Re-elected | Leonard Boswell (D) 51.8% Jeff Lamberti (R) 46.7% Helen Meyers (SW) 1.5% |
| Iowa 4 | Tom Latham | Republican | 1994 | Re-elected | Tom Latham (R) 57.4% Selden Spencer (D) 42.6% |
| Iowa 5 | Steve King | Republican | 2002 | Re-elected | Steve King (R) 58.4% Joyce Schulte (D) 35.7% Roy Nielsen (I) 4.5% Cheryl Broderson (I) 1.4% |
Kansas
| District | Incumbent | Party | First elected |
Results | Candidates |
|---|---|---|---|---|---|
| Kansas 1 | Jerry Moran | Republican | 1996 | Re-elected | Jerry Moran (R) 78.7% John Doll (D) 19.9% Sylvester Cain (Ref) 1.4% |
| Kansas 2 | Jim Ryun | Republican | 1996 | Lost re-election Democratic gain |
Nancy Boyda (D) 50.6% Jim Ryun (R) 47.1% Roger Tucker (Ref) 2.3% |
| Kansas 3 | Dennis Moore | Democratic | 1998 | Re-elected | Dennis Moore (D) 64.5% Chuck Ahner (R) 33.8% Robert Conroy (Ref) 1.7% |
| Kansas 4 | Todd Tiahrt | Republican | 1994 | Re-elected | Todd Tiahrt (R) 63.7% Garth McGinn (D) 33.8% Joy Holt (Ref) 2.5% |
Kentucky
| District | Incumbent | Party | First elected |
Results | Candidates |
|---|---|---|---|---|---|
| Kentucky 1 | Ed Whitfield | Republican | 1994 | Re-elected | Ed Whitfield (R) 59.6% Tom Barlow (D) 40.4% |
| Kentucky 2 | Ron Lewis | Republican | 1994 | Re-elected | Ron Lewis (R) 55.4% Mike Weaver (D) 44.6% |
| Kentucky 3 | Anne Northup | Republican | 1996 | Lost re-election Democratic gain |
John Yarmuth (D) 50.6% Anne Northup (R) 48.2% Donna Walker Mancini (L) 0.9% W. Ed Parker (C) 0.3% |
| Kentucky 4 | Geoff Davis | Republican | 2004 | Re-elected | Geoff Davis (R) 51.7% Ken Lucas (D) 43.4% Brian Houillion (L) 4.9% |
| Kentucky 5 | Hal Rogers | Republican | 1980 | Re-elected | Hal Rogers (R) 73.8% Kenneth Stepp (D) 26.2% |
| Kentucky 6 | Ben Chandler | Democratic | 2004 | Re-elected | Ben Chandler (D) 85.5% Paul Ard (L) 14.5% |
Louisiana
| District | Incumbent | Party | First elected |
Results | Candidates |
|---|---|---|---|---|---|
| Louisiana 1 | Bobby Jindal | Republican | 2004 | Re-elected | Bobby Jindal (R) 88.1% David Gereighty (D) 7.4% Stacey Tallitsch (D) 3.4% Peter Beary (L) 1.1% |
| Louisiana 2 | Bill Jefferson | Democratic | 1990 | Re-elected In Runoff | Bill Jefferson* (D) 30.1% (56.6%) Karen Carter* (D) 21.7% (43.4%) Derrick Shepherd (D) 17.9% Joe Lavigne (R) 13.3% Troy Carter (D) 12.0% Eric Bradley (R) 1.2% Regina Bartholomew (D) 1.2% John Edwards (D) 0.7% Scott Barron (D) 0.7% Gregory "Rhumbline" Kahn (L) 0.4% Vinnie Mendoza (D) 0.4% Lance von Udhe (R) 0.3% Deven "D.C." Collins (D) 0.1% |
| Louisiana 3 | Charlie Melancon | Democratic | 2004 | Re-elected | Charlie Melancon (D) 55.0% Craig Romero (R) 40.3% Olangee Breech (D) 3.1% James Lee Blake (L) 1.6% |
| Louisiana 4 | Jim McCrery | Republican | 1988 | Re-elected | Jim McCrery (R) 57.4% Artis Cash (D) 16.9% Patti Cox (D) 13.2% Chester Kelley (R) 12.4% |
| Louisiana 5 | Rodney Alexander | Republican | 2002 | Re-elected | Rodney Alexander (R) 68.3% Gloria Williams Hearn (D) 29.0% Brent Sanders (L) 1.6% John Watts (I) 1.1% |
| Louisiana 6 | Richard Baker | Republican | 1986 | Re-elected | Richard Baker (R) 82.8% Richard Fontanesi (L) 17.2% |
| Louisiana 7 | Charles Boustany | Republican | 2004 | Re-elected | Charles Boustany (R) 70.7% Mike Stagg (D) 29.3% |
- Because Bill Jefferson did not win 50% of the vote in the November 7th, 2006 election (technically an "open primary" in Louisiana), he faced a runoff election against Louisiana State Representative Karen Carter on December 9, 2006. Jefferson was victorious, earning 57% of the vote to Carter's 43%.
Maine
| District | Incumbent | Party | First elected |
Results | Candidates |
|---|---|---|---|---|---|
| Maine 1 | Tom Allen | Democratic | 1996 | Re-elected | Tom Allen (D) 60.8% Darlene Curley (R) 31.3% Dexter Kamilewicz (I) 7.9% |
| Maine 2 | Mike Michaud | Democratic | 2002 | Re-elected | Mike Michaud (D) 70.5% Scott D'Amboise (R) 29.5% |
Maryland
| District | Incumbent | Party | First elected |
Results | Candidates |
|---|---|---|---|---|---|
| Maryland 1 | Wayne Gilchrest | Republican | 1990 | Re-elected | Wayne Gilchrest (R) 68.8% Jim Corwin (D) 31.1% |
| Maryland 2 | Dutch Ruppersberger | Democratic | 2002 | Re-elected | Dutch Ruppersberger (D) 69.2% Jimmy Mathis (R) 30.7% |
| Maryland 3 | Ben Cardin | Democratic | 1986 | Retired to run for U.S. Senate Democratic hold |
John Sarbanes (D) 64.0% John White (R) 33.8% Charles Curtis McPeek (L) 2.1% |
| Maryland 4 | Albert Wynn | Democratic | 1992 | Re-elected | Albert Wynn (D) 80.7% Moshe Starkman (R) 18.6% |
| Maryland 5 | Steny Hoyer | Democratic | 1981 | Re-elected | Steny Hoyer (D) 82.7% Steve Warner (G) 16.5% Peter Kuhnert (C/Write-in) 0.3% |
| Maryland 6 | Roscoe Bartlett | Republican | 1992 | Re-elected | Roscoe Bartlett (R) 59.0% Andrew Duck (D) 38.4% Robert Kozak (G) 2.5% |
| Maryland 7 | Elijah Cummings | Democratic | 1996 | Re-elected | Elijah Cummings (D) unopposed |
| Maryland 8 | Chris Van Hollen Jr. | Democratic | 2002 | Re-elected | Chris Van Hollen Jr. (D) 76.5% Jeff Stein (R) 21.9% Gerard Giblin (G) 1.5% |
Massachusetts
| District | Incumbent | Party | First elected |
Results | Candidates |
|---|---|---|---|---|---|
| Massachusetts 1 | John Olver | Democratic | 1991 | Re-elected | John Olver (D) 76.5% Bill Szych (I) 23.5% |
| Massachusetts 2 | Richard Neal | Democratic | 1988 | Re-elected | Richard Neal (D) unopposed |
| Massachusetts 3 | Jim McGovern | Democratic | 1996 | Re-elected | Jim McGovern (D) unopposed |
| Massachusetts 4 | Barney Frank | Democratic | 1980 | Re-elected | Barney Frank (D) unopposed |
| Massachusetts 5 | Marty Meehan | Democratic | 1992 | Re-elected | Marty Meehan (D) unopposed |
| Massachusetts 6 | John Tierney | Democratic | 1996 | Re-elected | John Tierney (D) 69.7% Rick Barton (R) 29.3% |
| Massachusetts 7 | Ed Markey | Democratic | 1976 | Re-elected | Ed Markey (D) unopposed |
| Massachusetts 8 | Mike Capuano | Democratic | 1998 | Re-elected | Mike Capuano (D) 91.0% Laura Garza (SW) 9.0% |
| Massachusetts 9 | Stephen Lynch | Democratic | 2001 | Re-elected | Stephen Lynch (D) 78.2% Jack Robinson III (R) 21.8% |
| Massachusetts 10 | Bill Delahunt | Democratic | 1996 | Re-elected | Bill Delahunt (D) 64.3% Jeff Beatty (R) 29.4% Peter White (I) 6.3% |
Michigan
| District | Incumbent | Party | First elected |
Results | Candidates |
|---|---|---|---|---|---|
| Michigan 1 | Bart Stupak | Democratic | 1992 | Re-elected | Bart Stupak (D) 69.4% Dan Hooper (R) 28.0% Joshua Warren (Taxpayers) 0.9% David Newland (G) 0.9% Ken Proctor (L) 0.8% |
| Michigan 2 | Pete Hoekstra | Republican | 1992 | Re-elected | Pete Hoekstra (R) 66.4% Kimon Kotos (D) 31.6% Ronald Graeser (Taxpayers) 1.0% Steven Van Til (L) 1.0% |
| Michigan 3 | Vern Ehlers | Republican | 1993 | Re-elected | Vern Ehlers (R) 63.1% Jim Rinck (D) 34.6% Jeff Steinport (L) 1.4% Rodger Gurk (G) 0.9% |
| Michigan 4 | Dave Camp | Republican | 1990 | Re-elected | Dave Camp (R) 60.6% Mike Huckleberry (D) 37.9% John Emerick (Taxpayers) 0.8% Allitta Hren (L) 0.7% |
| Michigan 5 | Dale Kildee | Democratic | 1976 | Re-elected | Dale Kildee (D) 72.9% Eric Klammer (R) 25.2% Ken Mathenia (G) 1.0% Steve Samoranksi II (L) 0.9% |
| Michigan 6 | Fred Upton | Republican | 1986 | Re-elected | Fred Upton (R) 60.6% Kim Clark (D) 37.9% Kenneth Howe (L) 1.5% |
| Michigan 7 | Joe Schwarz | Republican | 2004 | Lost renomination Republican hold |
Tim Walberg (R) 49.9% Sharon Renier (D) 46.0% Robert Hutchinson (L) 1.5% David Horn (Taxpayers) 1.5% Joe Schwarz (Write-in) 1.1% |
| Michigan 8 | Mike Rogers | Republican | 2000 | Re-elected | Mike Rogers (R) 55.3% Jim Marcinkowski (D) 42.9% Dick Gach (L) 1.0% Aaron Stuttman (G) 0.8% |
| Michigan 9 | Joe Knollenberg | Republican | 1992 | Re-elected | Joe Knollenberg (R) 51.6% Nancy Skinner (D) 46.2% Adam Goodman (L) 1.3% Matthew Abel (G) 0.9% |
| Michigan 10 | Candice Miller | Republican | 2002 | Re-elected | Candice Miller (R) 66.2% Robert Denison (D) 31.3% Mark Byrne (L) 1.1% Candace Caveny (G) 0.7% Richard Gualdoni (Taxpayers) 0.7% |
| Michigan 11 | Thad McCotter | Republican | 2002 | Re-elected | Thad McCotter (R) 54.1% Tony Trupiano (D) 43.0% John Tatar (L) 1.6% Charles Tackett (Taxpayers) 1.3% |
| Michigan 12 | Sander Levin | Democratic | 1982 | Re-elected | Sander Levin (D) 70.2% Randell Shafer (R) 26.1% Andy Lecureaux (L) 1.3% Les Townsend (Taxpayers) 0.9% Jerome White (I) 0.8% Art Mayatt (G) 0.7% |
| Michigan 13 | Carolyn Kilpatrick | Democratic | 1996 | Re-elected | Carolyn Kilpatrick (D) (unopposed) |
| Michigan 14 | John Conyers Jr. | Democratic | 1964 | Re-elected | John Conyers Jr. (D) 85.3% Chad Miles (R) 14.7% |
| Michigan 15 | John Dingell | Democratic | 1955 | Re-elected | John Dingell (D) 87.9% Aimee Smith (G) 4.6% Gregory Stempfle (L) 4.1% Robert Czak (Taxpayers) 3.4% |
Minnesota
| District | Incumbent | Party | First elected |
Results | Candidates |
|---|---|---|---|---|---|
| Minnesota 1 | Gil Gutknecht | Republican | 1994 | Lost re-election Democratic gain |
Tim Walz (D) 52.7% Gil Gutknecht (R) 47.1% |
| Minnesota 2 | John Kline | Republican | 2002 | Re-elected | John Kline (R) 56.2% Coleen Rowley (D) 40.0% Douglas Williams (IP) 3.7% |
| Minnesota 3 | Jim Ramstad | Republican | 1990 | Re-elected | Jim Ramstad (R) 64.9% Wendy Wilde (Pareene) (D) 35.0% |
| Minnesota 4 | Betty McCollum | Democratic | 2000 | Re-elected | Betty McCollum (D) 69.5% Obi Sium (R) 30.2% |
| Minnesota 5 | Martin Sabo | Democratic | 1978 | Retired Democratic hold |
Keith Ellison (D) 55.6% Alan Fine (R) 21.3% Tammy Lee (IP) 21.0% Jay Pond (G) 2.0% |
| Minnesota 6 | Mark Kennedy | Republican | 2000 | Retired to run for U.S. Senate Republican hold |
Michele Bachmann (R) 50.1% Patty Wetterling (D) 42.1% John Binkowski (IP) 7.8% |
| Minnesota 7 | Collin Peterson | Democratic | 1990 | Re-elected | Collin Peterson (D) 69.7% Mike Barrett (R) 29.0% Ken Lucier (C) 1.3% |
| Minnesota 8 | Jim Oberstar | Democratic | 1974 | Re-elected | Jim Oberstar (D) 63.6% Rod Grams (R) 34.4% Harry Welty (Unity) 1.9% |
Mississippi
| District | Incumbent | Party | First elected |
Results | Candidates |
|---|---|---|---|---|---|
| Mississippi 1 | Roger Wicker | Republican | 1994 | Re-elected | Roger Wicker (R) 65.9% Ken Hurt (D) 34.1% |
| Mississippi 2 | Bennie Thompson | Democratic | 1993 | Re-elected | Bennie Thompson (D) 64.3% Yvonne Brown (R) 35.7% |
| Mississippi 3 | Chip Pickering | Republican | 1996 | Re-elected | Chip Pickering (R) 77.7% Jim Giles (I) 16.1% Lamonica Magee (Ref) 6.2% |
| Mississippi 4 | Gene Taylor | Democratic | 1989 | Re-elected | Gene Taylor (D) 79.8% Randy McDonnell (R) 20.2% |
Missouri
| District | Incumbent | Party | First elected |
Results | Candidates |
|---|---|---|---|---|---|
| Missouri 1 | William Lacy Clay Jr. | Democratic | 2000 | Re-elected | William Lacy Clay, Jr. (D) 72.9% Mark Byrne (R) 24.7% Robb Cunningham (L) 2.4% |
| Missouri 2 | Todd Akin | Republican | 2000 | Re-elected | Todd Akin (R) 61.3% George Weber (D) 36.6% Tamara Millay (L) 2.1% |
| Missouri 3 | Russ Carnahan | Democratic | 2004 | Re-elected | Russ Carnahan (D) 65.6% David Bertelsen (R) 31.7% Rob Christophel (L) 1.9% David Sladky (Progressive) 0.8% |
| Missouri 4 | Ike Skelton | Democratic | 1976 | Re-elected | Ike Skelton (D) 67.6% Jim Noland (R) 29.4% Bryce Holthouse (L) 1.9% Mel Ivey (Progressive) 1.0% |
| Missouri 5 | Emanuel Cleaver | Democratic | 2004 | Re-elected | Emanuel Cleaver (D) 64.2% Jacob Turk (R) 32.3% Randy Langkraehr (L) 3.5% |
| Missouri 6 | Sam Graves | Republican | 2000 | Re-elected | Sam Graves (R) 61.6% Sara Jo Shettles (D) 35.7% Erik Buck (L) 1.9% Shirley Yurkonis (Progressive) 0.7% |
| Missouri 7 | Roy Blunt | Republican | 1996 | Re-elected | Roy Blunt (R) 66.7% Jack Truman (D) 30.1% Kevin Craig (L) 3.1% |
| Missouri 8 | Jo Ann Emerson | Republican | 1996 | Re-elected | Jo Ann Emerson (R) 71.6% Veronica Hambacker (D) 26.4% Brandon McCullough (L) 2.0% |
| Missouri 9 | Kenny Hulshof | Republican | 1996 | Re-elected | Kenny Hulshof (R) 61.4% Duane Burghard (D) 35.9% Steven Hedrick (L) 1.6% Bill Hastings (Progressive) 1.0% |
Montana
| District | Incumbent | Party | First elected |
Results | Candidates |
|---|---|---|---|---|---|
| Montana at-large | Denny Rehberg | Republican | 2000 | Re-elected | Denny Rehberg (R) 59.0% Monica Lindeen (D) 39.1% Mike Fellows (L) 1.9% |
Nebraska
| District | Incumbent | Party | First elected |
Results | Candidates |
|---|---|---|---|---|---|
| Nebraska 1 | Jeff Fortenberry | Republican | 2004 | Re-elected | Jeff Fortenberry (R) 58.4% Maxine Moul (D) 41.6% |
| Nebraska 2 | Lee Terry | Republican | 1998 | Re-elected | Lee Terry (R) 54.7% Jim Esch (D) 45.3% |
| Nebraska 3 | Tom Osborne | Republican | 2000 | Retired to run for Governor Republican hold |
Adrian Smith (R) 55.0% Scott Kleeb (D) 45.0% |
Nevada
| District | Incumbent | Party | First elected |
Results | Candidates |
|---|---|---|---|---|---|
| Nevada 1 | Shelley Berkley | Democratic | 1998 | Re-elected | Shelley Berkley (D) 64.8% Kenneth Wegner (R) 31.2% Jim Duensing (L) 2.2% Darnell Roberts (Independent American) 1.8% |
| Nevada 2 | Jim Gibbons | Republican | 1996 | Retired to run for Governor Republican hold |
Dean Heller (R) 50.4% Jill Derby (D) 44.9% Daniel Rosen (I) 2.4% James Kroshus (Independent American) 2.3% |
| Nevada 3 | Jon Porter | Republican | 2002 | Re-elected | Jon Porter (R) 48.5% Tessa Hafen (D) 46.6% Joshua Hansen (Independent American) 2.5% Joseph Silvestri (L) 2.4% |
New Hampshire
| District | Incumbent | Party | First elected |
Results | Candidates |
|---|---|---|---|---|---|
| New Hampshire 1 | Jeb Bradley | Republican | 2002 | Lost re-election Democratic gain |
Carol Shea-Porter (D) 51.3% Jeb Bradley (R) 48.7% |
| New Hampshire 2 | Charlie Bass | Republican | 1994 | Lost re-election Democratic gain |
Paul Hodes (D) 52.7% Charlie Bass (R) 45.6% Ken Blevens (L) 1.6% |
New Jersey
| District | Incumbent | Party | First elected |
Results | Candidates |
|---|---|---|---|---|---|
| New Jersey 1 | Rob Andrews | Democratic | 1990 | Re-elected | Rob Andrews (D) unopposed |
| New Jersey 2 | Frank LoBiondo | Republican | 1994 | Re-elected | Frank LoBiondo (R) 61.6% Viola Thomas-Hughes (D) 35.6% Robert Mullock (I) 1.7% Lynn Merle (I) 0.5% Thomas Fanslau (I) 0.3% Willie Norwood (S) 0.2% |
| New Jersey 3 | Jim Saxton | Republican | 1984 | Re-elected | Jim Saxton (R) 58.4% Rich Sexton (D) 41.0% Ken Feduniewicz (I) 0.6% |
| New Jersey 4 | Chris Smith | Republican | 1980 | Re-elected | Chris Smith (R) 65.7% Carol Gay (D) 33.2% Jay Edgar (L) 0.8% Louis Wary (I) 0.3% |
| New Jersey 5 | Scott Garrett | Republican | 2002 | Re-elected | Scott Garrett (R) 54.9% Paul Aronsohn (D) 43.8% Matthew Fretz (I) 1.3% |
| New Jersey 6 | Frank Pallone | Democratic | 1988 | Re-elected | Frank Pallone (D) 68.6% Leigh-Ann Bellew (R) 30.3% Herbert Tarbous (I) 1.1% |
| New Jersey 7 | Mike Ferguson | Republican | 2000 | Re-elected | Mike Ferguson (R) 49.4% Linda Stender (D) 47.9% Thomas Abrams (I) 1.6% Darren Young (L) 1.0% |
| New Jersey 8 | Bill Pascrell | Democratic | 1996 | Re-elected | Bill Pascrell (D) 70.9% Jose Sandoval (R) 28.4% Lou Jasikoff (L) 0.7% |
| New Jersey 9 | Steve Rothman | Democratic | 1996 | Re-elected | Steve Rothman (D) 71.5% Vincent Micco (R) 27.6% Michael Jarvis (I) 0.9% |
| New Jersey 10 | Don Payne | Democratic | 1988 | Re-elected | Don Payne (D) unopposed |
| New Jersey 11 | Rodney Frelinghuysen | Republican | 1994 | Re-elected | Rodney Frelinghuysen (R) 62.1% Tom Wyka (D) 36.6% Richard Roth (L) 0.9% John Mele (C) 0.4% |
| New Jersey 12 | Rush Holt | Democratic | 1998 | Re-elected | Rush Holt (D) 65.7% Joseph Sinagra (R) 34.3% |
| New Jersey 13 | Vacant | Bob Menendez (D) resigned January 18, 2006 Democratic hold |
Albio Sires (D) 77.5% John Guarini (R) 19.4% Brian Williams (SWP) 1.0% Herbert Shaw (I) 1.0% Dick Hester (I) 0.6% Esmat Zaklama (I) 0.5% | ||
New Mexico
| District | Incumbent | Party | First elected |
Results | Candidates |
|---|---|---|---|---|---|
| New Mexico 1 | Heather Wilson | Republican | 1998 | Re-elected | Heather Wilson (R) 50.2% Patricia Madrid (D) 49.8% |
| New Mexico 2 | Steve Pearce | Republican | 2002 | Re-elected | Steve Pearce (R) 59.4% Albert Kissling (D) 40.5% |
| New Mexico 3 | Tom Udall | Democratic | 1998 | Re-elected | Tom Udall (D) 74.6% Ron Dolin (R) 25.4% |
New York
| District | Incumbent | Party | First elected |
Results | Candidates |
|---|---|---|---|---|---|
| New York 1 | Tim Bishop | Democratic | 2002 | Re-elected | Tim Bishop (D) 62.2% Italo Zanzi (R) 37.8% |
| New York 2 | Steve Israel | Democratic | 2000 | Re-elected | Steve Israel (D) 70.4% Josh Price (R) 29.6% |
| New York 3 | Peter King | Republican | 1992 | Re-elected | Peter King (R) 56.0% David Mejias (D) 44.0% |
| New York 4 | Carolyn McCarthy | Democratic | 1996 | Re-elected | Carolyn McCarthy (D) 64.9% Martin Blessinger (R) 35.1% |
| New York 5 | Gary Ackerman | Democratic | 1983 | Re-elected | Gary Ackerman (D) unopposed |
| New York 6 | Gregory Meeks | Democratic | 1998 | Re-elected | Gregory Meeks (D) unopposed |
| New York 7 | Joseph Crowley | Democratic | 1998 | Re-elected | Joseph Crowley (D) 84.0% Kevin Brawley (R) 16.0% |
| New York 8 | Jerrold Nadler | Democratic | 1992 | Re-elected | Jerrold Nadler (D) 85.0% Eleanor Friedman (R) 13.6% Dennis Adornato (Cons) 1.4% |
| New York 9 | Anthony Weiner | Democratic | 1998 | Re-elected | Anthony Weiner (D) unopposed |
| New York 10 | Ed Towns | Democratic | 1982 | Re-elected | Ed Towns (D) 92.2% Jonathan Anderson (R) 5.9% Ernest Johnson (Cons) 1.9% |
| New York 11 | Major Owens | Democratic | 1982 | Retired Democratic hold |
Yvette Clarke (D) 90.0% Stephen Finger (R) 7.6% Mariana Blume (Cons) 1.4% Ollie McClean (Freedom) 1.0% |
| New York 12 | Nydia Velazquez | Democratic | 1992 | Re-elected | Nydia Velazquez (D) 89.7% Allan Romaguera (R) 10.3% |
| New York 13 | Vito Fossella | Republican | 1997 | Re-elected | Vito Fossella (R) 56.8% Steve Harrison (D) 43.2% |
| New York 14 | Carolyn Maloney | Democratic | 1992 | Re-elected | Carolyn Maloney (D) 84.5% Danniel Maio (R) 15.5% |
| New York 15 | Charles Rangel | Democratic | 1970 | Re-elected | Charles Rangel (D) 94.0% Edward Daniels (R) 6.0% |
| New York 16 | Jose Serrano | Democratic | 1990 | Re-elected | Jose Serrano (D) 95.3% Ali Mohamed (R) 4.7% |
| New York 17 | Eliot Engel | Democratic | 1988 | Re-elected | Eliot Engel (D) 76.4% Jim Faulkner (R) 23.6% |
| New York 18 | Nita Lowey | Democratic | 1988 | Re-elected | Nita Lowey (D) 70.7% Richard A. Hoffman (R) 29.3% |
| New York 19 | Sue Kelly | Republican | 1994 | Lost re-election Democratic gain |
John Hall (D) 51.2% Sue Kelly (R) 48.8% |
| New York 20 | John Sweeney | Republican | 1998 | Lost re-election Democratic gain |
Kirsten Gillibrand (D) 53.1% John Sweeney (R) 46.9% |
| New York 21 | Mike McNulty | Democratic | 1988 | Re-elected | Mike McNulty (D) 78.2% Warren Redlich (R) 21.8% |
| New York 22 | Maurice Hinchey | Democratic | 1992 | Re-elected | Maurice Hinchey (D) unopposed |
| New York 23 | John McHugh | Republican | 1992 | Re-elected | John McHugh (R) 63.1% Robert Johnson (D) 36.9% |
| New York 24 | Sherwood Boehlert | Republican | 1982 | Retired Democratic gain |
Mike Arcuri (D) 53.9% Ray Meier (R) 45.0% Mike Sylvia (L) 1.1% |
| New York 25 | Jim Walsh | Republican | 1988 | Re-elected | Jim Walsh (R) 50.8% Dan Maffei (D) 49.2% |
| New York 26 | Tom Reynolds | Republican | 1998 | Re-elected | Tom Reynolds (R) 52.0% Jack Davis (D) 48.0% |
| New York 27 | Brian Higgins | Democratic | 2004 | Re-elected | Brian Higgins (D) 79.3% Michael McHale (R) 20.7% |
| New York 28 | Louise Slaughter | Democratic | 1986 | Re-elected | Louise Slaughter (D) 73.2% John Donnelly (R) 26.8% |
| New York 29 | Randy Kuhl | Republican | 2004 | Re-elected | Randy Kuhl (R) 51.5% Eric Massa (D) 48.5% |
North Carolina
| District | Incumbent | Party | First elected |
Results | Candidates |
|---|---|---|---|---|---|
| North Carolina 1 | G. K. Butterfield | Democratic | 2004 | Re-elected | G.K. Butterfield (D) unopposed |
| North Carolina 2 | Bob Etheridge | Democratic | 1996 | Re-elected | Bob Etheridge (D) 66.5% Dan Mansell (R) 33.5% |
| North Carolina 3 | Walter Jones Jr. | Republican | 1994 | Re-elected | Walter Jones Jr. (R) 68.6% Craig Weber (D) 31.4% |
| North Carolina 4 | David Price | Democratic | 1996 | Re-elected | David Price (D) 65.0% Steven Acuff (R) 35.0% |
| North Carolina 5 | Virginia Foxx | Republican | 2004 | Re-elected | Virginia Foxx (R) 57.2% Roger Sharpe (D) 42.8% |
| North Carolina 6 | Howard Coble | Republican | 1984 | Re-elected | Howard Coble (R) 70.8% Rory Blake (D) 29.2% |
| North Carolina 7 | Mike McIntyre | Democratic | 1996 | Re-elected | Mike McIntyre (D) 72.8% Shirley Davis (R) 27.2% |
| North Carolina 8 | Robin Hayes | Republican | 1998 | Re-elected | Robin Hayes (R) 50.1% Larry Kissell (D) 49.9% |
| North Carolina 9 | Sue Myrick | Republican | 1994 | Re-elected | Sue Myrick (R) 66.5% Bill Glass (D) 33.5% |
| North Carolina 10 | Patrick McHenry | Republican | 2004 | Re-elected | Patrick McHenry (R) 61.8% Richard Carsner (D) 38.2% |
| North Carolina 11 | Charles Taylor | Republican | 1990 | Lost re-election Democratic gain |
Heath Shuler (D) 53.8% Charles Taylor (R) 46.2% |
| North Carolina 12 | Mel Watt | Democratic | 1992 | Re-elected | Mel Watt (D) 67.0% Ada Fisher (R) 33.0% |
| North Carolina 13 | Brad Miller | Democratic | 2002 | Re-elected | Brad Miller (D) 63.7% Vernon Robinson (R) 36.3% |
North Dakota
| District | Incumbent | Party | First elected |
Results | Candidates |
|---|---|---|---|---|---|
| North Dakota at-large | Earl Pomeroy | Democratic-NPL | 1992 | Re-elected | Earl Pomeroy (D-NPL) 65.7% Matthew Mechtel (R) 34.3% |
Ohio
| District | Incumbent | Party | First elected |
Results | Candidates |
|---|---|---|---|---|---|
| Ohio 1 | Steve Chabot | Republican | 1994 | Re-elected | Steve Chabot (R) 52.3% John Cranley (D) 47.7% |
| Ohio 2 | Jean Schmidt | Republican | 2005 | Re-elected | Jean Schmidt (R) 50.5% Victoria Wulsin (D) 49.4% |
| Ohio 3 | Mike Turner | Republican | 2002 | Re-elected | Mike Turner (R) 58.5% Richard Chema (D) 41.5% |
| Ohio 4 | Mike Oxley | Republican | 1981 | Retired Republican hold |
Jim Jordan (R) 60.0% Richard Siferd (D) 40.0% |
| Ohio 5 | Paul Gillmor | Republican | 1988 | Re-elected | Paul E. Gillmor (R) 56.9% Robin Weirauch (D) 43.1% |
| Ohio 6 | Ted Strickland | Democratic | 1992 | Retired to run for Governor Democratic hold |
Charlie Wilson (D) 62.1% Chuck Blasdel (R) 37.9% |
| Ohio 7 | Dave Hobson | Republican | 1990 | Re-elected | Dave Hobson (R) 60.6% Bill Conner (D) 39.4% |
| Ohio 8 | John Boehner | Republican | 1990 | Re-elected | John Boehner (R) 63.8% Mort Meier (D) 36.2% |
| Ohio 9 | Marcy Kaptur | Democratic | 1982 | Re-elected | Marcy Kaptur (D) 73.6% Bradley Leavitt (R) 26.4% |
| Ohio 10 | Dennis Kucinich | Democratic | 1996 | Re-elected | Dennis Kucinich (D) 66.4% Mike Dovilla (R) 33.6% |
| Ohio 11 | Stephanie Tubbs Jones | Democratic | 1998 | Re-elected | Stephanie Tubbs Jones (D) 83.4% Lindsey String (R) 16.6% |
| Ohio 12 | Pat Tiberi | Republican | 2000 | Re-elected | Pat Tiberi (R) 57.3% Bob Shamansky (D) 42.7% |
| Ohio 13 | Sherrod Brown | Democratic | 1992 | Retired to run for U.S. Senate Democratic hold |
Betty Sutton (D) 61.2% Craig Foltin (R) 38.8% |
| Ohio 14 | Steve LaTourette | Republican | 1994 | Re-elected | Steve LaTourette (R) 57.6% Lewis Katz (D) 39.0% Werner Lange (I) 3.4% |
| Ohio 15 | Deborah Pryce | Republican | 1992 | Re-elected | Deborah Pryce (R) 50.2% Mary Jo Kilroy (D) 49.7% |
| Ohio 16 | Ralph Regula | Republican | 1972 | Re-elected | Ralph Regula (R) 58.3% Tom Shaw (D) 41.7% |
| Ohio 17 | Tim Ryan | Democratic | 2002 | Re-elected | Tim Ryan (D) 80.3% Don Manning III (R) 19.7% |
| Ohio 18 | Vacant | Bob Ney (R) resigned November 11, 2006 Democratic gain |
Zack Space (D) 62.1% Joy Padgett (R) 37.9% | ||
Oklahoma
| District | Incumbent | Party | First elected |
Results | Candidates |
|---|---|---|---|---|---|
| Oklahoma 1 | John Sullivan | Republican | 2002 | Re-elected | John Sullivan (R) 63.6% Alan Gentges (D) 30.9% Bill Wortman (I) 5.5% |
| Oklahoma 2 | Dan Boren | Democratic | 2004 | Re-elected | Dan Boren (D) 72.7% Patrick Miller (R) 27.3% |
| Oklahoma 3 | Frank Lucas | Republican | 1994 | Re-elected | Frank Lucas (R) 67.5% Susan Barton (D) 32.5% |
| Oklahoma 4 | Tom Cole | Republican | 2002 | Re-elected | Tom Cole (R) 64.6% Hal Spake (D) 35.4% |
| Oklahoma 5 | Ernest Istook | Republican | 1992 | Retired to run for Governor Republican hold |
Mary Fallin (R) 60.4% David Hunter (D) 37.3% Matthew Horton Woodson (I) 2.3% |
Oregon
| District | Incumbent | Party | First elected |
Results | Candidates |
|---|---|---|---|---|---|
| Oregon 1 | David Wu | Democratic | 1998 | Re-elected | David Wu (D) 62.8% Derrick Kitts (R) 33.7% Drake Davis (L) 1.7% Dean Wolf (C) 1.6% |
| Oregon 2 | Greg Walden | Republican | 1998 | Re-elected | Greg Walden (R) 66.8% Carol Voisin (D) 30.4% Jack Alan Brown Jr. (C) 2.6% |
| Oregon 3 | Earl Blumenauer | Democratic | 1996 | Re-elected | Earl Blumenauer (D) 73.5% Bruce Broussard (R) 23.5% David Brownlow (C) 2.8% |
| Oregon 4 | Peter DeFazio | Democratic | 1986 | Re-elected | Peter DeFazio (D) 62.3% Jim Feldkamp (R) 37.6% |
| Oregon 5 | Darlene Hooley | Democratic | 1996 | Re-elected | Darlene Hooley (D) 54.0% Mike Erickson (R) 42.8% Paul Aranas (Pacific Green) 1.5% Doug Patterson (C) 1.5% |
Pennsylvania
| District | Incumbent | Party | First elected |
Results | Candidates |
|---|---|---|---|---|---|
| Pennsylvania 1 | Bob Brady | Democratic | 1998 | Re-elected | Bob Brady (D) unopposed |
| Pennsylvania 2 | Chaka Fattah | Democratic | 1994 | Re-elected | Chaka Fattah (D) 88.6% Michael Gessner (R) 9.2% Dave Baker (G) 2.2% |
| Pennsylvania 3 | Phil English | Republican | 1994 | Re-elected | Phil English (R) 53.6% Steven Porter (D) 42.1% Tim Hagberg (C) 4.3% |
| Pennsylvania 4 | Melissa Hart | Republican | 2000 | Lost re-election Democratic gain |
Jason Altmire (D) 51.9% Melissa Hart (R) 48.1% |
| Pennsylvania 5 | John Peterson | Republican | 1996 | Re-elected | John Peterson (R) 60.1% Don Hilliard (D) 39.9% |
| Pennsylvania 6 | Jim Gerlach | Republican | 2002 | Re-elected | Jim Gerlach (R) 50.7% Lois Murphy (D) 49.3% |
| Pennsylvania 7 | Curt Weldon | Republican | 1986 | Lost re-election Democratic gain |
Joe Sestak (D) 56.4% Curt Weldon (R) 43.6% |
| Pennsylvania 8 | Mike Fitzpatrick | Republican | 2004 | Lost re-election Democratic gain |
Patrick Murphy (D) 50.3% Mike Fitzpatrick (R) 49.7% |
| Pennsylvania 9 | Bill Shuster | Republican | 2001 | Re-elected | Bill Shuster (R) 60.3% Tony Barr (D) 39.7% |
| Pennsylvania 10 | Don Sherwood | Republican | 1998 | Lost re-election Democratic gain |
Chris Carney (D) 52.9% Don Sherwood (R) 47.1% |
| Pennsylvania 11 | Paul Kanjorski | Democratic | 1984 | Re-elected | Paul Kanjorski (D) 72.5% Joseph Leonardi (R) 27.5% |
| Pennsylvania 12 | John Murtha | Democratic | 1974 | Re-elected | John Murtha (D) 60.8% Diana Irey (R) 39.2% |
| Pennsylvania 13 | Allyson Schwartz | Democratic | 2004 | Re-elected | Allyson Schwartz (D) 66.1% Raj Bhakta (R) 33.9% |
| Pennsylvania 14 | Mike Doyle | Democratic | 1994 | Re-elected | Mike Doyle (D) 90.1% Titus North (G) 9.9% |
| Pennsylvania 15 | Charlie Dent | Republican | 2004 | Re-elected | Charlie Dent (R) 53.6% Charles Dertinger (D) 43.5% Greta Browne (G) 2.9% |
| Pennsylvania 16 | Joe Pitts | Republican | 1996 | Re-elected | Joe Pitts (R) 56.6% Lois Herr (D) 39.5% John Murphy (I) 3.9% |
| Pennsylvania 17 | Tim Holden | Democratic | 1992 | Re-elected | Tim Holden (D) 64.5% Matthew Wertz (R) 35.5% |
| Pennsylvania 18 | Tim Murphy | Republican | 2002 | Re-elected | Tim Murphy (R) 57.8% Chad Kluko (D) 42.2% |
| Pennsylvania 19 | Todd Platts | Republican | 2000 | Re-elected | Todd Platts (R) 64.0% Phil Avillo (D) 33.5% Derf Maitland (G) 2.5% |
Rhode Island
| District | Incumbent | Party | First elected |
Results | Candidates |
|---|---|---|---|---|---|
| Rhode Island 1 | Patrick Kennedy | Democratic | 1994 | Re-elected | Patrick Kennedy (D) 69.2% Jonathan Scott (R) 23.2% Kenneth Capalbo (I) 7.6% |
| Rhode Island 2 | Jim Langevin | Democratic | 2000 | Re-elected | Jim Langevin (D) 72.7% Rod Driver (I) 27.3% |
South Carolina
| District | Incumbent | Party | First elected |
Results | Candidates |
|---|---|---|---|---|---|
| South Carolina 1 | Henry Brown, Jr. | Republican | 2000 | Re-elected | Henry Brown, Jr. (R) 59.9% Randy Maatta (D) 37.9% James Dunn (G) 2.2% |
| South Carolina 2 | Joe Wilson | Republican | 2001 | Re-elected | Joe Wilson (R) 62.6% Michael Ray Ellisor (D) 37.3% |
| South Carolina 3 | J. Gresham Barrett | Republican | 2002 | Re-elected | J. Gresham Barrett (R) 62.9% Lee Ballenger (D) 37.1% |
| South Carolina 4 | Bob Inglis | Republican | 2004 | Re-elected | Bob Inglis (R) 64.2% William Griffith (D) 32.0% John Cobin (L) 2.5% Faye Walters (G) 1.3% |
| South Carolina 5 | John Spratt | Democratic | 1982 | Re-elected | John Spratt (D) 56.9% Ralph Norman (R) 43.1% |
| South Carolina 6 | Jim Clyburn | Democratic | 1992 | Re-elected | Jim Clyburn (D) 64.4% Gary McLeod (R) 34.2% Antonio Williams (G) 1.4% |
South Dakota
| District | Incumbent | Party | First elected |
Results | Candidates |
|---|---|---|---|---|---|
| South Dakota at-large | Stephanie Herseth | Democratic | 2004 | Re-elected | Stephanie Herseth (D) 69.1% Bruce Whalen (R) 29.3% Larry Rudebusch (L) 1.6% |
Tennessee
| District | Incumbent | Party | First elected |
Results | Candidates |
|---|---|---|---|---|---|
| Tennessee 1 | William L. Jenkins | Republican | 1996 | Retired Republican hold |
David Davis (R) 61.1% Rick Trent (D) 36.9% Bob Smith (G) 0.6% James Reeves (I) 0.6% Michael Peavler (I) 0.5% Michael Sabri (I) 0.2% |
| Tennessee 2 | Jimmy Duncan Jr. | Republican | 1998 | Re-elected | Jimmy Duncan Jr. (R) 77.7% John Greene (D) 22.3% |
| Tennessee 3 | Zach Wamp | Republican | 1994 | Re-elected | Zach Wamp (R) 65.7% Brent Benedict (D) 34.3% |
| Tennessee 4 | Lincoln Davis | Democratic | 2002 | Re-elected | Lincoln Davis (D) 67.5% Kenneth Martin (R) 32.5% |
| Tennessee 5 | Jim Cooper | Democratic | 2002 | Re-elected | Jim Cooper (D) 68.9% Tom Kovach (R) 28.0% Virginia Welsch (I) 2.1% Scott Knapp (I) 1.0% |
| Tennessee 6 | Bart Gordon | Democratic | 1984 | Re-elected | Bart Gordon (D) 67.1% Randy Stamps (R) 31.4% Robert Garrison (I) 1.1% Norman Saliba (I) 0.5% |
| Tennessee 7 | Marsha Blackburn | Republican | 2002 | Re-elected | Marsha Blackburn (R) 66.0% Bill Morrison (D) 31.8% Katey Culver (G) 0.8% James White (I) 0.4% William Smith (I) 0.4% John L. Rimer (I) 0.3% Gayl Pratt (I) 0.3% |
| Tennessee 8 | John Tanner | Democratic | 1988 | Re-elected | John Tanner (D) 73.2% John Farmer (R) 26.8% |
| Tennessee 9 | Harold Ford Jr. | Democratic | 1996 | Retired to run for U.S. Senate Democratic hold |
Steve Cohen (D) 59.9% Jake Ford (I) 22.2% Mark White (R) 18.0% |
Texas
Texas's 22nd district was held by Tom DeLay who had resigned. The Democratic Party sued to prevent the Republican Party from replacing Tom DeLay (who was determined to be the candidate in March 2006) with another candidate. The courts agreed with the Democratic Party and the Supreme Court has refused to hear the appeal. On August 8, 2006, Tom DeLay officially withdrew his name as the Republican candidate. (The court decision did not allow the Republican Party from changing its candidate, however it did not prevent Tom DeLay from withdrawing altogether.)[19]
Texas's 23rd district was declared unconstitutional by the Supreme Court of the United States, which ordered the district re-drawn. This affected the 15th, 21st, 23rd, 25th, and 28th districts, which had a blanket primary on Election Day, followed by a runoff on December 6 in District 23, where no candidate got a majority of the vote.
| District | Incumbent | Party | First elected |
Results | Candidates |
|---|---|---|---|---|---|
| Texas 1 | Louie Gohmert | Republican | 2004 | Re-elected | Louie Gohmert (R) 68.0% Roger Owen (D) 30.3% Donald Perkison (L) 1.7% |
| Texas 2 | Ted Poe | Republican | 2004 | Re-elected | Ted Poe (R) 65.6% Gary Binderim (D) 32.7% Justo Perez (L) 1.7% |
| Texas 3 | Sam Johnson | Republican | 1991 | Re-elected | Sam Johnson (R) 62.5% Dan Dodd (D) 34.9% Christopher Claytor (L) 2.6% |
| Texas 4 | Ralph Hall | Republican | 1980 | Re-elected | Ralph Hall (R) 64.4% Glenn Melancon (D) 33.4% Kurt Helm (L) 2.1% |
| Texas 5 | Jeb Hensarling | Republican | 2002 | Re-elected | Jeb Hensarling (R) 61.8% Charlie Thompson (D) 35.6% Mike Nelson (L) 2.6% |
| Texas 6 | Joe Barton | Republican | 1984 | Re-elected | Joe Barton (R) 60.5% David Harris (D) 37.1% Carl Nulsen (L) 2.4% |
| Texas 7 | John Culberson | Republican | 2000 | Re-elected | John Culberson (R) 59.2% Jim Henley (D) 38.5% Drew Parks (L) 2.3% |
| Texas 8 | Kevin Brady | Republican | 1996 | Re-elected | Kevin Brady (R) 67.3% Jim Wright (D) 32.7% |
| Texas 9 | Al Green | Democratic | 2004 | Re-elected | Al Green (D) unopposed |
| Texas 10 | Michael McCaul | Republican | 2004 | Re-elected | Michael McCaul (R) 55.3% Ted Ankrum (D) 40.4% Michael Badnarik (L) 4.3% |
| Texas 11 | Mike Conaway | Republican | 2004 | Re-elected | Mike Conaway (R) unopposed |
| Texas 12 | Kay Granger | Republican | 1996 | Re-elected | Kay Granger (R) 66.9% John Morris (D) 31.1% Gardner Osborne (L) 2.0% |
| Texas 13 | Mac Thornberry | Republican | 1994 | Re-elected | Mac Thornberry (R) 74.4% Roger Waun (D) 23.0% Jim Thompson (L) 2.6% |
| Texas 14 | Ron Paul | Republican | 1996 | Re-elected | Ron Paul (R) 60.2% Shane Sklar (D) 39.8% |
| Texas 15 | Ruben Hinojosa | Democratic | 1996 | Re-elected | Ruben Hinojosa (D) 61.8% Paul Haring (R) 23.7% Eddie Zamora (R) 14.5% |
| Texas 16 | Silvestre Reyes | Democratic | 1996 | Re-elected | Silvestre Reyes (D) 78.7% Gordon Strickland (L) 21.3% |
| Texas 17 | Chet Edwards | Democratic | 1990 | Re-elected | Chet Edwards (D) 58.1% Van Taylor (R) 40.3% Guillermo Acosta (L) 1.6% |
| Texas 18 | Sheila Jackson Lee | Democratic | 1994 | Re-elected | Sheila Jackson Lee (D) 76.6% Ahmad Hassan (R) 19.1% Patrick Warren (L) 4.3% |
| Texas 19 | Randy Neugebauer | Republican | 2002 | Re-elected | Randy Neugebauer (R) 67.7% Robert Ricketts (D) 29.8% Fred Jones (L) 2.4% Mike Sadler (Write-in) 0.1% |
| Texas 20 | Charlie Gonzalez | Democratic | 1998 | Re-elected | Charlie Gonzalez (D) 87.4% Michael Idrogo (L) 12.6% |
| Texas 21 | Lamar Smith | Republican | 1986 | Re-elected | Lamar Smith (R) 60.1% John Courage (D) 24.5% Gene Kelly (D) 9.0% Tommy Calvert (I) 2.6% James Arthur Strohm (L) 2.0% Jim Peterson (I) 1.1% Mark Rossano (I) 0.7% |
| Texas 22 | Shelley Sekula-Gibbs | Republican | 2006 | Lost renomination Democratic gain |
Nick Lampson (D) 51.8% Shelley Sekula-Gibbs (R/Write-in) 41.8% Bob Smither (L) 6.1% Don Richardson (Write-in) 0.3% |
| Texas 23 | Henry Bonilla | Republican | 1992 | Lost re-election in run-off (District was declared unconstitutional by Supreme Court in August, 2006 and redrawn) |
Ciro Rodriguez (D)* 19.9% (54.3%) Henry Bonilla (R)* 48.6% (45.7%) Alvert Uresti (D) 11.8% Lukin Gilliland (D) 11.1% Craig Stephens (L) 2.7% Augie Beltran (D) 2.1% Rick Bolanos (D) 2.1% Adrian DeLeon (D) 1.8% |
| Texas 24 | Kenny Marchant | Republican | 2004 | Re-elected | Kenny Marchant (R) 59.8% Gary Page (D) 37.2% Mark Frohman (L) 3.0% |
| Texas 25 | Lloyd Doggett | Democratic | 1994 | Re-elected | Lloyd Doggett (D) 67.3% Grant Rostig (R) 26.3% Barbara Cunningham (L) 4.2% Brian Parrett (I) 2.2% |
| Texas 26 | Michael Burgess | Republican | 2002 | Re-elected | Michael Burgess (R) 60.2% Tim Barnwell (D) 37.2% Rich Haas (L) 2.5% |
| Texas 27 | Solomon Ortiz | Democratic | 1982 | Re-elected | Solomon Ortiz (D) 56.8% Willie Vaden (R) 38.9% Robert Powell (L) 4.3% |
| Texas 28 | Henry Cuellar | Democratic | 2004 | Re-elected | Henry Cuellar (D) 67.6% Frank Enriquez (D) 20.3% Ron Avery (C) 12.1% |
| Texas 29 | Gene Green | Democratic | 1992 | Re-elected | Gene Green (D) 73.5% Eric Story (R) 24.4% Clifford Lee Messina (L) 2.0% |
| Texas 30 | Eddie Bernice Johnson | Democratic | 1992 | Re-elected | Eddie Bernice Johnson (D) 80.2% Wilson Aurbach (R) 17.6% Ken Ashby (L) 2.2% |
| Texas 31 | John Carter | Republican | 2002 | Re-elected | John Carter (R) 58.5% Mary Beth Harrell (D) 38.8% Matt McAdoo (L) 2.7% |
| Texas 32 | Pete Sessions | Republican | 1996 | Re-elected | Pete Sessions (R) 56.4% Will Pryor (D) 41.3% John Hawley (L) 2.3% |
Utah
| District | Incumbent | Party | First elected |
Results | Candidates |
|---|---|---|---|---|---|
| Utah 1 | Rob Bishop | Republican | 2002 | Re-elected | Rob Bishop (R) 63.1% Steven Olsen (D) 32.4% Mark Hudson (C) 3.1% Lynn Badler (L) 1.4% |
| Utah 2 | Jim Matheson | Democratic | 2000 | Re-elected | Jim Matheson (D) 59.0% LaVar Christensen (R) 37.3% David Perry (C) 1.5% Bob Brister (G) 1.5% Austin Sherwood Lett (L) 0.7% |
| Utah 3 | Chris Cannon | Republican | 1996 | Re-elected | Chris Cannon (R) 57.7% Christian Burridge (D) 32.2% Jim Noorlander (C) 8.8% Philip Hallman (L) 1.3% |
Vermont
| District | Incumbent | Party | First elected |
Results | Candidates |
|---|---|---|---|---|---|
| Vermont at-large | Bernie Sanders | Independent | 1990 | Retired to run for U.S. Senate Democratic gain |
Peter Welch (D) 53.2% Martha Rainville (R) 44.5% Dennis Morrisseau (I) 0.5% Jerry Trudell (I) 0.3% Bruce Marshall (G) 0.3% Keith Stern (I) 0.3% Jane Newton (Liberty Union) 0.2% Chris Karr (I) 0.2% |
Virginia
| District | Incumbent | Party | First elected |
Results | Candidates |
|---|---|---|---|---|---|
| Virginia 1 | Jo Ann Davis | Republican | 2000 | Re-elected | Jo Ann Davis (R) 63.0% Shawn Michael O'Donnell (D) 35.5% Marvin Pixton III (I) 1.4% |
| Virginia 2 | Thelma Drake | Republican | 2004 | Re-elected | Thelma Drake (R) 51.3% Phil Kellam (D) 48.5% |
| Virginia 3 | Bobby Scott | Democratic | 1992 | Re-elected | Bobby Scott (D) unopposed |
| Virginia 4 | Randy Forbes | Republican | 2001 | Re-elected | Randy Forbes (R) 76.1% Albert Burckard (Ind. Green) 23.4% |
| Virginia 5 | Virgil Goode | Republican | 1996 | Re-elected | Virgil Goode (R) 59.1% Al Weed (D) 39.9% Joseph Oddo (Ind. Green) 0.9% |
| Virginia 6 | Bob Goodlatte | Republican | 1992 | Re-elected | Bob Goodlatte (R) 75.1% Barbara Jean Pryor (I) 12.3% Andre Peery (I) 12.1% |
| Virginia 7 | Eric Cantor | Republican | 2000 | Re-elected | Eric Cantor (R) 63.9% Jim Nachman (D) 34.4% Brad Blanton (I) 1.6% |
| Virginia 8 | Jim Moran | Democratic | 1990 | Re-elected | Jim Moran (D) 66.4% Thomas O'Donoghue (R) 30.6% Jim Hurysz (I) 2.8% |
| Virginia 9 | Rick Boucher | Democratic | 1982 | Re-elected | Rick Boucher (D) 67.8% Bill Carrico (R) 32.2% |
| Virginia 10 | Frank Wolf | Republican | 1980 | Re-elected | Frank Wolf (R) 57.3% Judy Feder (D) 41.0% Bill Wood (L) 0.9% Neeraj Nigam (I) 0.8% |
| Virginia 11 | Tom Davis | Republican | 1994 | Re-elected | Tom Davis (R) 55.5% Andrew Hurst (D) 43.6% Fernando Greco (Ind. Green) 0.9% |
Washington
| District | Incumbent | Party | First elected |
Results | Candidates |
|---|---|---|---|---|---|
| Washington 1 | Jay Inslee | Democratic | 1998 | Re-elected | Jay Inslee (D) 67.7% Larry Ishmael (R) 32.3% |
| Washington 2 | Rick Larsen | Democratic | 2000 | Re-elected | Rick Larsen (D) 64.2% Doug Roulstone (R) 35.8% |
| Washington 3 | Brian Baird | Democratic | 1998 | Re-elected | Brian Baird (D) 63.1% Michael Messmore (R) 36.9% |
| Washington 4 | Doc Hastings | Republican | 1994 | Re-elected | Doc Hastings (R) 59.9% Richard Wright (D) 40.1% |
| Washington 5 | Cathy McMorris | Republican | 2004 | Re-elected | Cathy McMorris (R) 56.4% Peter Goldmark (D) 43.6% |
| Washington 6 | Norm Dicks | Democratic | 1976 | Re-elected | Norm Dicks (D) 70.6% Doug Cloud (R) 29.4% |
| Washington 7 | Jim McDermott | Democratic | 1988 | Re-elected | Jim McDermott (D) 79.4% Steve Beren (R) 15.7% Linnea Noreen (I) 4.9% |
| Washington 8 | Dave Reichert | Republican | 2004 | Re-elected | Dave Reichert (R) 51.5% Darcy Burner (D) 48.5% Richard Todd (I/Write-in) |
| Washington 9 | Adam Smith | Democratic | 1996 | Re-elected | Adam Smith (D) 65.7% Steve Cofchin (R) 34.3% |
West Virginia
| District | Incumbent | Party | First elected |
Results | Candidates |
|---|---|---|---|---|---|
| West Virginia 1 | Alan Mollohan | Democratic | 1982 | Re-elected | Alan Mollohan (D) 64.3% Christopher Wakim (R) 35.6% |
| West Virginia 2 | Shelley Capito | Republican | 2000 | Re-elected | Shelley Capito (R) 57.2% Mike Callaghan (D) 42.8% |
| West Virginia 3 | Nick Rahall | Democratic | 1976 | Re-elected | Nick Rahall (D) 69.4% Kim Wolfe (R) 30.6% |
Wisconsin
| District | Incumbent | Party | First elected |
Results | Candidates |
|---|---|---|---|---|---|
| Wisconsin 1 | Paul Ryan | Republican | 1998 | Re-elected | Paul Ryan (R) 62.8% Jeff Thomas (D) 37.2% |
| Wisconsin 2 | Tammy Baldwin | Democratic | 1998 | Re-elected | Tammy Baldwin (D) 62.9% Dave Magnum (R) 37.1% |
| Wisconsin 3 | Ron Kind | Democratic | 1996 | Re-elected | Ron Kind (D) 64.9% Paul Nelson (R) 35.1% |
| Wisconsin 4 | Gwen Moore | Democratic | 2004 | Re-elected | Gwen Moore (D) 71.5% Perfecto Rivera (R) 28.5% |
| Wisconsin 5 | Jim Sensenbrenner | Republican | 1978 | Re-elected | Jim Sensenbrenner (R) 61.8% Bryan Kennedy (D) 35.7% Bob Levis (G) 1.4% Robert R. Raymond (I) 1.1% |
| Wisconsin 6 | Tom Petri | Republican | 1979 | Re-elected | Tom Petri (R) unopposed |
| Wisconsin 7 | Dave Obey | Democratic | 1969 | Re-elected | Dave Obey (D) 62.2% Nick Reid (R) 35.0% Mike Miles (G) 2.8% |
| Wisconsin 8 | Mark Green | Republican | 1998 | Retired to run for Governor Democratic gain |
Steve Kagen (D) 51.1% John Gard (R) 48.9% |
Wyoming
| District | Incumbent | Party | First elected |
Results | Candidates |
|---|---|---|---|---|---|
| Wyoming at-large | Barbara Cubin | Republican | 1994 | Re-elected | Barbara Cubin (R) 48.3% Gary Trauner (D) 47.8% Thomas Rankin (L) 3.9% |
Non-voting delegates
| District | Incumbent | Party | First elected |
Results | Candidates |
|---|---|---|---|---|---|
| American Samoa at-large | Eni Faleomavaega | Democratic | 1988 | Re-elected | Eni Faleomavaega (D) unopposed |
| District of Columbia at-large | Eleanor Holmes Norton | Democratic | 1990 | Re-elected | Eleanor Holmes Norton (D) unopposed |
| Guam at-large | Madeleine Bordallo | Democratic | 2002 | Re-elected | Madeleine Bordallo (D) unopposed |
| U.S. Virgin Islands at-large | Donna Christian-Christensen | Democratic | 1996 | Re-elected | Donna Christian-Christensen (D) 62.9% Warren Mosler (I) 37.1% |
See also
- United States Senate elections, 2006
- United States gubernatorial elections, 2006
- United States presidential election, 2008
- United States general elections, 2006
References
- ↑ "So Why Did the Democrats Win?". Time Magazine. November 15, 2006. Retrieved March 6, 2014.
- ↑ Don Rose (December 26, 2006). "Democratic sweep may be long-lasting". Chicago Tribune. Retrieved April 9, 2014.
- ↑ "Democrats win House, promise new direction". CNN. November 8, 2006. Retrieved March 6, 2014.
- ↑ Archibold, Randal C. (September 11, 2006). "In Cost and Vitriol, Race in Arizona Draws Notice". The New York Times. Retrieved May 26, 2010.
- ↑ Jon Kamman (September 22, 2006). "GOP cancels $1 mil in Graf ad support". The Arizona Republic.
- ↑ California's 11th district primary election results
- ↑ "McCloskey Bucks GOP, Backs Democrat". A Stand for Justice. Associated Press. July 24, 2006.
- ↑ "Recount Gives Courtney Win In 2nd District". NBC Connecticut. Archived from the original on September 27, 2007.
- ↑ "U.S. House of Representatives / Florida 16". America Votes 2006. CNN.
Official results from Florida Secretary of State - ↑ Lee, Mara (July 2, 2006). "Candidates cash in on celebrities". Evansville Courier & Press.
- ↑ "U.S. House of Representatives / Minnesota 01". America Votes 2006. CNN.
- ↑ Tomlin, John (April 27, 2006). "Congressman Socializes with Students". Concordiensis. Archived from the original on April 30, 2008.
- ↑ "Shuler keeps lead for US House" (PDF) (Press release). Public Policy Polling. Archived from the original (PDF) on July 15, 2006.
- ↑ Stout, David (August 7, 2006). "Ohio Congressman Will Not Seek Re-election". The New York Times.
- ↑ "Altmire Pulls Off Upset Against Melissa Hart". KDKA-TV. November 8, 2006. Archived from the original on September 27, 2007.
- ↑ John Shiffman, Mitch Lipka and Patrick Kerkstra (October 16, 2006). "Agents raid homes of Rep. Curt Weldon's daughter, close friend". Philadelphia Inquirer.
- ↑ "FBI raids home of Weldon's daughter, friend in influence probe". WHDH-TV. Associated Press. October 16, 2006.
- ↑ Giroux, Greg (October 13, 2006). "Navy Vet Sestak Coming Closer to Sinking Weldon in Pa. 7". CQPolitics.com. Archived from the original on October 27, 2006.
- ↑ Gamboa, Suzanne (August 8, 2006). "DeLay to Make Way for Write-In Candidate". The Washington Post.
External links
- 2006 Election Guide The New York Times
- check on voter registration
- 2006 Election Projections Survey
- United States Election 2006 Web Archive from the U.S. Library of Congress
See also
| Political activities |  | |
|---|---|---|
| Family |
| |