List of United Kingdom general elections
This is a list of United Kingdom general elections (elections for the UK House of Commons) since the first in 1802. The members of the 1801–1802 Parliament had been elected to the former Parliament of Great Britain and Parliament of Ireland, before being co-opted to serve in the first Parliament of the United Kingdom, so that Parliament is not included in the table below.
Election results
In 1801 the right to vote in the United Kingdom was a severely restricted practice. Universal suffrage, on an equal basis for men and women over the age of 21, was established in 1929. Before 1918, general elections did not occur on a single day and polling was spread over several weeks. The date given in the table for elections prior to 1918 is the date Parliament assembled after the election, which could be in the year after the general election.
The majority figure given is for the difference between the number of MPs elected at the general election from the party (or parties) of the government, as opposed to all other parties (some of which may have been giving some support to the government, but were not participating in a coalition). The Speaker is excluded from the calculation. A negative majority means that there was a hung parliament (or minority parliament) following that election. For example, in the 1929 election, Labour was 42 seats short of forming a majority, and so its majority is listed as −42. If the party in office changed the figure is re-calculated, but no allowance is made for changes after the general election.
No attempt is made to define a majority before 1832, when the Reform Act disenfranchised the rotten boroughs; before then the Tory party had an undemocratically entrenched dominance. Particularly in the early part of the period the complexity of factional alignments, with both the Whig and Tory traditions tending to have some members in government and others in opposition factions simultaneously, make it impossible to produce an accurate majority figure. The figures between 1832 and about 1859 are approximate due to problems of defining what was a party in government, as the source provides figures for all Liberals rather than just the Whig component in what developed into the Liberal Party. The Whig and Peelite Prime Ministers in the table below are regarded as having the support of all Liberals.
| Election | Date | Prime Minister(s) (during term) | Winning Party | Majority | Turnout (%)[5] | Notes |
|---|---|---|---|---|---|---|
| 1802 (MPs) | 22 July 1802 | Henry Addington William Pitt the Younger[6] The Lord Grenville |
Tory Tory (Pittite who called himself a Whig) Whig |
... | ||
| 1806 (MPs) | 17 November 1806 | The Lord Grenville The Duke of Portland |
Whig Tory (Pittite who called himself a Whig) |
... | ||
| 1807 (MPs) | 22 June 1807 | The Duke of Portland Spencer Perceval[7] The Earl of Liverpool |
Tory (Pittite who called himself a Whig) Tory Tory |
... | ||
| 1812 (MPs) | 24 November 1812 | The Earl of Liverpool | Tory | ... | ||
| 1818 (MPs) | 4 August 1818 | The Earl of Liverpool | Tory | ... | ||
| 1820 (MPs) | 16 January 1821 | The Earl of Liverpool | Tory | ... | ||
| 1826 (MPs) | 19 June 1826 | The Earl of Liverpool George Canning[8] The Viscount Goderich The Duke of Wellington |
Tory Tory Tory Tory |
... | ||
| 1830 (MPs) | 9 August 1830 | The Duke of Wellington[9] The Earl Grey |
Tory Whig |
... | ||
| 1831 (MPs) | 25 July 1831 | The Earl Grey | Whig | 136 | ||
| At this point, the Reform Act 1832 gave suffrage to propertied male adults and disenfranchised almost all of the rotten boroughs. | ||||||
| 1832 (MPs) | 29 January 1833 | The Earl Grey The Viscount Melbourne[10] The Duke of Wellington Sir Robert Peel |
Whig Whig Conservative Conservative |
225 (L) −308 (C) |
||
| 1835 (MPs) | 19 February 1835 | Sir Robert Peel[11] The Viscount Melbourne |
Conservative Whig |
−113 (C) 113 (L) |
||
| 1837 (MPs) | 15 November 1837 | The Viscount Melbourne[12] | Whig | 29 | ||
| 1841 (MPs) | 19 August 1841 | The Viscount Melbourne[13] Sir Robert Peel[14] Lord John Russell |
Whig Conservative Whig |
77 |
||
| 1847 (MPs) | 9 August 1847 | Lord John Russell[15] The Earl of Derby |
Whig Conservative |
−72 | ||
| 1852 (MPs) | 4 November 1852 | The Earl of Derby[16] The Earl of Aberdeen[17] The Viscount Palmerston |
Conservative Peelite Whig |
7 | ||
| 1857 (MPs) | 30 April 1857 | The Viscount Palmerston[18] The Earl of Derby |
Whig Conservative |
100 |
||
| 1859 (MPs) | 31 May 1859 | The Earl of Derby[19] The Viscount Palmerston |
Conservative Liberal |
59 |
||
| 1865 (MPs) | 11 July 1865 | The Viscount Palmerston[20] The Earl Russell[21] The Earl of Derby Benjamin Disraeli |
Liberal Liberal Conservative Conservative |
81 | ||
| At this point, the Reform Act 1867 significantly widened the suffrage and disenfranchised more smaller boroughs. | ||||||
| 1868 (MPs) | 10 December 1868 | William Ewart Gladstone | Liberal | 115 | ||
| 1874 (MPs) | 5 March 1874 | Benjamin Disraeli | Conservative | 49 | ||
| 1880 (MPs) | 29 April 1880 | William Ewart Gladstone[22] The Marquess of Salisbury |
Liberal Conservative |
51 |
||
| At this point, the Representation of the People Act 1884 extended the borough franchise of 1867 to the counties, increasing the electorate to about 5,500,000 men. | ||||||
| 1885 (MPs) | 12 January 1886 | The Marquess of Salisbury[23] William Ewart Gladstone[24] |
Conservative Liberal |
−172 |
||
| 1886 (MPs) | 5 August 1886 | The Marquess of Salisbury | Conservative | 116 | ||
| 1892 (MPs) | 4 August 1892 | The Marquess of Salisbury[25] William Ewart Gladstone The Earl of Rosebery[26] The Marquess of Salisbury[27] |
Conservative Liberal Liberal Conservative |
−126 |
||
| 1895 (MPs) | 12 August 1895 | The Marquess of Salisbury | Conservative | 153 | ||
| 1900 (MPs) | 3 December 1900 | The Marquess of Salisbury Arthur Balfour Sir Henry Campbell-Bannerman[28] |
Conservative Conservative Liberal |
135 |
Khaki election | |
| 1906 (MPs) | 13 February 1906 | Sir Henry Campbell-Bannerman H. H. Asquith |
Liberal | 129 | ||
| January 1910 (MPs) | 15 February 1910 | H. H. Asquith | Liberal | −122 | ||
| December 1910 (MPs) | 31 January 1911 | H. H. Asquith David Lloyd George |
Liberal | −126 | ||
| The Parliament Act 1911 reduced the maximum life of a Parliament from seven years to five; however, the election that would have been due by 1915 as a result of the Act was not held due to World War I (1914–1918)
At this point, the Representation of the People Act 1918 gave suffrage to most of the adult population (men over 21, women over 30). | ||||||
| 1918 (MPs) | 14 December 1918 | David Lloyd George Andrew Bonar Law[29] |
Liberal (Coalition government) Conservative |
238 |
57.2 |
Coalition Coupon |
| 1922 (MPs) | 15 November 1922 | Andrew Bonar Law Stanley Baldwin |
Conservative | 74 | 73 | |
| 1923 (MPs) | 6 December 1923 | Stanley Baldwin[30] Ramsay MacDonald |
Conservative Labour |
−98 |
71.1 | |
| 1924 (MPs) | 29 October 1924 | Stanley Baldwin | Conservative | 210 | 77 | |
| At this point, the Representation of the People Act 1928 gave universal suffrage to the adult population over 21. | ||||||
| 1929 (MPs) | 30 May 1929 | Ramsay MacDonald | Labour | −42 | 76.3 | The "flapper" election |
| 1931 (MPs) | 27 October 1931 | Ramsay MacDonald | National Labour (National Government) | 492 | 76.4 | |
| 1935 (MPs) | 14 November 1935 | Stanley Baldwin Neville Chamberlain Winston Churchill Winston Churchill |
Conservative (National Government) Conservative (National Government) Conservative (Wartime Coalition) Conservative (Caretaker Government) |
242 242 609 242 |
71.1 | |
| The election due by 1940 was not held due to World War II (1939–1945) | ||||||
| 1945 (MPs) | 5 July 1945 | Clement Attlee | Labour | 146 | 72.8 | 640 seats in Commons |
| At this point, the Representation of the People Act 1948 abolished plural voting, university constituencies and the few remaining two-member constituencies. | ||||||
| 1950 (MPs) | 23 February 1950 | Clement Attlee | Labour | 5 | 83.9 | 625 seats in Commons |
| 1951 (MPs) | 25 October 1951 | Sir Winston Churchill Sir Anthony Eden |
Conservative | 17 | 82.6 | |
| 1955 (MPs) | 26 May 1955 | Sir Anthony Eden Harold Macmillan |
Conservative | 60 | 76.8 | 630 seats in Commons |
| 1959 (MPs) | 8 October 1959 | Harold Macmillan Sir Alec Douglas-Home |
Conservative | 100 | 78.7 | |
| 1964 (MPs) | 15 October 1964 | Harold Wilson | Labour | 4 | 77.1 | |
| 1966 (MPs) | 31 March 1966 | Harold Wilson | Labour | 98 | 75.8 | |
| At this point, the Representation of the People Act 1969 gave suffrage to the adult population over 18 years old. | ||||||
| 1970 (MPs) | 18 June 1970 | Edward Heath | Conservative | 30 | 72 | |
| February 1974 (MPs) | 28 February 1974 | Harold Wilson | Labour (minority government) | −33 | 78.8 | Hung Parliament |
| October 1974 (MPs) | 10 October 1974 | Harold Wilson James Callaghan |
Labour | 3 | 72.8 | 635 seats in Commons |
| 1979 (MPs) | 3 May 1979 | Margaret Thatcher | Conservative | 43 | 76 | |
| 1983 (MPs) | 9 June 1983 | Margaret Thatcher | Conservative | 144 | 72.7 | 650 seats in Commons |
| 1987 (MPs) | 11 June 1987 | Margaret Thatcher John Major |
Conservative | 102 | 75.3 | |
| 1992 (MPs) | 9 April 1992 | John Major | Conservative | 21 | 77.7 | 651 seats in Commons |
| 1997 (MPs) | 1 May 1997 | Tony Blair | Labour | 179 | 71.4 | 659 seats in Commons |
| 2001 (MPs) | 7 June 2001 | Tony Blair | Labour | 167 | 59.4 | |
| 2005 (MPs) | 5 May 2005 | Tony Blair Gordon Brown |
Labour | 66 | 61.4 | 646 seats in Commons |
| 2010 (MPs) | 6 May 2010[31] | David Cameron | Conservative (formed coalition with Liberal Democrats) | 78 (combined coalition) | 65.1 | 650 seats in Commons Hung Parliament |
| At this point, the Fixed-term Parliaments Act 2011 was passed. Elections are now every 5 years, barring parliamentary vote. Before this, the election could be called at any point the Prime Minister wished. | ||||||
| 2015 (MPs) | 7 May 2015 | David Cameron Theresa May |
Conservative | 12 | 66.1 | 650 seats in Commons |
See also
- List of UK Conservative Party general election manifestos
- List of UK Labour Party general election manifestos
- List of UK Liberal Party general election manifestos
- United Kingdom general elections overview
- Referendums in the United Kingdom
References
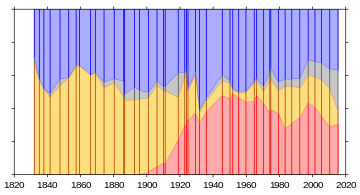
- ↑ Including |alt=A graph showing shares of the vote received by each political party in the UK since 1832. The graphs shows the UK being dominated by two political parties, a conservative party and a liberal party, until around 1900, when the Labour Party rises and takes a large share of votes away from the more liberal political party. Miscellaneous parties and independents represent an insignificant amount of vote share until around 1996.Tory (1832), Conservative (from 1835), Liberal Conservative (1847–59), Liberal Unionist (1886–1910), National parties (1931–45).
- ↑ Including Whig (to mid-19th century), Liberal (mid-19th century to 1979), National Liberal (1922), Independent Liberal (1931), SDP-Liberal Alliance (1983–87) and Liberal Democrat (from 1992).
- ↑ Table 2.01 "Summary Results of General Elections 1832–2005 (UK)", British electoral facts, 1832–2006, by Colin Rallings and Michael Thrasher, 7th edition, 2007, ISBN 978-0-7546-2712-8, p. 59.
- ↑ Election 2010 Results, BBC News.
- ↑ Rogers, Simon (16 November 2012). "UK election historic turnouts since 1918 | News". theguardian.com. Retrieved 2013-10-05.
- ↑ Died in office.
- ↑ Was murdered in office.
- ↑ Died in office.
- ↑ Was defeated on a motion to examine the accounts of the Civil List on 15 November 1830 and resigned on 16 November
- ↑ Was dismissed by William IV on 14 November 1834
- ↑ Was defeated on a report on the Irish Church on 7 April 1835 and resigned on 8 April
- ↑ Was defeated on a motion of no confidence on 4 June 1841 and advised the Queen to dissolve Parliament, which she did on 23 June
- ↑ Ministry met the Commons, but was defeated on an amendment to the Address on 27 August 1841 and resigned on 30 August
- ↑ Was defeated on an Irish Coercion Bill on 25 June 1846 and resigned on 29 June
- ↑ Was defeated on a militia Bill on 20 February 1852 and resigned on 23 February
- ↑ Was defeated on the Budget on 16 December 1852 and resigned on 19 December
- ↑ Was defeated on a vote in favour of a select committee to enquire into alleged mismanagement during the Crimean War on 29 January 1855 and resigned the next day
- ↑ Was defeated on a Bill, which made it a felony to plot in Britain to murder someone abroad, on 19 February 1858 and resigned on the same day
- ↑ Ministry met the Commons, but was defeated on an amendment to the Address on 10 June 1859 and resigned on 11 June
- ↑ Died in office
- ↑ Was defeated on Parliamentary reform proposals on 18 June 1866 and resigned on 26 June
- ↑ Was defeated on the Budget on 8 June 1885 and resigned the next day
- ↑ Met the Commons, but was defeated on an amendment to the Address on 26 January 1886 and resigned on 28 January
- ↑ Was defeated on the Government of Ireland Bill on 7 June 1886 and advised the Queen to dissolve Parliament, which she did on 26 June.
- ↑ Met the Commons, but was defeated on an amendment to the Address on 11 August 1892 and resigned the same day
- ↑ Was defeated on the Cordite Vote on 21 June 1895 and resigned that day
- ↑ Became Prime Minister on 25 June 1895 and immediately advised the dissolution of Parliament
- ↑ Became Prime Minister on 5 December 1905 and immediately advised the dissolution of Parliament
- ↑ Became Prime Minister on 23 October 1922 and immediately advised the dissolution of Parliament
- ↑ Met the Commons, but was defeated on an amendment to the Address on 21 January 1924 and resigned the next day
- ↑ "Gordon Brown calls 6 May general election". BBC News. 6 April 2010. Retrieved 6 April 2010.
| General elections |
|
|---|---|
| Local elections |
|
| European elections | |
| Referendums | |
| |