United States presidential election, 1944
| | |||||||||||||||||||||||||||||||||||||||||||
| |||||||||||||||||||||||||||||||||||||||||||
| |||||||||||||||||||||||||||||||||||||||||||
|
| |||||||||||||||||||||||||||||||||||||||||||
| Presidential election results map. Blue denotes those won by Roosevelt/Truman, red denotes states won by Dewey/Bricker. Numbers indicate the number of electoral votes allotted to each state. | |||||||||||||||||||||||||||||||||||||||||||
| |||||||||||||||||||||||||||||||||||||||||||
(small).jpg)

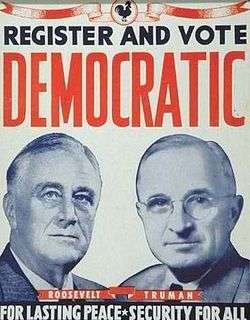
The United States presidential election of 1944 was the 40th quadrennial presidential election, held on Tuesday, November 7, 1944. Incumbent President Franklin D. Roosevelt, the Democratic nominee, sought his fourth term in office; he defeated Republican Thomas E. Dewey in the general election.
The election was set against the backdrop of World War II, which was going well for the United States and its Allies. Roosevelt had already served longer than any other president, but remained popular. Unlike in 1940, there was little doubt that he would run for another term as the Democratic candidate. Dewey, the Governor of New York, campaigned against the New Deal and for a smaller government, but was ultimately unsuccessful in convincing the country to change course. Rumors of Roosevelt's ill health, though somewhat dispelled by his vigorous campaigning, proved to be prescient; Roosevelt would die and be replaced by his new Vice President, Harry S. Truman, within a half-year of winning re-election.
Nominations
Democratic Party nomination
Democratic candidates:

President Roosevelt was the popular, wartime incumbent and faced little formal opposition. Although many Southern Democrats distrusted Roosevelt's racial policies, he brought enormous war activities to the region and the end of its marginal status was in sight. No major figure opposed Roosevelt publicly, and he was re-nominated easily when the Democratic Convention met in Chicago. Some pro-segregationist delegates tried to unite behind Virginia senator Harry F. Byrd, but he refused to actively campaign against Roosevelt, and did not get enough delegates to seriously threaten the President's chances.
The obvious physical decline in the president's appearance, as well as rumors of secret health problems, led many delegates and party leaders to oppose Vice President Henry A. Wallace strongly for a second term. Opposition to Wallace came especially from Catholic leaders in big cities and labor unions. Wallace, who was Roosevelt's vice president since January 1941, was regarded by most conservatives as being too left-wing and personally eccentric to be next in line for the presidency. He had performed so poorly as economic coordinator that Roosevelt had to remove him from that post. Numerous party leaders privately sent word to Roosevelt that they would fight Wallace's re-nomination as vice president and proposed instead Senator Harry S. Truman, a moderate from Missouri. Truman was highly visible as the chairman of a Senate wartime committee investigating fraud and inefficiency in the war program. Roosevelt, who personally liked Wallace and knew little about Truman, reluctantly agreed to accept Truman as his running mate to preserve party unity.[2] Even so, many delegates on the left refused to abandon Wallace, and they cast their votes for him on the first ballot. However, enough large Northern, Midwestern, and Southern states supported Truman to give him victory on the second ballot. The fight over the vice presidential nomination proved to be consequential; Roosevelt died in April 1945, and Truman became the nation's 33rd President instead of Wallace.[3]
Republican Party
-
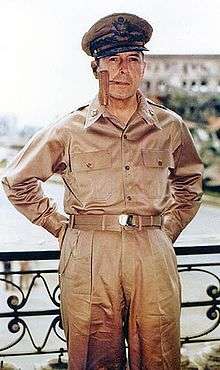
General Douglas MacArthur from New York
-
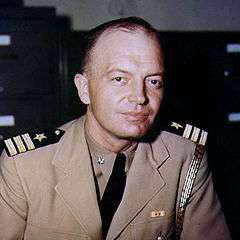
Former Governor Harold Stassen of Minnesota
-
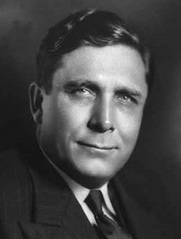
Businessman Wendell Willkie from New York
.jpg)
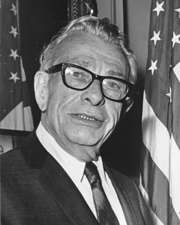
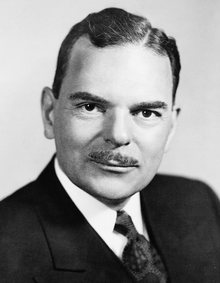
As 1944 began, the frontrunners for the Republican nomination appeared to be Wendell Willkie, the party's 1940 nominee, Senator Robert A. Taft from Ohio, the leader of the party's conservatives, New York Governor Thomas E. Dewey, the leader of the party's moderate eastern establishment, General Douglas MacArthur, then serving as an Allied commander in the Pacific theater of the war, and former Minnesota Governor Harold Stassen, then serving as a U.S. naval officer in the Pacific. Taft surprised many by announcing that he was not a candidate; instead, he voiced his support for a fellow conservative, Governor John W. Bricker of Ohio. With Taft out of the race some Republican conservatives favored General MacArthur. However, MacArthur's chances were limited by the fact that he was leading Allied forces against Japan, and thus could not campaign for the nomination. His supporters entered his name in the Wisconsin primary nonetheless. The Wisconsin primary proved to be the key contest, as Dewey won by a surprisingly wide margin. He took 14 delegates to four for Harold Stassen, while MacArthur won the three remaining delegates. Willkie was shut out in the Wisconsin primary; he did not win a single delegate. His unexpectedly poor showing in Wisconsin forced him to withdraw as a candidate for the nomination. However, at the time of his sudden death in early October 1944, Willkie had endorsed neither Dewey nor Roosevelt. At the 1944 Republican National Convention in Chicago, Illinois, Dewey easily overcame Bricker and was nominated for president on the first ballot. Dewey, a moderate to liberal Republican, chose the conservative Bricker as his running mate. Dewey originally preferred fellow liberal California Governor Earl Warren, but agreed on Bricker to preserve party unity (Warren became Dewey's vice presidential candidate in the election of 1948). Bricker was nominated for vice president by acclamation.
General election
The fall campaign

The Republicans campaigned against the New Deal, seeking a smaller government and less-regulated economy as the end of the war seemed in sight. Nonetheless, Roosevelt's continuing popularity was the main theme of the campaign. To quiet rumors of his poor health, Roosevelt insisted on making a vigorous campaign swing in October and rode in an open car through city streets. A high point of the campaign occurred when Roosevelt, speaking to a meeting of labor union leaders, gave a speech carried on national radio in which he ridiculed Republican claims that his administration was corrupt and wasteful with tax money. He particularly ridiculed a Republican claim that he had sent a US Navy warship to pick up his Scottish Terrier Fala in Alaska, noting that "Fala was furious" at such rumors. The speech was met with loud laughter and applause from the labor leaders. In response, Dewey gave a blistering partisan speech in Oklahoma City, Oklahoma, a few days later on national radio, in which he accused Roosevelt of being "indispensable" to corrupt big-city Democratic organizations and American Communists; he also referred to members of Roosevelt's cabinet as a "motley crew". However, American battlefield successes in Europe and the Pacific during the campaign, such as the liberation of Paris in August 1944 and the successful Battle of Leyte Gulf in the Philippines in October 1944, made Roosevelt unbeatable.
Results
Throughout the campaign, Roosevelt led Dewey in all the polls by varying margins. On election day, the Democratic incumbent scored a fairly comfortable victory over his Republican challenger. Roosevelt took 36 states for 432 electoral votes, while Dewey won 12 states and 99 electoral votes (266 were needed to win). In the popular vote Roosevelt won 25,612,916 (53.4%) votes to Dewey's 22,017,929 (45.9%).
The important question had been which leader, Roosevelt or Dewey, should be chosen for the critical days of peacemaking and reconstruction following the war's conclusion. A majority of the American people concluded that they should not change from one party, and particularly from one leader. They also felt that in view of ever-increasing domestic disagreements it was not safe to do so in "wartime".
However, Roosevelt's percentage of the total vote was less than in 1940, and his margin of the total vote was less. Dewey did better against Roosevelt than any of Roosevelt's previous three Republican opponents, and he did have the personal satisfaction of finishing ahead of Roosevelt in his hometown of Hyde Park, New York, and of finishing ahead of Truman in his hometown of Independence, Missouri. Dewey would again be the Republican presidential nominee in 1948 and would again lose, though by a slightly smaller margin.
Of the 3,095 counties/independent cities making returns, Roosevelt won in 1,751 (56.58%) while Dewey carried 1,343 (43.39%). The Texas Regular ticket carried one county (0.03%).
In New York, only the combined support of the American Labor and Liberal parties (pledged to Roosevelt but otherwise independent of the Democrats so as to keep separate their identity) enabled Roosevelt to win the electoral votes of his home state.
In 1944, the constantly growing Southern protest against Roosevelt's leadership became clearest in Texas, where 135,553 votes were cast against Roosevelt but not for the Republican ticket. The Texas Regular ticket resulted from a split in the Democratic party in its two state conventions, May 23 and September 12, 1944. This ticket represented the Democratic element opposing the re-election of President Roosevelt. Its Electors were uninstructed.
As he had in 1940, Roosevelt won re-election with a lower percentage of both the electoral vote and the popular vote than he had received in the prior elections—the second of only three presidents in US history to do so, preceded by James Madison in 1812 and followed by Barack Obama in 2012. Andrew Jackson in 1832 and Grover Cleveland in 1892 had received more electoral votes but fewer popular votes, while Woodrow Wilson in 1916 had received more popular votes but fewer electoral votes.
| Presidential candidate | Party | Home state | Popular vote | Electoral vote |
Running mate | |||
|---|---|---|---|---|---|---|---|---|
| Count | Pct | Vice-presidential candidate | Home state | Elect. vote | ||||
| Franklin D. Roosevelt (Incumbent) | Democratic | New York | 25,612,916 | 53.39% | 432 | Harry S. Truman | Missouri | 432 |
| Thomas E. Dewey | Republican | New York | 22,017,929 | 45.89% | 99 | John W. Bricker | Ohio | 99 |
| (none) | Texas Regulars | (n/a) | 143,238 | 0.30% | 0 | (none) | (n/a) | 0 |
| Norman Thomas | Socialist | New York | 79,017 | 0.16% | 0 | Darlington Hoopes | Pennsylvania | 0 |
| Claude A. Watson | Prohibition | California | 74,758 | 0.16% | 0 | Andrew N. Johnson | Kentucky | 0 |
| Edward A. Teichert | Socialist Labor | Pennsylvania | 45,188 | 0.09% | 0 | Arla Arbaugh | Ohio | 0 |
| Other | 11,816 | 0.02% | — | Other | — | |||
| Total | 47,977,063 | 100% | 531 | 531 | ||||
| Needed to win | 266 | 266 | ||||||
Source (Popular Vote): Leip, David. "1944 Presidential Election Results". Dave Leip's Atlas of U.S. Presidential Elections. Retrieved August 1, 2005.Source (Electoral Vote): "Electoral College Box Scores 1789–1996". National Archives and Records Administration. Retrieved August 1, 2005.
Geography of results

-

Results by county, shaded according to winning candidate's percentage of the vote
Cartographic gallery
-
Presidential election results by county.
-

Democratic presidential election results by county.
-

Republican presidential election results by county.
-

"Other" presidential election results by county.
Results by state
| States won by Roosevelt/Truman |
| States won by Dewey/Bricker |
| Franklin D. Roosevelt Democratic |
Thomas E. Dewey Republican |
No Candidate Southern Democrat/ Texas Regulars |
Norman Thomas Socialist |
Other | Margin | State total | ||||||||||||||
|---|---|---|---|---|---|---|---|---|---|---|---|---|---|---|---|---|---|---|---|---|
| State | electoral votes |
# | % | electoral votes |
# | % | electoral votes |
# | % | electoral votes |
# | % | electoral votes |
# | % | electoral votes |
# | % | # | |
| Alabama | 11 | 198,918 | 81.28 | 11 | 44,540 | 18.20 | - | - | - | - | 190 | 0.08 | - | 1,095 | 0.45 | - | 154,378 | 63.08 | 244,743 | AL |
| Arizona | 4 | 80,926 | 58.80 | 4 | 56,287 | 40.90 | - | - | - | - | - | - | - | 421 | 0.31 | - | 24,639 | 17.90 | 137,634 | AZ |
| Arkansas | 9 | 148,965 | 69.95 | 9 | 63,551 | 29.84 | - | - | - | - | 438 | 0.21 | - | - | - | - | 85,414 | 40.11 | 212,954 | AR |
| California | 25 | 1,988,564 | 56.48 | 25 | 1,512,965 | 42.97 | - | - | - | - | 2,515 | 0.07 | - | 16,831 | 0.48 | - | 475,599 | 13.51 | 3,520,875 | CA |
| Colorado | 6 | 234,331 | 46.40 | - | 268,731 | 53.21 | 6 | - | - | - | 1,977 | 0.39 | - | - | - | - | -34,400 | -6.81 | 505,039 | CO |
| Connecticut | 8 | 435,146 | 52.30 | 8 | 390,527 | 46.94 | - | - | - | - | 5,097 | 0.61 | - | 1,220 | 0.15 | - | 44,619 | 5.36 | 831,990 | CT |
| Delaware | 3 | 68,166 | 54.38 | 3 | 56,747 | 45.27 | - | - | - | - | 154 | 0.12 | - | 294 | 0.23 | - | 11,419 | 9.11 | 125,361 | DE |
| Florida | 8 | 339,377 | 70.32 | 8 | 143,215 | 29.68 | - | - | - | - | - | - | - | - | - | - | 196,162 | 40.65 | 482,592 | FL |
| Georgia | 12 | 268,187 | 81.74 | 12 | 59,880 | 18.25 | - | - | - | - | 6 | 0.00 | - | 36 | 0.01 | - | 208,307 | 63.49 | 328,109 | GA |
| Idaho | 4 | 107,399 | 51.55 | 4 | 100,137 | 48.07 | - | - | - | - | 282 | 0.14 | - | 503 | 0.24 | - | 7,262 | 3.49 | 208,321 | ID |
| Illinois | 28 | 2,079,479 | 51.52 | 28 | 1,939,314 | 48.05 | - | - | - | - | 180 | 0.00 | - | 17,088 | 0.42 | - | 140,165 | 3.47 | 4,036,061 | IL |
| Indiana | 13 | 781,403 | 46.73 | - | 875,891 | 52.38 | 13 | - | - | - | 2,223 | 0.13 | - | 12,574 | 0.75 | - | -94,488 | -5.65 | 1,672,091 | IN |
| Iowa | 10 | 499,876 | 47.49 | - | 547,267 | 51.99 | 10 | - | - | - | 1,511 | 0.14 | - | 3,945 | 0.37 | - | -47,391 | -4.50 | 1,052,599 | IA |
| Kansas | 8 | 287,458 | 39.18 | - | 442,096 | 60.25 | 8 | - | - | - | 1,613 | 0.22 | - | 2,609 | 0.36 | - | -154,638 | -21.07 | 733,776 | KS |
| Kentucky | 11 | 472,589 | 54.45 | 11 | 392,448 | 45.22 | - | - | - | - | 535 | 0.06 | - | 2,349 | 0.27 | - | 80,141 | 9.23 | 867,921 | KY |
| Louisiana | 10 | 281,564 | 80.59 | 10 | 67,750 | 19.39 | - | - | - | - | - | - | - | 69 | 0.02 | - | 213,814 | 61.20 | 349,383 | LA |
| Maine | 5 | 140,631 | 47.45 | - | 155,434 | 52.44 | 5 | - | - | - | - | - | - | 335 | 0.11 | - | -14,803 | -4.99 | 296,400 | ME |
| Maryland | 8 | 315,490 | 51.85 | 8 | 292,949 | 48.15 | - | - | - | - | - | - | - | - | - | - | 22,541 | 3.70 | 608,439 | MD |
| Massachusetts | 16 | 1,035,296 | 52.80 | 16 | 921,350 | 46.99 | - | - | - | - | - | - | - | 4,019 | 0.21 | - | 113,946 | 5.81 | 1,960,665 | MA |
| Michigan | 19 | 1,106,899 | 50.19 | 19 | 1,084,423 | 49.18 | - | - | - | - | 4,598 | 0.21 | - | 9,303 | 0.42 | - | 22,476 | 1.02 | 2,205,223 | MI |
| Minnesota | 11 | 589,864 | 52.41 | 11 | 527,416 | 46.86 | - | - | - | - | 5,073 | 0.45 | - | 3,176 | 0.28 | - | 62,448 | 5.55 | 1,125,529 | MN |
| Mississippi | 9 | 168,479 | 93.56 | 9 | 11,601 | 6.44 | - | - | - | - | - | - | - | - | - | - | 156,878 | 87.12 | 180,080 | MS |
| Missouri | 15 | 807,804 | 51.37 | 15 | 761,524 | 48.43 | - | - | - | - | 1,751 | 0.11 | - | 1,395 | 0.09 | - | 46,280 | 2.94 | 1,572,474 | MO |
| Montana | 4 | 112,556 | 54.28 | 4 | 93,163 | 44.93 | - | - | - | - | 1,296 | 0.63 | - | 340 | 0.16 | - | 19,393 | 9.35 | 207,355 | MT |
| Nebraska | 6 | 233,246 | 41.42 | - | 329,880 | 58.58 | 6 | - | - | - | - | - | - | - | - | - | -96,634 | -17.16 | 563,126 | NE |
| Nevada | 3 | 29,623 | 54.62 | 3 | 24,611 | 45.38 | - | - | - | - | - | - | - | - | - | - | 5,012 | 9.24 | 54,234 | NV |
| New Hampshire | 4 | 119,663 | 52.11 | 4 | 109,916 | 47.87 | - | - | - | - | 46 | 0.02 | - | - | - | - | 9,747 | 4.24 | 229,625 | NH |
| New Jersey | 16 | 987,874 | 50.31 | 16 | 961,335 | 48.95 | - | - | - | - | 3,358 | 0.17 | - | 11,194 | 0.57 | - | 26,539 | 1.35 | 1,963,761 | NJ |
| New Mexico | 4 | 81,389 | 53.47 | 4 | 70,688 | 46.44 | - | - | - | - | - | - | - | 148 | 0.10 | - | 10,701 | 7.03 | 152,225 | NM |
| New York | 47 | 3,304,238 | 52.31 | 47 | 2,987,647 | 47.30 | - | - | - | - | 10,553 | 0.17 | - | 14,352 | 0.23 | - | 316,591 | 5.01 | 6,316,790 | NY |
| North Carolina | 14 | 527,399 | 66.71 | 14 | 263,155 | 33.29 | - | - | - | - | - | - | - | - | - | - | 264,244 | 33.43 | 790,554 | NC |
| North Dakota | 4 | 100,144 | 45.48 | - | 118,535 | 53.84 | 4 | - | - | - | 943 | 0.43 | - | 549 | 0.25 | - | -18,391 | -8.35 | 220,171 | ND |
| Ohio | 25 | 1,570,763 | 49.82 | - | 1,582,293 | 50.18 | 25 | - | - | - | - | - | - | - | - | - | -11,530 | -0.37 | 3,153,056 | OH |
| Oklahoma | 10 | 401,549 | 55.57 | 10 | 319,424 | 44.20 | - | - | - | - | - | - | - | 1,663 | 0.23 | - | 82,125 | 11.36 | 722,636 | OK |
| Oregon | 6 | 248,635 | 51.78 | 6 | 225,365 | 46.94 | - | - | - | - | 3,785 | 0.79 | - | 2,362 | 0.49 | - | 23,270 | 4.85 | 480,147 | OR |
| Pennsylvania | 35 | 1,940,479 | 51.14 | 35 | 1,835,054 | 48.36 | - | - | - | - | 11,721 | 0.31 | - | 7,539 | 0.20 | - | 105,425 | 2.78 | 3,794,793 | PA |
| Rhode Island | 4 | 175,356 | 58.59 | 4 | 123,487 | 41.26 | - | - | - | - | - | - | - | 433 | 0.14 | - | 51,869 | 17.33 | 299,276 | RI |
| South Carolina | 8 | 90,601 | 87.64 | 8 | 4,610 | 4.46 | - | 7,799 | 7.54 | - | - | - | - | 365 | 0.35 | - | 82,802 | 80.10 | 103,375 | SC |
| South Dakota | 4 | 96,711 | 41.67 | - | 135,365 | 58.33 | 4 | - | - | - | - | - | - | - | - | - | -38,654 | -16.66 | 232,076 | SD |
| Tennessee | 12 | 308,707 | 60.45 | 12 | 200,311 | 39.22 | - | - | - | - | 792 | 0.16 | - | 882 | 0.17 | - | 108,396 | 21.23 | 510,692 | TN |
| Texas | 23 | 821,605 | 71.42 | 23 | 191,425 | 16.64 | - | 135,439 | 11.77 | - | 594 | 0.05 | - | 1,268 | 0.11 | - | 630,180 | 54.78 | 1,150,331 | TX |
| Utah | 4 | 150,088 | 60.44 | 4 | 97,891 | 39.42 | - | - | - | - | 340 | 0.14 | - | - | - | - | 52,197 | 21.02 | 248,319 | UT |
| Vermont | 3 | 53,820 | 42.93 | - | 71,527 | 57.06 | 3 | - | - | - | - | - | - | 14 | 0.01 | - | -17,707 | -14.12 | 125,361 | VT |
| Virginia | 11 | 242,276 | 62.36 | 11 | 145,243 | 37.39 | - | - | - | - | 417 | 0.11 | - | 549 | 0.14 | - | 97,033 | 24.98 | 388,485 | VA |
| Washington | 8 | 486,774 | 56.84 | 8 | 361,689 | 42.24 | - | - | - | - | 3,824 | 0.45 | - | 4,041 | 0.47 | - | 125,085 | 14.61 | 856,328 | WA |
| West Virginia | 8 | 392,777 | 54.89 | 8 | 322,819 | 45.11 | - | - | - | - | - | - | - | - | - | - | 69,958 | 9.78 | 715,596 | WV |
| Wisconsin | 12 | 650,413 | 48.57 | - | 674,532 | 50.37 | 12 | - | - | - | 13,205 | 0.99 | - | 1,002 | 0.07 | - | -24,119 | -1.80 | 1,339,152 | WI |
| Wyoming | 3 | 49,419 | 48.77 | - | 51,921 | 51.23 | 3 | - | - | - | - | - | - | - | - | - | -2,502 | -2.47 | 101,340 | WY |
| Totals: | 531 | 25,612,916 | 53.39 | 432 | 22,017,929 | 45.89 | 99 | 143,238 | 0.30 | - | 79,017 | 0.16 | - | 123,963 | 0.26 | - | 3,594,987 | 7.49 | 47,977,063 | US |
Close states
Margin of victory less than 5% (190 electoral votes):
- Ohio, 0.37%
- Michigan, 1.02%
- New Jersey, 1.35%
- Wisconsin, 1.80%
- Wyoming, 2.47%
- Pennsylvania, 2.78%
- Missouri, 2.94%
- Illinois, 3.47%
- Idaho, 3.49%
- Maryland, 3.70%
- New Hampshire, 4.24%
- Iowa, 4.50%
- Oregon, 4.85%
- Maine, 4.99%
Margin of victory between 5% and 10% (138 electoral votes):
- New York, 5.01%
- Connecticut, 5.36%
- Minnesota, 5.55%
- Indiana, 5.65%
- Massachusetts, 5.81%
- Colorado, 6.81%
- New Mexico, 7.03%
- North Dakota, 8.35%
- Delaware, 9.11%
- Kentucky, 9.23%
- Nevada, 9.24%
- Montana, 9.35%
- West Virginia, 9.78%
Miscellanea
- The 1944 election was the first since Grover Cleveland's re-election in 1892 in which the bellwether state of Ohio backed a losing candidate.
- The 1944 election was the last election in which any candidate received over 90% of the vote in any state (FDR won 94% of votes cast in Mississippi).
- The passing of the 22nd Amendment of the United States Constitution in 1951 renders this election the only occasion in United States history in which a candidate has been allowed to run for a fourth term as president.
- This was the first election since 1900 when Idaho and Wyoming did not vote the same as each other, and the last to date.
- Had Dewey won the 1944 election, he would have become the youngest president in U.S. history, being 20 days younger (as of January 20, 1945) than Theodore Roosevelt, when he took office in 1901 upon the assassination of William McKinley.
- The 1944 presidential election was the last election in which the Democratic party candidate won every single state that constituted the Confederacy.
- The 1944 election was the first one where one of the candidates (Dewey) was born in the 20th century.
- Except Lyndon B. Johnson's landslide reelection in 1964, no post-1944 Democratic candidate has managed to equal or surpass Roosevelt's margin in popular or electoral votes in this election, which was the closest of all his four campaigns.
- 1944 was, until 2016, the most recent election in which both major party candidates hailed from the same state, as Roosevelt and Dewey were from New York. The 2016 presidential election has now taken that honor as both major candidates in that election, Hillary Clinton and Donald Trump, coincidentally, also identified New York as their home state.
See also
- President of the United States
- United States Senate elections, 1944
- United States home front during World War II
- Hell-Bent for Election, an animated Roosevelt campaign film.
- Fourth inauguration of Franklin D. Roosevelt
References
- ↑ "Voter Turnout in Presidential Elections". The American Presidency Project. UC Santa Barbara.
- ↑ Alonzo L. Hamby, Man of the People: A Life of Harry S. Truman (1995) ch 17
- ↑ Stanley Weintraub, Final Victory: FDR's Extraordinary World War II Presidential Campaign (2012) ch 2
- ↑ "1944 Presidential General Election Data - National". Retrieved April 14, 2013.
Further reading
- Cantril, Hadley and Mildred Strunk, eds.; Public Opinion, 1935–1946 (1951), massive compilation of many public opinion polls from USA
- Gallup, George Horace, ed. The Gallup Poll; Public Opinion, 1935–1971 3 vol (1972) esp vol 1; summarizes results of each poll as reported to newspapers
- Hamby, Alonzo L. Man of the People: A Life of Harry S. Truman (1995) ch 17
- Jordan, David M. FDR, Dewey, and the Election of 1944 (Indiana U.P. 2011)
- Savage, Sean J. "The 1936-1944 Campaigns," in William D. Pederson, ed. A Companion to Franklin D. Roosevelt (2011) pp 96–113 online
- Smith, Richard Norton. Thomas E. Dewey and His Times (1984), the standard scholarly biography
- Weintraub, Stanley. Final Victory: FDR's Extraordinary World War II Presidential Campaign. (Cambridge: Da Capo, 2012). 318 pp.
External links
- Tuesday In November: The 1944 Presidential Election
- 1944 popular vote by counties
- How close was the 1944 election? — Michael Sheppard, Massachusetts Institute of Technology
- Election of 1944 in Counting the Votes