Trophic level
The trophic level of an organism is the position it occupies in a food chain. The word trophic derives from the Greek τροφή (trophē) referring to food or feeding. A food chain represents a succession of organisms that eat another organism and are, in turn, eaten themselves. The number of steps an organism is from the start of the chain is a measure of its trophic level. Food chains start at trophic level 1 with primary producers such as plants, move to herbivores at level 2, predators at level 3 and typically finish with carnivores or apex predators at level 4 or 5. The path along the chain can form either a one-way flow or a food "web". Ecological communities with higher biodiversity form more complex trophic paths.
Overview
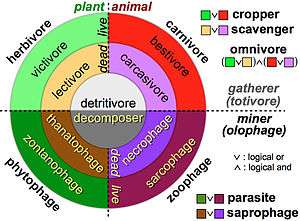
The three basic ways in which organisms get food are as producers, consumers and decomposers.
- Producers (autotrophs) are typically plants or algae. Plants and algae do not usually eat other organisms, but pull nutrients from the soil or the ocean and manufacture their own food using photosynthesis. For this reason, they are called primary producers. In this way, it is energy from the sun that usually powers the base of the food chain.[1] An exception occurs in deep-sea hydrothermal ecosystems, where there is no sunlight. Here primary producers manufacture food through a process called chemosynthesis.[2]
- Consumers (heterotrophs) are species that cannot manufacture their own food and need to consume other organisms. Animals that eat primary producers (like plants) are called herbivores. Animals that eat other animals are called carnivores, and animals that eat both plant and other animals are called omnivores.
- Decomposers (detritivores) break down dead plant and animal material and wastes and release it again as energy and nutrients into the ecosystem for recycling. Decomposers, such as bacteria and fungi (mushrooms), feed on waste and dead matter, converting it into inorganic chemicals that can be recycled as mineral nutrients for plants to use again.
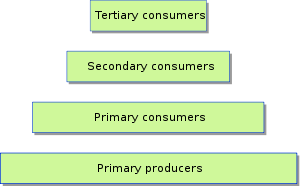
Trophic levels can be represented by numbers, starting at level 1 with plants. Further trophic levels are numbered subsequently according to how far the organism is along the food chain.
- Level 1: Plants and algae make their own food and are called primary producers.
- Level 2: Herbivores eat plants and are called primary consumers.
- Level 3: Carnivores that eat herbivores are called secondary consumers.
- Level 4: Carnivores that eat other carnivores are called tertiary consumers.
- Level 5: Apex predators that have no predators are at the top of the food chain.
-

Second trophic level
Rabbits eat plants at the first trophic level, so they are primary consumers. -
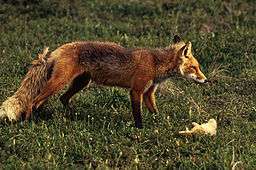
Third trophic level
Foxes eat rabbits at the second trophic level, so they are secondary consumers. -
.jpg)
Fourth trophic level
Golden eagles eat foxes at the third trophic level, so they are tertiary consumers. -

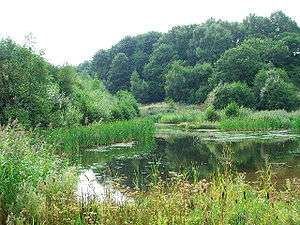
Decomposers
The fungi on this tree feed on dead matter, converting it back to nutrients that primary producers can use.
In real world ecosystems, there is more than one food chain for most organisms, since most organisms eat more than one kind of food or are eaten by more than one type of predator. A diagram that sets out the intricate network of intersecting and overlapping food chains for an ecosystem is called its food web.[3] Decomposers are often left off food webs, but if included, they mark the end of a food chain.[3] Thus food chains start with primary producers and end with decay and decomposers. Since decomposers recycle nutrients, leaving them so they can be reused by primary producers, they are sometimes regarded as occupying their own trophic level.[4][5]
Biomass transfer efficiency
In general, each trophic level relates to the one below it by absorbing some of the energy it consumes, and in this way can be regarded as resting on, or supported by, the next lower trophic level. Food chains can be diagrammed to illustrate the amount of energy that moves from one feeding level to the next in a food chain. This is called an energy pyramid. The energy transferred between levels can also be thought of as approximating to a transfer in biomass, so energy pyramids can also be viewed as biomass pyramids, picturing the amount of biomass that results at higher levels from biomass consumed at lower levels.
The efficiency with which energy or biomass is transferred from one trophic level to the next is called the ecological efficiency. Consumers at each level convert on average only about 10% of the chemical energy in their food to their own organic tissue (the ten-percent law). For this reason, food chains rarely extend for more than 5 or 6 levels. At the lowest trophic level (the bottom of the food chain), plants convert about 1% of the sunlight they receive into chemical energy. It follows from this that the total energy originally present in the incident sunlight that is finally embodied in a tertiary consumer is about 0.001%[4]
Evolution of trophic levels
Both the number of trophic levels and the complexity of relationships between them evolve as life diversifies through time, the exception being intermittent mass extinction events.[6]
Fractional trophic levels
Food webs largely define ecosystems, and the trophic levels define the position of organisms within the webs. But these trophic levels are not always simple integers, because organisms often feed at more than one trophic level.[7][8] For example, some carnivores also eat plants, and some plants are carnivores. A large carnivore may eat both smaller carnivores and herbivores; the bobcat eats rabbits, but the mountain lion eats both bobcats and rabbits. Animals can also eat each other; the bullfrog eats crayfish and crayfish eat young bullfrogs. The feeding habits of a juvenile animal, and, as a consequence, its trophic level, can change as it grows up.
The fisheries scientist Daniel Pauly sets the values of trophic levels to one in plants and detritus, two in herbivores and detritivores (primary consumers), three in secondary consumers, and so on. The definition of the trophic level, TL, for any consumer species is:[5]

where is the fractional trophic level of the prey j, and represents the fraction of j in the diet of i.


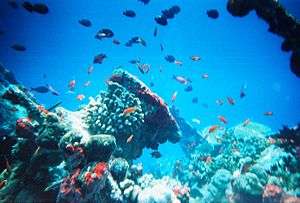
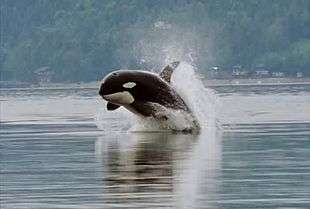
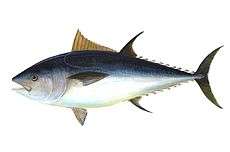
In the case of marine ecosystems, the trophic level of most fish and other marine consumers takes value between 2.0 and 5.0. The upper value, 5.0, is unusual, even for large fish,[9] though it occurs in apex predators of marine mammals, such as polar bears and killer whales.[10]
In addition to observational studies of animal behavior, and quantification of animal stomach contents, trophic level can be quantified through stable isotope analysis of animal tissues such as muscle, skin, hair, bone collagen. This is because there is a consistent increase in the nitrogen isotopic composition at each trophic level caused by fractionations that occur with the synthesis of biomolecules; the magnitude of this increase in nitrogen isotopic composition is approximately 3–4‰.[11]
Mean trophic level
In fisheries, the mean trophic level for the fisheries catch across an entire area or ecosystem is calculated for year y as:

where is the catch of the species or group i in year y, and is the trophic level for species i as defined above.[5]


Fish at higher trophic levels usually have a higher economic value, which can result in overfishing at the higher trophic levels. Earlier reports found precipitous declines in mean trophic level of fisheries catch, in a process known as fishing down the food web.[12] However, more recent work finds no relation between economic value and trophic level;[13] and that mean trophic levels in catches, surveys and stock assessments have not in fact declined, suggesting that fishing down the food web is not a global phenomenon.[14] However Pauly et al. note that trophic levels peaked at 3.4 in 1970 in the northwest and west-central Atlantic, followed by a subsequent decline to 2.9 in 1994. They report a shift away from long-lived, piscivorous, high-trophic-level bottom fishes, such as cod and haddock, to short-lived, planktivorous, low-trophic-level invertebrates (e.g., shrimps) and small, pelagic fish (e.g., herrings). This shift from high-trophic-level fishes to low-trophic-level invertebrates and fishes is a response to changes in the relative abundance of the preferred catch. They argue this is part of the global fishery collapse.[10][15]
FiB index
Since biomass transfer efficiencies are only about 10%, it follows that the rate of biological production is much greater at lower trophic levels than it is at higher levels. Fisheries catches, at least to begin with, will tend to increase as the trophic level declines. At this point the fisheries will target species lower in the food web.[15] In 2000, this led Pauly and others to construct a "Fisheries in Balance" index, usually called the FiB index.[16] The FiB index is defined, for any year y, by[5]

where is the catch at year y, is the mean trophic level of the catch at year y, is the catch, the mean trophic level of the catch at the start of the series being analyzed, and is the transfer efficiency of biomass or energy between trophic levels.


The FiB index is stable (zero) over periods of time when changes in trophic levels are matched by appropriate changes in the catch in the opposite direction. The index increases if catches increase for any reason, e.g. higher fish biomass, or geographic expansion.[5] Such decreases explain the “backward-bending” plots of trophic level versus catch originally observed by Pauly and others in 1998.[15]
Tritrophic and other interactions
One aspect of trophic levels is called tritrophic interaction. Ecologists often restrict their research to two trophic levels as a way of simplifying the analysis; however, this can be misleading if tritrophic interactions (such as plant–herbivore–predator) are not easily understood by simply adding pairwise interactions (plant–herbivore plus herbivore–predator, for example). Significant interactions can occur between the first trophic level (plant) and the third trophic level (a predator) in determining herbivore population growth, for example. Simple genetic changes may yield morphological variants in plants that then differ in their resistance to herbivores because of the effects of the plant architecture on enemies of the herbivore.[17]
Examples
Depending on the nature of the species the precise trophic level of the species may be somewhat ambiguous and its precise value may vary depending on the source. Virtually all plants as well as phytoplankton and similar organisms are classified at level 1.0. Most worms would be typically classified at level 2.1; a typical insect 2.2; a jellyfish 3.0; a typical bird 3.6; a typical small mammal 4.1.[18]
A 2013 study published in the National Academy of Sciences estimates the average trophic level of human beings at 2.21, similar to pigs or anchovy.[19] Of course this is only an average, and plainly both modern and ancient human eating habits are complex and vary greatly. For example, a traditional Eskimo living on a diet consisting primarily of seals would have a trophic level of nearly 5.[20]
See also
- Cascade effect
- Energy flow (ecology)
- Mesopredator release hypothesis
- Trophic cascade
- Trophic state index – applied to lakes
- Trophic dynamics – Food web
References
- ↑ Science of Earth Systems. Cengage Learning. 2002. ISBN 978-0-7668-3391-3.
- ↑ The Ecology of Deep-sea Hydrothermal Vents. Princeton University Press. 2000. ISBN 978-0-691-04929-8.
- 1 2 Lisowski M, Miaoulis I, Cyr M, Jones LC, Padilla MJ, Wellnitz TR (2004) Prentice Hall Science Explorer: Environmental Science, Pearson Prentice Hall. ISBN 978-0-13-115090-4
- 1 2 American Heritage Science Dictionary, 2005. Houghton Mifflin Company.
- 1 2 3 4 5 Pauly, D.; Palomares, M.L. (2005). "Fishing down marine food webs: it is far more pervasive than we thought" (PDF). Bulletin of Marine Science. 76 (2): 197–211.
- ↑ Sahney, S. & Benton, M.J. (2008). "Recovery from the most profound mass extinction of all time" (PDF). Proceedings of the Royal Society: Biological. 275 (1636): 759–65. doi:10.1098/rspb.2007.1370. PMC 2596898
 . PMID 18198148.
 - ↑ Odum WE and Heald EJ (1975) "The detritus-based food web of an estuarine mangrove community". Pages 265–286 in L. E. Cronin, ed. Estuarine research. Vol. 1. Academic Press, New York.
- ↑ Pimm, SL; Lawton, JH (1978). "On feeding on more than one trophic level". Nature. 275 (5680): 542–544. doi:10.1038/275542a0.
- ↑ Cortés, E (1999). "Standardized diet compositions and trophic levels of sharks". ICES J. Mar. Sci. 56 (5): 707–717. doi:10.1006/jmsc.1999.0489.
- 1 2 Pauly, D; Trites, A; Capuli, E; Christensen, V (1998). "Diet composition and trophic levels of marine mammals". ICES J. Mar. Sci. 55 (3): 467–481. doi:10.1006/jmsc.1997.0280.
- ↑ Szpak, Paul; Orchard, Trevor J.; McKechnie, Iain; Gröcke, Darren R. (2012). "Historical Ecology of Late Holocene Sea Otters (Enhydra lutris) from Northern British Columbia: Isotopic and Zooarchaeological Perspectives". Journal of Archaeological Science. 39 (5): 1553–1571. doi:10.1016/j.jas.2011.12.006.
- ↑ Millennium Ecosystem Assessment (2005) Ecosystems and Human Well-being: Synthesis Island Press. pp. 32–33.
- ↑ Sethi, SA; Branch, TA; Watson, R (2010). "Global fishery development patterns are driven by profit but not trophic level". Proceedings of the National Academy of Sciences. 107 (27): 12163–12167. doi:10.1073/pnas.1003236107.
- ↑ Branch, TA; Watson, Reg; Fulton, Elizabeth A.; Jennings, Simon; McGilliard, Carey R.; Pablico, Grace T.; Ricard, Daniel; Tracey, Sean R. (2010). "Trophic fingerprint of marine fisheries" (PDF). Nature. 468 (7322): 431–435. doi:10.1038/nature09528. PMID 21085178.
- 1 2 3 Pauly, D; Christensen v, V; Dalsgaard, J; Froese, R; Torres Jr, FC Jr (1998). "Fishing down marine food webs". Science. 279 (5352): 860–863. doi:10.1126/science.279.5352.860. PMID 9452385.
- ↑ Pauly, D; Christensen, V; Walters, C (2000). "Ecopath, Ecosim and Ecospace as tools for evaluating ecosystem impact of fisheries". ICES J. Mar. Sci. 57 (3): 697–706. doi:10.1006/jmsc.2000.0726.
- ↑ Kareiva, Peter; Sahakian, Robert (1990). "Letters to Nature:Tritrophic effects of a simple architectural mutation in pea plants". Nature. 35 (6274): 433–434. doi:10.1038/345433a0.
- ↑ "Fish On Line". FishBase.
|chapter=ignored (help) - ↑ Yirka, Bob (December 3, 2013). "Researchers calculate human trophic level for first time". Proceedings of the National Academy of Sciences.
- ↑ Campbell, Bernard Grant (1995-01-01). Human Ecology: The Story of Our Place in Nature from Prehistory to the Present. p. 12. ISBN 9780202366609.
External links
- Trophic levels BBC. Last updated March 2004.