Total cost
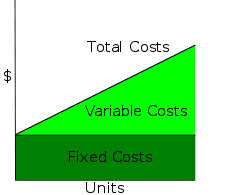

In economics and cost accounting, total cost (TC) describes the total economic cost of production and is made up of variable costs, which vary according to the quantity of a good produced and include inputs such as labor and raw materials, plus fixed costs, which are independent of the quantity of a good produced and include inputs (capital) that cannot be varied in the short term, such as buildings and machinery.
Total cost in economics includes the total opportunity cost of each factor of production as part of its fixed or variable costs.
The rate at which total cost changes as the amount produced changes is called marginal cost. This is also known as the marginal unit variable cost.
If one assumes that the unit variable cost is constant, as in cost-volume-profit analysis developed and used in cost accounting by the accountants, then total cost is linear in volume, and given by: total cost = fixed costs + unit variable cost * amount.
The total cost of producing a specific level of output is the cost of all the factors of input used. Conventionally, economists use models with two inputs: capital, K; and labor, L. Capital is assumed to be the fixed input, meaning that the amount of capital used does not vary with the level of production. The rental price per unit of capital is denoted r. Thus, the total fixed costs equal Kr. Labor is the variable input, meaning that the amount of labor used varies with the level of output. In fact, in the short run, the only way to vary output is by varying the amount of the variable input. Labor is denoted L and the per unit cost, or wage rate, is denoted w, so the total variable costs is Lw. Consequently, total cost is fixed costs (FC) plus variable cost (VC), or TC = FC + VC = Kr +wL.
Other economic models have the total variable cost curve (and therefore total cost curve) illustrate the concepts of increasing, and later diminishing, marginal returns.
In marketing, it is necessary to know how total costs divide between variable and fixed. "This distinction is crucial in forecasting the earnings generated by various changes in unit sales and thus the financial impact of proposed marketing campaigns." In a survey of nearly 200 senior marketing managers, 60 percent responded that they found the "variable and fixed costs" metric very useful.[1]
Calculating Cost
- Average Total Cost (ATC) = Total Cost / Q (Output is quantity produced or ‘Q’)
- Average Variable Cost (AVC) = Total Variable Cost / Q
- Average Fixed Cost (AFC) = ATC – AVC
- Total Cost (TC) = (AVC + AFC) X Output (Which is Q)
- Total Variable Cost (TVC) = AVC X Output
- Total Fixed Cost (TFC) = TC – TVC
- Marginal Cost (MC) = Change in Total Costs / Change in Output
- Marginal Product (MP) = Change in Total Product / Change in Variable Factor
- Marginal Revenue (MR) = Change in Total Revenue / Change in Q
- Average Product (AP) = TP / Variable Factor
- Total Revenue (TR) = Price X Quantity
- Average Revenue (AR) = TR / Output
- Total Product (TP) = AP X Variable Factor
- Economic Profit = TR – TC > 0
- A Loss = TR – TC < 0
- Break Even Point = AR = ATC
- Profit Maximizing Condition = MR = MC
See also
References
- ↑ Farris, Paul W.; Neil T. Bendle; Phillip E. Pfeifer; David J. Reibstein (2010). Marketing Metrics: The Definitive Guide to Measuring Marketing Performance. Upper Saddle River, New Jersey: Pearson Education, Inc. ISBN 0-13-705829-2. The Marketing Accountability Standards Board (MASB) endorses the definitions, purposes, and constructs of classes of measures that appear in Marketing Metrics as part of its ongoing Common Language in Marketing Project.