Thermography
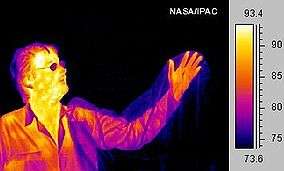
Infrared thermography (IRT), thermal imaging, and thermal video are examples of infrared imaging science. Thermographic cameras usually detect radiation in the long-infrared range of the electromagnetic spectrum (roughly 9,000–14,000 nanometers or 9–14 µm) and produce images of that radiation, called thermograms. Since infrared radiation is emitted by all objects with a temperature above absolute zero according to the black body radiation law, thermography makes it possible to see one's environment with or without visible illumination. The amount of radiation emitted by an object increases with temperature; therefore, thermography allows one to see variations in temperature. When viewed through a thermal imaging camera, warm objects stand out well against cooler backgrounds; humans and other warm-blooded animals become easily visible against the environment, day or night. As a result, thermography is particularly useful to the military and other users of surveillance cameras.

Some physiological changes in human beings and other warm-blooded animals can also be monitored with thermal imaging during clinical diagnostics. Thermography is used in allergy detection and veterinary medicine. It is also used for breast screening, though primarily by alternative practitioners as it is considerably less accurate and specific than competing techniques. Government and airport personnel used thermography to detect suspected swine flu cases during the 2009 pandemic.[1]
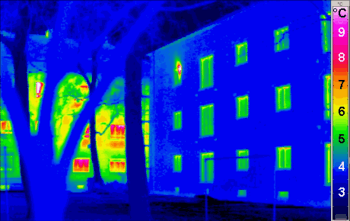
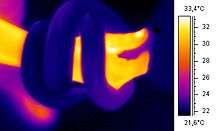
Thermography has a long history, although its use has increased dramatically with the commercial and industrial applications of the past fifty years. Firefighters use thermography to see through smoke, to find persons, and to localize the base of a fire. Maintenance technicians use thermography to locate overheating joints and sections of power lines, which are a sign of impending failure. Building construction technicians can see thermal signatures that indicate heat leaks in faulty thermal insulation and can use the results to improve the efficiency of heating and air-conditioning units.
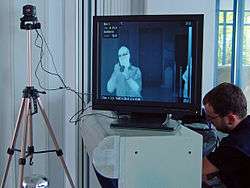
The appearance and operation of a modern thermographic camera is often similar to a camcorder. Often the live thermogram reveals temperature variations so clearly that a photograph is not necessary for analysis. A recording module is therefore not always built-in.
Non-specialized CCD and CMOS sensors have most of their spectral sensitivity in the visible light wavelength range. However, by utilizing the "trailing" area of their spectral sensitivity, namely the part of the infrared spectrum called near-infrared (NIR), and by using off-the-shelf CCTV camera it is possible under certain circumstances to obtain true thermal images of objects with temperatures at about 280 °C and higher.[2]
Specialized thermal imaging cameras use focal plane arrays (FPAs) that respond to longer wavelengths (mid- and long-wavelength infrared). The most common types are InSb, InGaAs, HgCdTe and QWIP FPA. The newest technologies use low-cost, uncooled microbolometers as FPA sensors. Their resolution is considerably lower than that of optical cameras, mostly 160x120 or 320x240 pixels, up to 1024×768[3] for the most expensive models. Thermal imaging cameras are much more expensive than their visible-spectrum counterparts, and higher-end models are often export-restricted due to the military uses for this technology. Older bolometers or more sensitive models such as InSb require cryogenic cooling, usually by a miniature Stirling cycle refrigerator or liquid nitrogen.
Thermal energy


Thermal images, or thermograms, are actually visual displays of the amount of infrared energy emitted, transmitted, and reflected by an object. Because there are multiple sources of the infrared energy, it is difficult to get an accurate temperature of an object using this method. A thermal imaging camera is capable of performing algorithms to interpret that data and build an image. Although the image shows the viewer an approximation of the temperature at which the object is operating, the camera is actually using multiple sources of data based on the areas surrounding the object to determine that value rather than detecting the actual temperature.[4]
This phenomenon may become clearer upon consideration of the formula:
Incident Radiant Power = Emitted Radiant Power + Transmitted Radiant Power + Reflected Radiant Power;
where: Incident Radiant Power is the radiant power profile when viewed through a thermal imaging camera. Emitted Radiant Power is generally what is intended to be measured; Transmitted Radiant Power is the radiant power that passes through the subject from a remote thermal source, and; Reflected Radiant Power is the amount of radiant power that reflects off the surface of the object from a remote thermal source.
This phenomenon occurs everywhere, all the time. It is a process known as Radiant Heat Exchange, since Radiant Power × Time equals Radiant Energy. However, in the case of Infrared Thermography, the above equation is used to describe the radiant power within the spectral wavelength passband of the thermal imaging camera in use. The Radiant Heat exchange requirements described in the equation apply equally at every wavelength in the Electromagnetic Spectrum
If the object is radiating at a higher temperature than its surroundings, then power transfer will be taking place and power will be radiating from warm to cold following the principle stated in the Second Law of Thermodynamics. So if there is a cool area in the thermogram, that object will be absorbing the radiation emitted by the warm object.
The ability of objects to emit is called emissivity, to absorb radiation is called absorptivity. Under outdoor environments, convective cooling from wind may also need to be considered when trying to get an accurate temperature reading.
The thermal imaging camera would next employ a series of mathematical algorithms. Since the camera is only able to see the electromagnetic radiation that is impossible to detect with the human eye, it will build a picture in the viewer and record a visible picture, usually in a JPG format.
In order to perform the role of non-contact temperature recorder, the camera will change the temperature of the object being viewed with its emissivity setting.
Other algorithms can be used to affect the measurement, including the transmission ability of the transmitting medium (usually air) and the temperature of that transmitting medium. All these settings will affect the ultimate output for the temperature of the object being viewed.
This functionality makes the thermal imaging camera an excellent tool for the maintenance of electrical and mechanical systems in industry and commerce. By using the proper camera settings and by being careful when capturing the image, electrical systems can be scanned and problems can be found. Faults with steam traps in steam heating systems are easy to locate.
In the energy savings area, the thermal imaging camera can do more. Because it can see the effective radiation temperature of an object as well as what that object is radiating towards, it can help locate sources of thermal leaks and overheated regions as well.
Emissivity
Emissivity is a term that is often misunderstood and misused. It represents a material's ability to emit thermal radiation and is an optical property of matter.
Each material has a different emissivity, which may vary by temperature and infrared wavelength.[5] For example, clean metal surfaces have emissivity that decreases at longer wavelengths; many dielectric materials, such as quartz (SiO2), sapphire (Al2O3), calcium fluoride (CaF2), etc. have emissivity that increases at longer wavelength; simple oxides, such as Iron Oxide (Fe2O3) display relatively flat emissivity in the infrared spectrum.
A material's emissivity can range from a theoretical 0.00 (completely not-emitting) to an equally theoretical 1.00 (completely emitting). An example of a substance with low emissivity would be silver, with an emissivity coefficient of .02. An example of a substance with high emissivity would be asphalt, with an emissivity coefficient of .98.
A black body is a theoretical object with an emissivity of 1 that radiates thermal radiation characteristic of its contact temperature. That is, if the contact temperature of a thermally uniform black body radiator were 50 °C, the black body would emit thermal radiation characteristic of 50 °C.
An ordinary object emits less infrared radiation than a theoretical black body. The fraction of its actual emission to the theoretical emission (of the black body) is its emissivity (or emissivity coefficient).
In order to make a temperature measurement of an object using an infrared imager, it is necessary to estimate or determine the object's emissivity. For quick work, a thermographer may refer to an emissivity table for a given type of object, and enter that value into the imager. The imager would then calculate the object's contact temperature based on the value entered from the table and the object's emission of infrared radiation as detected by the imager.
In order to get a more accurate temperature measurement, a thermographer may apply a standard material of known, high emissivity to the surface of the object. The standard material might be as complex as industrial emissivity spray produced specifically for the purpose, or as simple as standard black insulation tape, with an emissivity of about 0.97. The object's known temperature can then be measured using the standard emissivity. If desired, the object's actual emissivity (on a part of the object that is not covered by the standard material) can then be determined by adjusting the imager's setting to the known temperature. There are situations, however, when such an emissivity test is not possible due to dangerous or inaccessible conditions. In these situations, the thermographer must rely on tables.
Difference between infrared film and thermography
IR film is sensitive to infrared (IR) radiation in the 250 °C to 500 °C range, while the range of thermography is approximately −50 °C to over 2,000 °C. So, for an IR film to work thermographically, it must be over 250 °C or be reflecting infrared radiation from something that is at least that hot.
Night vision infrared devices image in the near-infrared, just beyond the visual spectrum, and can see emitted or reflected near-infrared in complete visual darkness. However, again, these are not usually used for thermography due to the high temperature requirements, but are instead used with active near-IR sources.
Starlight-type night vision devices generally only magnify ambient light.
Passive vs. active thermography
All objects above the absolute zero temperature (0 K) emit infrared radiation. Hence, an excellent way to measure thermal variations is to use an infrared vision device, usually a focal plane array (FPA) infrared camera capable of detecting radiation in the mid (3 to 5 μm) and long (7 to 14 μm) wave infrared bands, denoted as MWIR and LWIR, corresponding to two of the high transmittance infrared windows. Abnormal temperature profiles at the surface of an object are an indication of a potential problem.[6]
In passive thermography, the features of interest are naturally at a higher or lower temperature than the background. Passive thermography has many applications such as surveillance of people on a scene and medical diagnosis (specifically thermology).
Active thermography
In active thermography, an energy source is required to produce a thermal contrast between the feature of interest and the background. The active approach is necessary in many cases given that the inspected parts are usually in equilibrium with the surroundings.
Advantages of thermography
- It shows a visual picture so temperatures over a large area can be compared[7][8][9]
- It is capable of catching moving targets in real time[7][8][9]
- It is able to find deteriorating, i.e., higher temperature components prior to their failure
- It can be used to measure or observe in areas inaccessible or hazardous for other methods
- It is a non-destructive test method
- It can be used to find defects in shafts, pipes, and other metal or plastic parts[10]
- It can be used to detect objects in dark areas
- It has some medical application, essentially in physiotherapy
Limitations and disadvantages of thermography
- Quality cameras often have a high price range (often US$3,000 or more) due to the expense of the larger pixel array (state of the art 1024X720), while less expensive models (with pixel arrays of 40x40 up to 160x120 pixels) are also available. Fewer pixels reduce the image quality making it more difficult to distinguish proximate targets within the same field of view.
- Many models do not provide the irradiance measurements used to construct the output image; the loss of this information without a correct calibration for emissivity, distance, and ambient temperature and relative humidity entails that the resultant images are inherently incorrect measurements of temperature[11]
- Images can be difficult to interpret accurately when based upon certain objects, specifically objects with erratic temperatures, although this problem is reduced in active thermal imaging[12]
- Accurate temperature measurements are hindered by differing emissivities and reflections from other surfaces[13]
- Most cameras have ±2% accuracy or worse in measurement of temperature and are not as accurate as contact methods[7][8][9]
- Only able to directly detect surface temperatures
Applications


- Condition monitoring
- Low Slope and Flat Roofing Inspections
- Building diagnostics including building envelope inspections, moisture inspections, and energy losses in buildings[14]
- Thermal Mapping
- Digital infrared thermal imaging in health care
- Medical imaging
- Non-contact thermography, contact thermography and dynamic angiothermography
- Peripheral vascular disease screening.
- Neuromusculoskeletal disorders.
- Extracranial cerebral and facial vascular disease.
- Thyroid gland abnormalities.
- Various other neoplastic, metabolic, and inflammatory conditions.
- Archaeological Kite Aerial Thermography
- Thermology
- Veterinary Thermal Imaging
- Night vision and Targeting
- UAV Surveillance[15]
- Stereo vision[16]
- Research
- Process control
- Nondestructive testing
- Surveillance in security, law enforcement and defence
- Chemical imaging
- Volcanology[17]
- Building[18]
Thermal imaging cameras convert the energy in the infrared wavelength into a visible light display. All objects above absolute zero emit thermal infrared energy, so thermal cameras can passively see all objects, regardless of ambient light. However, most thermal cameras only see objects warmer than −50 °C.
The spectrum and amount of thermal radiation depend strongly on an object's surface temperature. This makes it possible for a thermal imaging camera to display an object's temperature. However, other factors also influence the radiation, which limits the accuracy of this technique. For example, the radiation depends not only on the temperature of the object, but is also a function of the emissivity of the object. Also, radiation originates from the surroundings and is reflected in the object, and the radiation from the object and the reflected radiation will also be influenced by the absorption of the atmosphere.
Standards
- ISO 6781, Thermal insulation – Qualitative detection of thermal irregularities in building envelopes – Infrared method
- ISO 18434-1, Condition monitoring and diagnostics of machines – Thermography – Part 1: General procedures
- ISO 18436-7, Condition monitoring and diagnostics of machines – Requirements for qualification and assessment of personnel – Part 7: Thermography
Biological counterpart
Thermography by definition is by means of an instrument (artifact), but some living creatures have natural organs that function as counterparts to bolometers, and thus possess a crude type of thermal imaging capability (thermoception). One of the best known examples is infrared sensing in snakes.
See also
- ASTM Subcommittee E20.02 on Radiation Thermometry
- Chemical imaging
- Digital infrared thermal imaging in health care
- Fluorescent microthermography
- High-definition thermal imaging
- Infrared and thermal testing
- Infrared camera
- Infrared detector
- Infrared thermometer
- Night vision
- Sakuma–Hattori equation
- Thermal imaging camera (firefighting)
- Thermographic inspection
- Thermology
- Thermography (medical)
References
- ↑ FLIR Infrared Cameras Help Detect the Spreading of Swine Flu and Other Viral Diseases. Applegate.co.uk (2009-04-29). Retrieved on 2013-06-18.
- ↑ Poryev, V. A.; Poryev, G. V. (2004). "Experimental determination of the temperature range of a television pyrometer". Journal of Optical Technology. 71 (1): 70–71. Bibcode:2004JOptT..71...62P. doi:10.1364/JOT.71.000062.
- ↑ FLIR T1K HD Thermal imaging camera specifications. Retrieved on 2015-12-10.
- ↑ "Infrared Technology". thermalscope.com. Retrieved 31 October 2014.
- ↑ SpectralEmissivity.com. SpectralEmissivity.com.
- ↑ Maldague X. P. V., Jones T. S., Kaplan H., Marinetti S. and Prystay M. (2001) "Chapter 2: Fundamentals of Infrared and Thermal Testing: Part 1. Principles of Infrared and Thermal Testing," in Nondestructive Handbook, Infrared and Thermal Testing, Volume 3, X. Maldague technical ed., P. O. Moore ed., 3rd edition, Columbus, Ohio, ASNT Press.
- 1 2 3 Costello, Joseph T.; McInerney, Ciarán D.; Bleakley, Chris M.; Selfe, James; Donnelly, Alan E. (2012-02-01). "The use of thermal imaging in assessing skin temperature following cryotherapy: a review". Journal of Thermal Biology. 37 (2): 103–110. doi:10.1016/j.jtherbio.2011.11.008.
- 1 2 3 Bach, A; Stewart, IB; Minett, G; Costello, JT (2015). "Does the technique employed for skin temperature assessment alter outcomes? A systematic review - IOPscience". Physiol Meas. 36: R27–51. Bibcode:2015PhyM...36R..27B. doi:10.1088/0967-3334/36/9/r27. PMID 26261099.
- 1 2 3 Bach, Aaron J. E.; Stewart, Ian B.; Disher, Alice E.; Costello, Joseph T. (2015-02-06). "A Comparison between Conductive and Infrared Devices for Measuring Mean Skin Temperature at Rest, during Exercise in the Heat, and Recovery". PLoS ONE. 10 (2): e0117907. Bibcode:2015PLoSO..1017907B. doi:10.1371/journal.pone.0117907. PMC 4319934
 . PMID 25659140.
 - ↑ Using Thermography to Find a Class of Latent Construction Defects. Globalspec.com. Retrieved on 2013-06-18.
- ↑ F. Colbert, "Looking Under the Hood: Converting Proprietary Image File Formats Created within IR Cameras for Improved Archival Use", Professional Thermographers Association
- ↑ Infrared Temperature Theory and Application. Omega.com. Retrieved on 2013-06-18.
- ↑ Real Time Emissivity Measurement for Infrared Temperature Measurement. Pyrometer.com. Retrieved on 2013-06-18.
- ↑ "Infrared thermography (IRT) applications for building diagnostics: A review". Angeliki Kylili, Paris A. Fokaides, Petros Christou, Soteris A. Kalogirou. Applied Energy. Retrieved 30 October 2014.
- ↑ Breckon, T.; Gaszczak, A.; Han, J. (2011). Röning, Juha; Casasent, David P; Hall, Ernest L, eds. "Real-time People and Vehicle Detection from UAV Imagery". Proc. SPIE Conference Intelligent Robots and Computer Vision XXVIII: Algorithms and Techniques. Intelligent Robots and Computer Vision XXVIII: Algorithms and Techniques. 7878: 78780B. doi:10.1117/12.876663.
- ↑ Pinggera, P.; Breckon, T. P.; Bischof, H. (2012). "On Cross-Spectral Stereo Matching using Dense Gradient Features". In Proc. British Machine Vision Conference: 526.1–526.12. doi:10.5244/C.26.103. ISBN 1-901725-46-4.
- ↑ Thermographic images in active volcanoes surveillance system — TIIMNet project Vesuvius and Solfatara INGV Naples Italy. Ipf.ov.ingv.it. Retrieved on 2013-06-18.
- ↑ Infrared Building Inspections — Resources for Electrical, Mechanical, Residential and Commercial Infrared/Thermal Inspections. Infrared-buildinginspections.com (2008-09-04). Retrieved on 2013-06-18.
External links
| Wikimedia Commons has media related to Thermography. |
- Infrared Tube, infrared imaging science demonstrations
- Compix, Some uses of thermographic images in electronics
- Thermographic Images, Infrared pictures
- The thermographic library, collection of various use of thermogram
- Uncooled thermal imaging works round the clock by Lawrence Mayes
- IR Thermometry & Thermography Applications Repository , IR Thermometry & Thermography Applications Repository