Surface weather observation

Surface weather observations are the fundamental data used for safety as well as climatological reasons to forecast weather and issue warnings worldwide.[1] They can be taken manually, by a weather observer, by computer through the use of automated weather stations, or in a hybrid scheme using weather observers to augment the otherwise automated weather station. The ICAO defines the International Standard Atmosphere (ISA), which is the model of the standard variation of pressure, temperature, density, and viscosity with altitude in the Earth's atmosphere, and is used to reduce a station pressure to sea level pressure. Airport observations can be transmitted worldwide through the use of the METAR observing code. Personal weather stations taking automated observations can transmit their data to the United States mesonet through the Citizen Weather Observer Program (CWOP), the UK Met Office through their Weather Observations Website (WOW),[2] or internationally through the Weather Underground Internet site.[3] A thirty-year average of a location's weather observations is traditionally used to determine the station's climate.[4]
Airports
Surface weather observations have traditionally been taken at airports due to safety concerns during takeoffs and landings. The ICAO defines the International Standard Atmosphere (also known as ICAO Standard Atmosphere), which is the model of the standard variation of pressure, temperature, density, and viscosity with elevation/altitude in the Earth's atmosphere. This is useful in calibrating instruments and designing aircraft,[5] and is used to reduce a station's pressure to sea level pressure (SLP) where it can then be used on weather maps.[6]
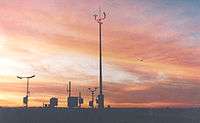
In the United States, the FAA mandates the taking of weather observations at larger airports for safety reasons. To help facilitate the purchase of an automated airport weather station, such as ASOS, the FAA allows federal dollars to be used for the installation of certified weather stations at airports.[7] The airport observations are then transmitted worldwide using the METAR observing code. METAR reports typically come from airports or permanent weather observation stations. Reports are generated once an hour; however, if conditions change significantly, they may be updated in special reports called SPECIs.[8]
Data reported
Surface weather observations can include the following elements:
- The Station Identifier, or Location identifier, consists of four characters for METAR observations,[9] with the first representing the region of the world the station lies within. For example, the first letter for areas in and around the Pacific Ocean is P, and for Europe is E. The second character may represent the country/state the location lies within. For Hawaii, the first two letters are "PH" while for Great Britain, the first two letters of the station identifier are "EG". Canada and the contiguous United States are an exception, with the first letters C and K representing the regions, respectively. The final two or three letters normally represent the name of the location or airport.
- Visibility, measured in meters for most sites worldwide, except in the United States where statute miles are reported.[10]
- Runway visibility, measured in meters in many locations worldwide, or feet within the United States.[10]
- Temperature is a measure of the kinetic energy of a sample of matter. Temperature is the unique physical property that determines the direction of heat flow between two objects placed in thermal contact. If no heat flow occurs, the two objects have the same temperature;[11] otherwise heat flows from the hotter object to the colder object. Temperature, within meteorology, is measured with thermometers exposed to the air but sheltered from direct solar exposure.[12] In most of the world, the degree Celsius scale is used for most temperature measuring purposes. However, the United States is the last major country in which the degree Fahrenheit temperature scale is used by most lay people, industry, popular meteorology, and government.[10] Despite this, METAR reports from the United States also report the temperature (and dewpoint, see below) in degrees Celsius.
- Dew point is the temperature to which a given parcel of air must be cooled, at constant atmospheric pressure, for water vapor to condense into water. The condensed water is called dew. The dew point is a saturation point. When the dew point temperature falls below freezing it is called the frost point, as the water vapor no longer creates dew but instead creates frost or hoarfrost by deposition.[13] The dew point is associated with relative humidity. A high relative humidity indicates that the dew point is closer to the current air temperature. If the relative humidity is 100%, the dew point is equal to the current temperature. Given a constant dew point, an increase in temperature will lead to a decrease in relative humidity. At a given barometric pressure, independent of temperature, the dew point determines the specific humidity of the air. The dew point is an important statistic for general aviation pilots, as it is used to calculate the likelihood of carburetor icing and fog. When used with the air temperature, a formula can be used to estimate the height of cumuliform, or convective, clouds.[14]
- Wind is determined using anemometers and wind vanes, or aerovanes, located a standard 10 metres (33 ft) above ground level (AGL). Average wind speed is measured using a two-minute average in the United States,[15] and a 10-minute average elsewhere.[16] Wind direction is measured using degrees, with north representing 0 or 360 degrees, with values increasing from 0 clockwise from north. Wind gusts are reported when there is variation of the wind speed of more than 10 knots (5.1 m/s) between peaks and lulls during the sampling period.[15]
- Sea level pressure (SLP) is the pressure at sea level or (when measured at a given elevation on land) the station pressure reduced to sea level assuming an isothermal layer at the station temperature. This is the pressure normally given in weather reports on radio, television, and newspapers or on the Internet. When barometers in the home are set to match the local weather reports, they measure pressure reduced to sea level, not the actual local atmospheric pressure. The reduction to sea level means that the normal range of fluctuations in pressure is the same for everyone. The pressures which are considered high pressure or low pressure do not depend on geographical location. This makes isobars on a weather map meaningful and useful tools.[17]
- Altimeter setting is a term and quantity used in aviation. The regional or local air pressure at mean sea level is called the altimeter setting, and the pressure which will calibrate the altimeter to show the height above ground at a given QNH airfield.[18]
- Present weather, which present restrictions to visibility or presence of thunder or squalls, are reported in observations to indicate to aviation any possible threats during landings and takeoffs from airports. Types included in surface weather observations include precipitation, obscurations, other weather phenomena such as, well-developed dust/sand whirls, squalls, tornadic activity, sandstorms, volcanic ash, and dust storms.[19]
- Intensity of precipitation is primarily measured for meteorological concerns. However, it can be of concern to aviation as heavy precipitation can limit visibility. Also, intensity of freezing rain can determine how hazardous it is for pilots to fly nearby certain locations since it can be an in-flight hazard by depositing ice on the wings of aircraft, which can be detrimental to flight.[20]
- Precipitation amount over the past 1, 3, 6 or 24 hours is of particular interest to meteorologists in verifying forecast amounts of precipitation and determining station climatologies.
- Snowfall amount during the past 6 hours is taken for meteorological and climatological concerns. However, it may also be reported hourly using "SNOINCR" remarks to provide air field technicians information on how frequently snow must be plowed from runways and taxiways.
- Snow depth is measured for meteorological and climatological concerns once a day. However, during periods of snowfall, it is measured each six hours to determine amount of recent snowfall.[21]
Example of a METAR surface weather observation
METAR LBBG 041600Z 12003MPS 310V290 1400 R04/P1500N R22/P1500U +SN BKN022 OVC050 M04/M07 Q1020 NOSIG 9949//91=[22]
Personal weather stations, maintained by citizens rather than government officials, do not use METAR code. Software allows information to be transmitted to various sites, such as the Weather Underground globally,[3] or the CWOP within the United States,[23] which can then be used by the appropriate meteorological organizations either to diagnose real-time conditions, or be used within weather forecast models.
Use of weather maps

Data collected by land locations coding in METAR are conveyed worldwide via phone lines or wireless technology. Within many nations' meteorological organizations, this data is then plotted onto a weather map using the station model. A station model is a symbolic illustration showing the weather occurring at a given reporting station.[24] Meteorologists created the station model to plot a number of weather elements in a small space on weather maps.[25] Maps filled with dense station-model plots can be difficult to read, but they allow meteorologists, pilots, and mariners to see important weather patterns.
Weather maps are used to display information quickly showing the analysis of various meteorological quantities at various levels of the atmosphere, in this case the surface layer.[26] Maps containing station models aid in the drawing of isotherms, which more readily identifies temperature gradients,[27] and can help in the location of weather fronts. Two-dimensional streamlines based on wind speeds show areas of convergence and divergence in the wind field, which are helpful in determining the location of features within the wind pattern. A popular type of surface weather map is the surface weather analysis, which plots isobars to depict areas of high pressure and low pressure.
Ship and buoy reports
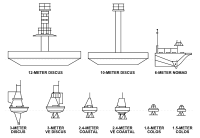
For over a century, reports from the world's oceans have been received real-time for safety reasons and to help with general weather forecasting. The reports are coded using the synoptic code, and relayed via radio or satellite to weather organizations worldwide.[28] Buoy reports are automated, and maintained by the country that moored the buoy in that location. Larger moored buoys are used near shore, while smaller drifting buoys are used farther out at sea.[29]
Due to the importance of reports from the surface of the ocean, the voluntary observing ship program, known as VOS, was set up to train crews how to take weather observations while at sea and also to calibrate weather sensors used aboard ships when they arrive in port, such as barometers and thermometers.[30] The Beaufort scale is still generally used to determine wind speed from manual observers out at sea. Ships with anemometers have issues with determining wind speeds at higher wind speeds due to blockage of the instruments by increasing high seas.
Use in establishing climate of a location
Climate, (from Ancient Greek klima) is commonly defined as the weather averaged over a long period of time.[31] The standard averaging period is 30 years for an individual location,[4] but other periods may be used. Climate includes statistics other than the average, such as the magnitudes of day-to-day or year-to-year variations. The Intergovernmental Panel on Climate Change (IPCC) glossary definition is:
- Climate in a narrow sense is usually defined as the “average weather”, or more rigorously, as the statistical description in terms of the mean and variability of relevant quantities over a period of time ranging from months to thousands or millions of years. The classical period is 30 years, as defined by the World Meteorological Organization (WMO). These quantities are most often surface variables such as temperature, precipitation, and wind. Climate in a wider sense is the state, including a statistical description, of the climate system.[32]
The main difference between climate and everyday weather is best summarized by the popular phrase "Climate is what you expect, weather is what you get."[33] Over historic time spans there are a number of static variables that determine climate, including: latitude, altitude, proportion of land to water, and proximity to oceans and mountains. Degree of vegetation coverage affects solar heat absorption, water retention, and rainfall on a regional level.
See also
References
- ↑ Office of the Federal Coordinator of Meteorology. Surface Weather Observation Program. Retrieved on 2008-01-12.
- ↑ "WOW - A new weather website for everyone". Met Office. 2011-02-11.
- 1 2 Weather Underground. Personal Weather Station. Retrieved on 2008-03-09.
- 1 2 MetOffice. Climate Averages. Retrieved on 2008-03-09.
- ↑ ICAO, Manual of the ICAO Standard Atmosphere (extended to 80 kilometres (262 500 feet)), Doc 7488-CD, Third Edition, 1993, ISBN 92-9194-004-6
- ↑ Patricia M. Pauley. An Example of Uncertainty in Sea Level Pressure Reduction. Retrieved on 2008-03-29.
- ↑ Allweatherinc. Why buy an AWOS? Retrieved on 2008-01-12.
- ↑ National Climatic Data Center. METAR Home Page. Retrieved on 2008-01-12.
- ↑ Texas A&M University. Coding the Type of Report, Station Identifier, Date/Time, and Report Modifier groups. Retrieved on 2008-04-06.
- 1 2 3 National Weather Service. Frequently Asked Questions about METAR/SPECI and TAF. Retrieved on 2008-04-06.
- ↑ Glossary of Meteorology. Temperature. Retrieved on 2008-04-06.
- ↑ Glossary of Meteorology. Air Temperature. Retrieved on 2008-04-06.
- ↑ Glossary of Meteorology. Dewpoint. Retrieved on 2008-04-06.
- ↑ Glossary of Meteorology. Dewpoint Formula. Retrieved on 2008-04-06.
- 1 2 Office of the Federal Coordinator for Meteorology. Federal Meteorological Handbook No. 1 - Surface Weather Observations and Reports September 2005 Appendix A: Glossary. Retrieved on 2008-04-06.
- ↑ Hurricane Research Division. Frequently Asked Questions Subject D4) What does "maximum sustained wind" mean? How does it relate to gusts in tropical cyclones? Retrieved on 2008-04-06.
- ↑ Patricia M. Pauley. An Example of Uncertainty in Sea Level Pressure Reduction. Retrieved on 2008-04-14.
- ↑ USA Today. Understanding Air Pressure. Retrieved on 2008-04-14.
- ↑ Texas A&M University. Present Weather Group w'w'(ww). Retrieved on 2008-04-14.
- ↑ Ben C. Bernstein, Thomas P. Ratvasky, Dean R. Miller, and Frank McDonough. Freezing Rain as in In-Flight Icing Hazard. Retrieved on 2008-04-14.
- ↑ NOAA Meteorological Assimilation Data Ingest System. How to Take Snow Measurements. Retrieved on 2008-04-14.
- ↑ National Climatic Data Center. Key to METAR Surface Weather Observations. Retrieved on 2008-03-09.
- ↑ Russ Chadwick. Citizen Weather Observer Program. Retrieved on 2008-03-09.
- ↑ Steve Ackerman and Tom Whittaker.Station Model. Retrieved on 2008-03-27.
- ↑ Illinois Central College. LAB J: Weather Maps and Humidity. Retrieved on 2008-03-27.
- ↑ Encarta. Chart. Retrieved on 2007-11-25.
- ↑ DataStreme. AIR TEMPERATURE PATTERNS. Retrieved on 2007-11-25.
- ↑ National Weather Service. National Weather Service Observing Handbook 1: Marine Surface Weather Observations. Retrieved on 2008-01-13.
- ↑ National Data Buoy Center. Moored Buoy Program. Retrieved on 2008-01-13.
- ↑ National Data Buoy Center. The WMO Voluntary Observing Ships (VOS) Scheme. Retrieved on 2008-01-13.
- ↑ Glossary of Meteorology. Climate. Retrieved on 2008-03-09.
- ↑ Intergovernmental Panel on Climate Change. Appendix I: Glossary. Retrieved on 2007-06-01.
- ↑ National Weather Service Office Tucson, Arizona. Main page. Retrieved on 2007-06-01.
External links