Subprime crisis background information
This article provides background information helpful to understanding the subprime mortgage crisis. It discusses subprime lending, foreclosures, risk types, and mechanisms through which various entities involved are affected by the crisis.
Subprime lending
The U.S. Federal Deposit Insurance Corporation (FDIC) has defined subprime borrowers and lending: "The term subprime refers to the credit characteristics of individual borrowers. Subprime borrowers typically have weakened credit histories that include payment delinquencies, and possibly more severe problems such as charge-offs, judgments, and bankruptcies. They may also display reduced repayment capacity as measured by credit scores, debt-to-income ratios, or other criteria that may encompass borrowers with incomplete credit histories. Subprime loans are loans to borrowers displaying one or more of these characteristics at the time of origination or purchase. Such loans have a higher risk of default than loans to prime borrowers."[1] If a borrower is delinquent in making timely mortgage payments to the loan servicer (a bank or other financial firm), the lender may take possession of the property, in a process called foreclosure.
A plain-language overview
The following is excerpted (with some modifications) from former U.S. President George W. Bush's Address to the Nation on September 24, 2008:[2] Other additions are sourced later in the article or in the main article.
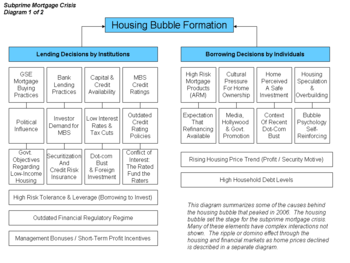
The problems we are witnessing today developed over a long period of time. For more than a decade, a massive amount of money flowed into the United States from investors abroad. This large influx of money to U.S. banks and financial institutions — along with low interest rates — made it easier for Americans to get credit. Easy credit — combined with the faulty assumption that home values would continue to rise — led to excesses and bad decisions.
Many mortgage lenders approved loans for borrowers without carefully examining their ability to pay. Many borrowers took out loans larger than they could afford, assuming that they could sell or refinance their homes at a higher price later on. Both individuals and financial institutions increased their debt levels relative to historical norms during the past decade significantly.
Optimism about housing values also led to a boom in home construction. Eventually the number of new houses exceeded the number of people willing to buy them. And with supply exceeding demand, housing prices fell. And this created a problem: Borrowers with adjustable rate mortgages (i.e., those with initially low rates that later rise) who had been planning to sell or refinance their homes before the adjustments occurred were unable to refinance. As a result, many mortgage holders began to default as the adjustments began.
These widespread defaults (and related foreclosures) had effects far beyond the housing market. Home loans are often packaged together, and converted into financial products called "mortgage-backed securities". These securities were sold to investors around the world. Many investors assumed these securities were trustworthy, and asked few questions about their actual value.
Credit rating agencies gave them high-grade, safe ratings. Two of the leading sellers of mortgage-backed securities were Fannie Mae and Freddie Mac. Because these companies were chartered by Congress, many believed they were guaranteed by the federal government. This allowed them to borrow enormous sums of money, fuel the market for questionable investments, and put the financial system at risk.
The decline in the housing market set off a domino effect across the U.S. economy. When home values declined and adjustable rate mortgage payment amounts increased, borrowers defaulted on their mortgages. Investors globally holding mortgage-backed securities (including many of the banks that originated them and traded them among themselves) began to incur serious losses. Before long, these securities became so unreliable that they were not being bought or sold.
Investment banks such as Bear Stearns and Lehman Brothers found themselves saddled with large amounts of assets they could not sell. They ran out of the money needed to meet their immediate obligations and faced imminent collapse. Other banks found themselves in severe financial trouble. These banks began holding on to their money, and lending dried up, and the gears of the American financial system began grinding to a halt.
Precursor, "Subprime I"
Although most references to the Subprime Mortgage Crisis refer to events and conditions that led to the financial crisis and subsequent recession that began in 2008, a much smaller bubble and collapse occurred in the mid- to late-1990s, sometimes dubbed "Subprime I"[3] or "Subprime 1.0".[4] It ended in 1999 when the rate of subprime mortgage securitization dropped from 55.1% in 1998 to 37.4% in 1999. In the two years following the 1998 Russian financial crisis, "eight of the top ten" subprime lenders "declared bankruptcy, ceased operations, or sold out to stronger firms."[5]
The crisis is said to have had "had all the earmarks of a classic bubble" with enthusiasm over rising stock prices replacing caution over shoddy business practices and concern over whether the earnings of the companies were sustainable. Loans were made to borrowers who were unable to pay them back. The subprime mortgage companies began taking unexpected write-downs as mortgages were refinanced at lower interest rates. Much of the reported profits turned out to be illusory and companies such as Famco went under. Along with the bankruptcies came a wave of lawsuits and complaints from consumer advocates, who accused the subprime industry of engaging in predatory lending. The impact was slight compared to the later bubble.
Subprime I was smaller in size — in the mid-1990s $30 billion of mortgages constituted "a big year" for subprime lending, by 2005 there were $625 billion in subprime mortgage loans, $507 billion of which were in mortgage backed securities — and was essentially "really high rates for borrowers with bad credit". Mortgages were mostly fixed-rate, still required borrowers to prove they could pay by documenting income, etc.[6] By 2006, 75% of subprime loans were some form of floating-rate, usually fixed for the first two years."[7]
Background to the crisis
In 2006, Lehman Brothers and Bear Stearns, whose fixed-income franchises benefitted from having integrated mortgage origination businesses, were seen as runaway success stories. Many more investment banks had already built large mortgage desks, and invested heavily in subprime platforms. Mortgage origination and securitization generated lucrative fees during the time when the US market developed away from the traditional agency/CMO model.[8]
Fannie Mae and Freddie Mac shrunk their balance sheets substantially as conforming mortgage origination volumes diminished, and private label securitization grew substantially from 2002.[8] Large-scale defaults from subprime lending had yet to hit headlines in 2006; rating agencies began sounding early alarm bells in the summer of 2006 but it was anticipated delinquencies would go up with the biggest rollovers on the new loans (around 2008).[8]
Stages of the crisis
The crisis has gone through stages. First, during late 2007, over 100 mortgage lending companies went bankrupt as subprime mortgage-backed securities could no longer be sold to investors to acquire funds. Second, starting in Q4 2007 and in each quarter since then, financial institutions have recognized massive losses as they adjust the value of their mortgage backed securities to a fraction of their purchased prices. These losses as the housing market continued to deteriorate meant that the banks have a weaker capital base from which to lend. Third, during Q1 2008, investment bank Bear Stearns was hastily merged with bank JP Morgan with $30 billion in government guarantees, after it was unable to continue borrowing to finance its operations.[9]
Fourth, during September 2008, the system approached meltdown. In early September Fannie Mae and Freddie Mac, representing $5 trillion in mortgage obligations, were nationalized by the U.S. government as mortgage losses increased. Next, investment bank Lehman Brothers filed for bankruptcy. In addition, two large U.S. banks (Washington Mutual and Wachovia) became insolvent and were sold to stronger banks.[10] The world's largest insurer, AIG, was 80% nationalized by the U.S. government, due to concerns regarding its ability to honor its obligations via a form of financial insurance called credit default swaps.[11]
These sequential and significant institutional failures, particularly the Lehman bankruptcy, involved further seizing of credit markets and more serious global impact. The interconnected nature of Lehman was such that its failure triggered system-wide (systemic) concerns regarding the ability of major institutions to honor their obligations to counterparties. The interest rates banks charged to each other (see the TED spread) increased to record levels and various methods of obtaining short-term funding became less available to non-financial corporations.[11]
It was this "credit freeze" that some described as a near-complete seizing of the credit markets in September that drove the massive bailout procedures implemented by worldwide governments in Q4 2008. Prior to that point, each major U.S. institutional intervention had been ad-hoc; critics argued this damaged investor and consumer confidence in the U.S. government's ability to deal effectively and proactively with the crisis. Further, the judgment and credibility of senior U.S. financial leadership was called into question.[11]
Since the near-meltdown, the crisis has shifted into what some consider to be a deep recession and others consider to be a "reset" of economic activity at a lower level, now that enormous lending capacity has been removed from the system. Unsustainable U.S. borrowing and consumption were significant drivers of global economic growth in the years leading up to the crisis. Record rates of housing foreclosures are expected to continue in the U.S. during the 2009-2011, continuing to inflict losses on financial institutions. Dramatically reduced wealth due to both housing prices and stock market declines are unlikely to enable U.S. consumption to return to pre-crisis levels.[12]
Thomas Friedman summarized how the crisis has moved through stages:
When these reckless mortgages eventually blew up, it led to a credit crisis. Banks stopped lending. That soon morphed into an equity crisis, as worried investors liquidated stock portfolios. The equity crisis made people feel poor and metastasized into a consumption crisis, which is why purchases of cars, appliances, electronics, homes and clothing have just fallen off a cliff. This, in turn, has sparked more company defaults, exacerbated the credit crisis and metastasized into an unemployment crisis, as companies rush to shed workers.[13]
Alan Greenspan has stated that until the record level of housing inventory currently on the market declines to more typical historical levels, there will be downward pressure on home prices. As long as the uncertainty remains regarding housing prices, mortgage-backed securities will continue to decline in value, placing the health of banks at risk.[14]
The subprime mortgage crisis in context
Economist Nouriel Roubini wrote in January 2009 that subprime mortgage defaults triggered the broader global credit crisis, but were part of multiple credit bubble collapses: "This crisis is not merely the result of the U.S. housing bubble’s bursting or the collapse of the United States’ subprime mortgage sector. The credit excesses that created this disaster were global. There were many bubbles, and they extended beyond housing in many countries to commercial real estate mortgages and loans, to credit cards, auto loans, and student loans.[15]
There were bubbles for the securitized products that converted these loans and mortgages into complex, toxic, and destructive financial instruments. And there were still more bubbles for local government borrowing, leveraged buyouts, hedge funds, commercial and industrial loans, corporate bonds, commodities, and credit-default swaps." It is the bursting of the many bubbles that he believes are causing this crisis to spread globally and magnify its impact.[15]
Fed Chairman Ben Bernanke summarized the crisis as follows during a January 2009 speech:
"For almost a year and a half the global financial system has been under extraordinary stress--stress that has now decisively spilled over to the global economy more broadly. The proximate cause of the crisis was the turn of the housing cycle in the United States and the associated rise in delinquencies on subprime mortgages, which imposed substantial losses on many financial institutions and shook investor confidence in credit markets. However, although the subprime debacle triggered the crisis, the developments in the U.S. mortgage market were only one aspect of a much larger and more encompassing credit boom whose impact transcended the mortgage market to affect many other forms of credit. Aspects of this broader credit boom included widespread declines in underwriting standards, breakdowns in lending oversight by investors and rating agencies, increased reliance on complex and opaque credit instruments that proved fragile under stress, and unusually low compensation for risk-taking. The abrupt end of the credit boom has had widespread financial and economic ramifications. Financial institutions have seen their capital depleted by losses and writedowns and their balance sheets clogged by complex credit products and other illiquid assets of uncertain value. Rising credit risks and intense risk aversion have pushed credit spreads to unprecedented levels, and markets for securitized assets, except for mortgage securities with government guarantees, have shut down. Heightened systemic risks, falling asset values, and tightening credit have in turn taken a heavy toll on business and consumer confidence and precipitated a sharp slowing in global economic activity. The damage, in terms of lost output, lost jobs, and lost wealth, is already substantial."[16]
Thomas Friedman summarized the causes of the crisis in November 2008:
Governments are having a problem arresting this deflationary downward spiral — maybe because this financial crisis combines four chemicals we have never seen combined to this degree before, and we don’t fully grasp how damaging their interactions have been, and may still be. Those chemicals are: 1) massive leverage — by everyone from consumers who bought houses for nothing down to hedge funds that were betting $30 for every $1 they had in cash; 2) a world economy that is so much more intertwined than people realized, which is exemplified by British police departments that are financially strapped today because they put their savings in online Icelandic banks — to get a little better yield — that have gone bust; 3) globally intertwined financial instruments that are so complex that most of the C.E.O.’s dealing with them did not and do not understand how they work — especially on the downside; 4) a financial crisis that started in America with our toxic mortgages. When a crisis starts in Mexico or Thailand, we can protect ourselves; when it starts in America, no one can. You put this much leverage together with this much global integration with this much complexity and start the crisis in America and you have a very explosive situation.[17]
Subprime market data
The value of U.S. subprime mortgages was estimated at $1.3 trillion as of March 2007,[18] with over 7.5 million first-lien subprime mortgages outstanding.[19] Approximately 16% of subprime loans with adjustable rate mortgages (ARM) were 90-days delinquent or in foreclosure proceedings as of October 2007, roughly triple the rate of 2005.[20] By January 2008, the delinquency rate had risen to 21%[21] and by May 2008 it was 25%.[22]
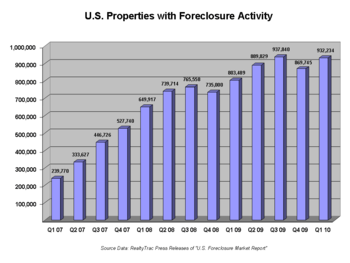
Between 2004 and 2006 the share of subprime mortgages relative to total originations ranged from 18%-21%, versus less than 10% in 2001-2003 and during 2007.[23][24] Subprime ARMs only represent 6.8% of the loans outstanding in the US, yet they represent 43% of the foreclosures started during the third quarter of 2007.[25] During 2007, nearly 1.3 million properties were subject to 2.2 million foreclosure filings, up 79% and 75% respectively versus 2006. Foreclosure filings including default notices, auction sale notices and bank repossessions can include multiple notices on the same property.[26]
During 2008, this increased to 2.3 million properties, an 81% increase over 2007.[27] Between August 2007 and September 2008, an estimated 851,000 homes were repossessed by lenders from homeowners.[28] Foreclosures are concentrated in particular states both in terms of the number and rate of foreclosure filings.[29] Ten states accounted for 74% of the foreclosure filings during 2008; the top two (California and Florida) represented 41%. Nine states were above the national foreclosure rate average of 1.84% of households.[30]

The mortgage market is estimated at $12 trillion[31] with approximately 6.41% of loans delinquent and 2.75% of loans in foreclosure as of August 2008.[32] The estimated value of subprime adjustable-rate mortgages (ARM) resetting at higher interest rates is U.S. $400 billion for 2007 and $500 billion for 2008. Reset activity is expected to increase to a monthly peak in March 2008 of nearly $100 billion, before declining.[33] An average of 450,000 subprime ARM are scheduled to undergo their first rate increase each quarter in 2008.[34]
An estimated 8.8 million homeowners (nearly 10.8% of the total) have zero or negative equity as of March 2008, meaning their homes are worth less than their mortgage. This provides an incentive to "walk away" from the home, despite the credit rating impact.[35]
By January 2008, the inventory of unsold new homes stood at 9.8 months based on December 2007 sales volume, the highest level since 1981.[36] Further, a record of nearly four million unsold existing homes were for sale,[37] including nearly 2.9 million that were vacant.[38] This excess supply of home inventory places significant downward pressure on prices. As prices decline, more homeowners are at risk of default and foreclosure. According to the S&P/Case-Shiller price index, by November 2007, average U.S. housing prices had fallen approximately 8% from their Q2 2006 peak[39] and by May 2008 they had fallen 18.4%.[40] The price decline in December 2007 versus the year-ago period was 10.4% and for May 2008 it was 15.8%.[41] Housing prices are expected to continue declining until this inventory of surplus homes (excess supply) is reduced to more typical levels.
Household debt statistics
In 1981, US private debt was 123 per cent of gross domestic product (a measure of the size of the economy); by the third quarter of 2008, it was 290 per cent. In 1981, household debt was 48 per cent of GDP; in 2007, it was 100 per cent.[42]
While housing prices were increasing, consumers were saving less[43] and both borrowing and spending more. A culture of consumerism is a factor "in an economy based on immediate gratification."[44] Starting in 2005, American households have spent more than 99.5% of their disposable personal income on consumption or interest payments.[45] If imputations mostly pertaining to owner-occupied housing are removed from these calculations, American households have spent more than their disposable personal income in every year starting in 1999.[46]
Household debt grew from $705 billion at year-end 1974, 60% of disposable personal income, to $7.4 trillion at yearend 2000, and finally to $14.5 trillion in midyear 2008, 134% of disposable personal income.[47] During 2008, the typical USA household owned 13 credit cards, with 40% of households carrying a balance, up from 6% in 1970.[48] U.S. home mortgage debt relative to GDP increased from an average of 46% during the 1990s to 73% during 2008, reaching $10.5 trillion.[49]
Financial sector debt statistics
Martin Wolf wrote: "In the US, the state of the financial sector may well be far more important than it was in Japan. The big US debt accumulations were not by non-financial corporations but by households and the financial sector. The gross debt of the financial sector rose from 22 per cent of GDP in 1981 to 117 per cent in the third quarter of 2008, while the debt of non-financial corporations rose only from 53 per cent to 76 per cent of GDP. Thus, the desire of financial institutions to shrink balance sheets may be an even bigger cause of recession in the US."[42]
Credit risk
Traditionally, lenders (who were primarily thrifts) bore the credit risk on the mortgages they issued. Over the past 60 years, a variety of financial innovations have gradually made it possible for lenders to sell the right to receive the payments on the mortgages they issue, through a process called securitization. The resulting securities are called mortgage-backed securities (MBS) and collateralized debt obligations (CDO). Most American mortgages are now held by mortgage pools, the generic term for MBS and CDOs. Of the $10.6 trillion of USA residential mortgages outstanding as of midyear 2008, $6.6 trillion were held by mortgage pools, and $3.4 trillion by traditional depository institutions.[50] This "originate to distribute" model means that investors holding MBS and CDOs also bear several types of risks, and this has a variety of consequences. In general, there are five primary types of risk:[51][52]
By the beginning of the 21st century, these innovations had created an "originate to distribute" model for mortgages, which means that mortgage became almost as much securities as they were loans. Because subprime loans have such high repayment risk, the origination of large volumes of subprime loans by thrift institutions or commercial banks was not possible without securitization.
From a systemic perspective, the dominance of securitization has made the risks of the mortgage market similar to the risks of other securities markets, particularly non-regulated securities markets. In general, there are five primary types of risk in these markets:[51][52][53]
| Name | Description |
|---|---|
| Credit risk | the risk that the borrower will fail to make payments and/or that the collateral behind the loan will lose value. |
| Asset price risk | the risk that asset itself (MBS or underlying mortgages in this case) will depreciate in value, resulting in financial losses, markdowns and possibly margin calls |
| Counterparty risk | the risk that a party to an MBS or derivative contract other than the borrower will be unable or unwilling to uphold their obligations. |
| Systemic risk | The aggregate effect of these and other risks has recently been called systemic risk, which refers to sudden perceptual, or material changes across the entire financial system, causing highly "correlated" behavior and possible damage to that system |
| Liquidity risk | At the institutional level, this is the risk that money in the system will dry up quickly and a business entity will be unable to obtain cash to fund its operations soon enough to prevent an unusual loss. |
This means that in the mortgage market, borrowers no longer have to default and reduce cash flows very significantly before credit risk rises sharply. Any number of factors affecting material or perceived risk - declines in the price of real estate or the bankruptcy of a major counterparty - can cause systemic risk and liquidity risk for institutions to rise and have significant adverse effect on the entire mortgage industry. The risk may be magnified by high debt levels (financial leverage) among households and businesses, as has incurred in recent years. Finally, the risks associated with American mortgage lending have global impacts because the market for MBS is a huge, global, financial market.
Of particular concern is the fairly new innovation of credit default swaps (CDS). Investors in MBS can insure against credit risk by buying CDS, but as risk rises, counterparties in CDS contracts have to deliver collateral and build up reserves in case more payments become necessary. The speed and severity with which risk rose in the subprime market created uncertainty across the system, with investors wondering whether huge CDS counterparties like AIG might be unable to honor their commitments.
Understanding the risks types involved in the subprime crisis
The reasons for this crisis are varied and complex.[54] Understanding and managing the ripple effect through the worldwide economy poses a critical challenge for governments, businesses, and investors. The crisis can be attributed to a number of factors, such as the inability of homeowners to make their mortgage payments; poor judgment by the borrower and/or the lender; and mortgage incentives such as "teaser" interest rates that later rise significantly.
Further, declining home prices have made re-financing more difficult. As a result of financialization and innovations in securitization, risks related to the inability of homeowners to meet mortgage payments have been distributed broadly, with a series of consequential impacts. There are five primary categories of risk involved:
- Credit risk: Traditionally, the risk of default (called credit risk) would be assumed by the bank originating the loan. However, due to innovations in securitization, credit risk is frequently transferred to third-party investors. The rights to mortgage payments have been repackaged into a variety of complex investment vehicles, generally categorized as mortgage-backed securities (MBS) or collateralized debt obligations (CDO). A CDO, essentially, is a repacking of existing debt, and in recent years MBS collateral has made up a large proportion of issuance. In exchange for purchasing MBS or CDO and assuming credit risk, third-party investors receive a claim on the mortgage assets and related cash flows, which become collateral in the event of default. Another method of safeguarding against defaults is the credit default swap, in which one party pays a premium and the other party pays them if a particular financial instrument defaults.
- Asset price risk: MBS and CDO asset valuation is complex and related "fair value" or "mark to market" accounting is subject to wide interpretation. The valuation is derived from both the collectibility of subprime mortgage payments and the existence of a viable market into which these assets can be sold, which are interrelated. Rising mortgage delinquency rates have reduced demand for such assets. Banks and institutional investors have recognized substantial losses as they revalue their MBS downward. Several companies that borrowed money using MBS or CDO assets as collateral have faced margin calls, as lenders executed their contractual rights to get their money back.[55] There is some debate regarding whether fair value accounting should be suspended or modified temporarily, as large write-downs of difficult-to-value MBS and CDO assets may have exacerbated the crisis.[56]
- Liquidity risk: Many companies rely on access to short-term funding markets for cash to operate (i.e., liquidity), such as the commercial paper and repurchase markets. Companies and structured investment vehicles (SIV) often obtain short-term loans by issuing commercial paper, pledging mortgage assets or CDO as collateral. Investors provide cash in exchange for the commercial paper, receiving money-market interest rates. However, because of concerns regarding the value of the mortgage asset collateral linked to subprime and Alt-A loans, the ability of many companies to issue such paper has been significantly affected.[57] The amount of commercial paper issued as of 18 October 2007 dropped by 25%, to $888 billion, from the 8 August level. In addition, the interest rate charged by investors to provide loans for commercial paper has increased substantially above historical levels.[58]
- Counterparty risk: Major investment banks and other financial institutions have taken significant positions in credit derivative transactions, some of which serve as a form of credit default insurance. Due to the effects of the risks above, the financial health of investment banks has declined, potentially increasing the risk to their counterparties and creating further uncertainty in financial markets. The demise and bailout of Bear Stearns was due in-part to its role in these derivatives.[59]
- Systemic risk: The aggregate effect of these and other risks has recently been called systemic risk. According to Nobel laureate Dr. A. Michael Spence, "systemic risk escalates in the financial system when formerly uncorrelated risks shift and become highly correlated. When that happens, then insurance and diversification models fail. There are two striking aspects of the current crisis and its origins. One is that systemic risk built steadily in the system. The second is that this buildup went either unnoticed or was not acted upon. That means that it was not perceived by the majority of participants until it was too late. Financial innovation, intended to redistribute and reduce risk, appears mainly to have hidden it from view. An important challenge going forward is to better understand these dynamics as the analytical underpinning of an early warning system with respect to financial instability."[60]
Effect on corporations and investors

Average investors and corporations face a variety of risks due to the inability of mortgage holders to pay. These vary by legal entity. Some general exposures by entity type include:
- Commercial / Depository bank corporations: The earnings reported by major banks are adversely affected by defaults on various asset types, including loans made for mortgages, credit cards, and auto loans. Companies value these assets (receivables) based on estimates of collections. Companies record expenses in the current period to adjust this valuation, increasing their bad debt reserves and reducing earnings. Rapid or unexpected changes in asset valuation can lead to volatility in earnings and stock prices. The ability of lenders to predict future collections is a complex task subject to a multitude of variables.[61] Additionally, a bank's mortgage losses may cause it to reduce lending or seek additional funds from the capital markets, if necessary to maintain compliance with capital reserve regulatory requirements. Many banks also bought mortgage-backed securities and suffered losses on these investments.
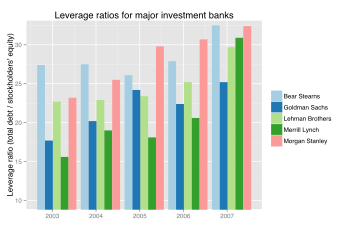
- Investment banks, mortgage lenders, and real estate investment trusts: These entities face similar risks to banks, yet do not have the stability provided by customer bank deposits. They have business models with significant reliance on the ability to regularly secure new financing through CDO or commercial paper issuance, borrowing short-term at lower interest rates and lending longer-term at higher interest rates (i.e., profiting from the interest rate "spread.") Such firms generated more profits the more leveraged they became (i.e., the more they borrowed and lent) as housing values increased. For example, investment banks were leveraged around 30 times equity, while commercial banks have regulatory leverage caps around 15 times equity. In other words, for each $1 provided by investors, investment banks would borrow and lend $30.[62] However, due to the decline in home values, the mortgage-backed assets many purchased with borrowed funds declined in value. Further, short-term financing became more expensive or unavailable. Such firms are at increased risk of significant reductions in book value owing to asset sales at unfavorable prices and many have filed bankruptcy or been taken over.[63]
- Insurance companies: Corporations such as AIG provide insurance products called credit default swaps, which are intended to protect against credit defaults, in exchange for a premium or fee. They are required to post a certain amount of collateral (e.g., cash or other liquid assets) to be in a position to provide payments in the event of defaults. The amount of capital is based on the credit rating of the insurer. Due to uncertainty regarding the financial position of the insurance company and potential risk of default events, credit agencies may downgrade the insurer, which requires an immediate increase in the amount of collateral posted. This risk-downgrade-post cycle can be circular and destructive across multiple firms and was a factor in the AIG bailout. Further, many major banks insured their mortgage-backed assets with AIG. Had AIG been allowed to go bankrupt and not pay these banks what it owed them, these institutions could have failed, causing risk to the entire financial system. Since September 2008, the U.S. government has since stepped in with $150 billion in financial support for AIG, much of which flows through AIG to the banks.[64][65]
- Special purpose entities (SPE): These are legal entities often created as part of the securitization process, to essentially remove certain assets and liabilities from bank balance sheets, theoretically insulating the parent company from credit risk. Like corporations, SPE are required to revalue their mortgage assets based on estimates of collection of mortgage payments. If this valuation falls below a certain level, or if cash flow falls below contractual levels, investors may have immediate rights to the mortgage asset collateral. This can also cause the rapid sale of assets at unfavorable prices. Other SPE called structured investment vehicles (SIV) issue commercial paper and use the proceeds to purchase securitized assets such as CDO. These entities have been affected by mortgage asset devaluation. Several major SIV are associated with large banks. SIV legal structures allowed financial institutions to remove large amounts of debt from their balance sheets, enabling them to use higher levels of leverage and increasing profitability during the boom period. As the value of the SIV assets was reduced, the banks were forced to bring the debt back onto their books, causing an immediate need for capital (to achieve regulatory minimums) thereby aggravating liquidity challenges in the banking system.[66] Some argue this shifting of assets off-balance sheet reduces financial statement transparency; SPE came under scrutiny as part of the Enron debacle, as well. Financing through off-balance sheet structures is thinly regulated. SIV and similar structures are sometimes referred to as the shadow banking system.[67]
- Investors: Stocks or bonds of the entities above are affected by the lower earnings and uncertainty regarding the valuation of mortgage assets and related payment collection. Many investors and corporations purchased MBS or CDO as investments and incurred related losses.
Understanding financial institution solvency
Critics have argued that due to the combination of high leverage and losses, the U.S. banking system is effectively insolvent (i.e., equity is negative or will be as the crisis progresses),[68] while the banks counter that they have the cash required to continue operating or are "well-capitalized." As the crisis progressed into mid-2008, it became apparent that growing losses on mortgage-backed securities at large, systemically-important institutions were reducing the total value of assets held by particular firms to a critical point roughly equal to the value of their liabilities.
A bit of accounting theory is helpful to understanding this debate. It is an accounting identity (i.e., an equality that must hold true by definition) that assets equals the sum of liabilities and equity. Equity consisted primarily of the common or preferred stock and the retained earnings of the company and is also referred to as capital. The financial statement that reflects these amounts is called the balance sheet.
If a firm is forced into a negative equity scenario, it is technically insolvent from a balance sheet perspective. However, the firm may have sufficient cash to pay its short-term obligations and continue operating. Bankruptcy occurs when a firm is unable to pay its immediate obligations and seeks legal protection to enable it to either re-negotiate its arrangements with creditors or liquidate its assets. Pertinent forms of the accounting equation for this discussion are shown below:
- Assets = Liabilities + Equity
- Equity = Assets - Liabilities = Net worth or capital
- Financial leverage ratio = Assets / Equity
If assets equal liabilities, then equity must be zero. While asset values on the balance sheet are marked down to reflect expected losses, these institutions still owe the creditors the full amount of liabilities. To use a simplistic example, Company X used a $10 equity or capital base to borrow another $290 and invest the $300 amount in various assets, which have fallen 10% in value to $270. This firm was "leveraged" 30:1 ($300 assets / $10 equity = 30) and now has assets worth $270, liabilities of $290 and equity of negative $20. Such leverage ratios were typical of the larger investment banks during 2007. At 30:1 leverage, it only takes a 3.33% loss to reduce equity to zero.
Banks use various regulatory measures to describe their financial strength, such as tier 1 capital. Such measures typically start with equity and then add or subtract other measures. Banks and regulators have been criticized for including relatively "weaker" or less tangible amounts in regulatory capital measures. For example, deferred tax assets (which represent future tax savings if a company makes a profit) and intangible assets (e.g., non-cash amounts like goodwill or trademarks) have been included in tier 1 capital calculations by some financial institutions. In other cases, banks were legally able to move liabilities off their balance sheets via structured investment vehicles, which improved their ratios. Critics suggest using the "tangible common equity" measure, which removes non-cash assets from these measures. Generally, the ratio of tangible common equity to assets is lower (i.e., more conservative) than the tier 1 ratio.[69]
Banks and governments have taken significant steps to improve capital ratios, by issuing new preferred stock to private investors or to the government via bailouts, and cutting dividends.
Understanding the events of September 2008
Liquidity risk and the money market funding engine

During September 2008, money market mutual funds began to experience significant withdrawals of funds by investors in the wake of the Lehman Brothers bankruptcy and AIG bailout. This created a significant risk because money market funds are integral to the ongoing financing of corporations of all types. Individual investors lend money to money market funds, which then provide the funds to corporations in exchange for corporate short-term securities called asset-backed commercial paper (ABCP).[70]
However, a potential bank run had begun on certain money market funds. If this situation had worsened, the ability of major corporations to secure needed short-term financing through ABCP issuance would have been significantly affected. To assist with liquidity throughout the system, the Treasury and Federal Reserve Bank announced that banks could obtain funds via the Federal Reserve's Discount Window using ABCP as collateral.[70]
To stop the potential run on money market mutual funds, the Treasury also announced on September 19 a new $50 billion program to insure the investments, similar to the Federal Deposit Insurance Corporation (FDIC) program for regular bank accounts.[71]
Key risk indicators
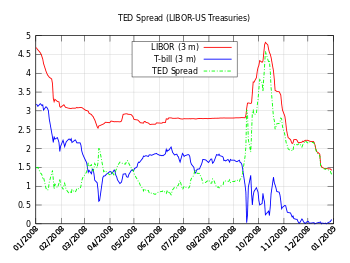
Key risk indicators became highly volatile during September 2008, a factor leading the U.S. government to pass the Emergency Economic Stabilization Act of 2008. The “TED spread” is a measure of credit risk for inter-bank lending. It is the difference between: 1) the risk-free three-month U.S. treasury bill (t-bill) rate; and 2) the three-month London Interbank Borrowing Rate (LIBOR), which represents the rate at which banks typically lend to each other. A higher spread indicates banks perceive each other as riskier counterparties. The t-bill is considered "risk-free" because the full faith and credit of the U.S. government is behind it; theoretically, the government could just print money so investors get their money back at the maturity date of the t-bill.
The TED Spread reached record levels in late September 2008. The diagram indicates that the Treasury yield movement was a more significant driver than the changes in LIBOR. A three-month t-bill yield so close to zero means that people are willing to forego interest just to keep their money (principal) safe for three months—a very high level of risk aversion and indicative of tight lending conditions. Driving this change were investors shifting funds from money market funds (generally considered nearly risk free but paying a slightly higher rate of return than t-bills) and other investment types to t-bills.[72]
In addition, an increase in LIBOR means that financial instruments with variable interest terms are increasingly expensive. For example, adjustable rate mortgages, car loans and credit card interest rates are often tied to LIBOR; some estimate as much as $150 trillion in loans and derivatives are tied to LIBOR.[73] Higher interest rates place additional downward pressure on consumption, increasing the risk of recession.
Credit default swaps and the subprime mortgage crisis
Credit defaults swaps (CDS) are insurance contracts, typically used to protect bondholders from the risk of default, called credit risk. As the financial health of banks and other institutions deteriorated due to losses related to mortgages, the likelihood that those providing the insurance would have to pay their counterparties increased. This created uncertainty across the system, as investors wondered which companies would be forced to pay to cover defaults.
For example, Company Alpha issues bonds to the public in exchange for funds. The bondholders pay a financial institution an insurance premium in exchange for it assuming the credit risk. If Company Alpha goes bankrupt and is unable to pay interest or principal back to its bondholders, the insurance company would pay the bondholders to cover some or all of the losses. In effect, the bondholder has "swapped" its credit risk with the insurer. CDS may be used to insure a particular financial exposure as described in the example above, or may be used speculatively. Because CDS may be traded on public exchanges like stocks, or may be privately negotiated, the exact amount of CDS contracts outstanding at a given time is difficult to measure. Trading of CDS increased 100-fold from 1998 to 2008. Estimates for the face value of debt covered by CDS contracts range from U.S. $33 to $47 trillion as of November 2008.[74]
Many CDS cover mortgage-backed securities or collateralized debt obligations (CDO) involved in the subprime mortgage crisis. CDS are lightly regulated. There is no central clearinghouse to honor CDS in the event a key player in the industry is unable to perform its obligations. Required corporate disclosure of CDS-related obligations has been criticized as inadequate. Insurance companies such as AIG, MBIA, and Ambac faced ratings downgrades due to their potential exposure due to widespread debt defaults. These institutions were forced to obtain additional funds (capital) to offset this exposure. In the case of AIG, its nearly $440 billion of CDS linked to CDO resulted in a U.S. government bailout.[74]
In theory, because credit default swaps are two-party contracts, there is no net loss of wealth. For every company that takes a loss, there will be a corresponding gain elsewhere. The question is which companies will be on the hook to make payments and take losses, and will they have the funds to cover such losses. When investment bank Lehman Brothers went bankrupt in September 2008, it created a great deal of uncertainty regarding which financial institutions would be required to pay off CDS contracts on its $600 billion in outstanding debts.[75][76] Significant losses at investment bank Merrill Lynch due to "synthetic CDO" (which combine CDO and CDS risk characteristics) played a prominent role in its takeover by Bank of America.[77]
Effect on the Money Supply
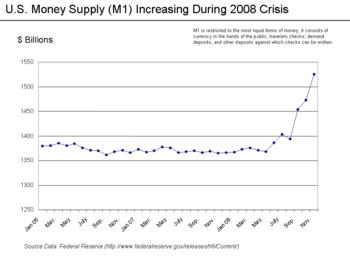
One measure of the availability of funds (liquidity) can be measured by the money supply. During late 2008, the most liquid measurement of the U.S. money supply (M1) increased significantly as the government intervened to inject funds into the system.
The focus on managing the money supply has been de-emphasized in recent history as inflation has moderated in developed countries. Historically, a sudden increase in the money supply might result in an increase in interest rates to ward off inflation or inflationary expectations.[78]
Should the U.S. government create large quantities of money to help it purchase toxic mortgage-backed securities and other poorly-performing assets from banks, there is risk of inflation and dollar devaluation relative to other countries. However, this risk is of less concern to the Fed than deflation and stagnating growth as of December, 2008.[79] Further, the dollar has strengthened as other countries have lowered their own interest rates during the crisis. This is because demand for a currency is typically proportional to interest rates; lowering interest rates lowers demand for a currency and thus it declines relative to other currencies.
During a January 2009 speech, Fed Chairman Ben Bernanke described the strategy of lending against various types of collateral as "Credit Easing" and explained the risks of inflation as follows: "Some observers have expressed the concern that, by expanding its balance sheet, the Federal Reserve is effectively printing money, an action that will ultimately be inflationary. The Fed's lending activities have indeed resulted in a large increase in the excess reserves held by banks. Bank reserves, together with currency, make up the narrowest definition of money, the monetary base; as you would expect, this measure of money has risen significantly as the Fed's balance sheet has expanded. However, banks are choosing to leave the great bulk of their excess reserves idle, in most cases on deposit with the Fed. Consequently, the rates of growth of broader monetary aggregates, such as M1 and M2, have been much lower than that of the monetary base. At this point, with global economic activity weak and commodity prices at low levels, we see little risk of inflation in the near term; indeed, we expect inflation to continue to moderate."[16]
Vicious Cycles

Cycle One: Housing Market
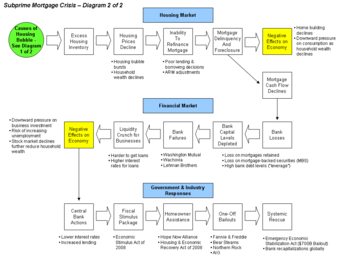
The first vicious cycle is within the housing market and relates to the feedback effects of payment delinquencies and foreclosures on home prices. By September 2008, average U.S. housing prices had declined by over 20% from their mid-2006 peak.[80][81]
This major and unexpected decline in house prices means that many borrowers have zero or negative equity in their homes, meaning their homes were worth less than their mortgages. As of March 2008, an estimated 8.8 million borrowers — 10.8% of all homeowners — had negative equity in their homes, a number that is believed to have risen to 12 million by November 2008. Borrowers in this situation have an incentive to "walk away" from their mortgages and abandon their homes, even though doing so will damage their credit rating for a number of years.[82]
The reason is that unlike what is the case in most other countries, American residential mortgages are non-recourse loans; once the creditor has regained the property purchased with a mortgage in default, he has no further claim against the defaulting borrower's income or assets. As more borrowers stop paying their mortgage payments, foreclosures and the supply of homes for sale increase. This places downward pressure on housing prices, which further lowers homeowners' equity. The decline in mortgage payments also reduces the value of mortgage-backed securities, which erodes the net worth and financial health of banks. This vicious cycle is at the heart of the crisis.[83]
Cycle Two: Financial Market and Feedback into Housing Market
The second vicious cycle is between the housing market and financial market. Foreclosures reduce the cash flowing into banks and the value of mortgage-backed securities (MBS) widely held by banks. Banks incur losses and require additional funds (“recapitalization”). If banks are not capitalized sufficiently to lend, economic activity slows and unemployment increases, which further increases foreclosures.
As of August 2008, financial firms around the globe have written down their holdings of subprime related securities by US$501 billion.[84] Mortgage defaults and provisions for future defaults caused profits at the 8533 USA depository institutions insured by the FDIC to decline from $35.2 billion in 2006 Q4 billion to $646 million in the same quarter a year later, a decline of 98%. 2007 Q4 saw the worst bank and thrift quarterly performance since 1990. In all of 2007, insured depository institutions earned approximately $100 billion, down 31% from a record profit of $145 billion in 2006. Profits declined from $35.6 billion in 2007 Q1 to $19.3 billion in 2008 Q1, a decline of 46%.[85][86]
Federal Reserve data indicates banks have significantly tightened lending standards throughout the crisis.[87]
Understanding the shadow banking system
A variety of non-bank entities have emerged through financial innovation over the past two decades to become a critical part of the credit markets. These entities are often intermediaries between banks or corporate borrowers and investors and are called the shadow banking system. These entities were not subject to the same disclosure requirements and capital requirements as traditional banks. As a result, they became highly leveraged while making risky bets, creating what critics have called a significant vulnerability in the underpinnings of the financial system.
These entities also borrowed short-term, meaning they had to go back to the proverbial well frequently for additional funds, while purchasing long-term, illiquid (hard to sell) assets. When the crisis hit and they could no longer obtain short-term financing, they were forced to sell these long-term assets into very depressed markets at fire-sale prices, making credit more difficult to obtain system-wide. The 1998 Long-term Capital Management crisis was a precursor to this aspect of the current crisis, as a highly leveraged shadow banking entity with systemic implications collapsed during that crisis.
In a June 2008 speech, U.S. Treasury Secretary Timothy Geithner, then President and CEO of the NY Federal Reserve Bank, placed significant blame for the freezing of credit markets on a "run" on the entities in the "parallel" banking system, also called the shadow banking system. These entities became critical to the credit markets underpinning the financial system, but were not subject to the same regulatory controls. Further, these entities were vulnerable because they borrowed short-term in liquid markets to purchase long-term, illiquid and risky assets. This meant that disruptions in credit markets would make them subject to rapid deleveraging, selling their long-term assets at depressed prices.[88]
He described the significance of these entities: "In early 2007, asset-backed commercial paper conduits, in structured investment vehicles, in auction-rate preferred securities, tender option bonds and variable rate demand notes, had a combined asset size of roughly $2.2 trillion. Assets financed overnight in triparty repo grew to $2.5 trillion. Assets held in hedge funds grew to roughly $1.8 trillion. The combined balance sheets of the then five major investment banks totaled $4 trillion. In comparison, the total assets of the top five bank holding companies in the United States at that point were just over $6 trillion, and total assets of the entire banking system were about $10 trillion." He stated that the "combined effect of these factors was a financial system vulnerable to self-reinforcing asset price and credit cycles."[88]
Nobel laureate economist Paul Krugman described the run on the shadow banking system as the "core of what happened" to cause the crisis. "As the shadow banking system expanded to rival or even surpass conventional banking in importance, politicians and government officials should have realized that they were re-creating the kind of financial vulnerability that made the Great Depression possible—and they should have responded by extending regulations and the financial safety net to cover these new institutions. Influential figures should have proclaimed a simple rule: anything that does what a bank does, anything that has to be rescued in crises the way banks are, should be regulated like a bank." He referred to this lack of controls as "malign neglect."[89]
References
- ↑ FDIC-Guidance for Subprime Lending
- ↑ President's Address to the Nation
- ↑ McLean, Bethany and Joe Nocera, All the Devils Are Here: The Hidden History of the Financial Crisis Portfolio, Penguin, 2010, p.82, 83, 86, 89, 144
- ↑ Resisting Corporate Corruption: Cases in Practical Ethics From Enron Through ...| By Stephen V. Arbogast| Wiley
- ↑ Financial Crisis Inquiry Report, p.74-75
- ↑ McLean, Bethany and Joe Nocera, All the Devils Are Here, the Hidden History of the Financial Crisis Portfolio, Penguin, 2010, p.144
- ↑ The Big Short, Michael Lewis, p.23
- 1 2 3 Have Wall Street banks gone subprime at the wrong time?
- ↑ Frontline-Inside the Meltdown
- ↑ Wachovia & Wamu
- 1 2 3 Frontline - Inside the Meltdown
- ↑ Roubini-10 Risks to Global Growth
- ↑ Friedman, Thomas L. (2008-11-16). "Gonna Need a Bigger Boat". The New York Times. Retrieved 2010-05-24.
- ↑ Greenspan Op Ed WSJ
- 1 2 Roubini - More Doom Ahead
- 1 2 Bernanke Speech - January 13 2009
- ↑ NYT Friedman - We're Gonna Need a Bigger Boat
- ↑ "How severe is subprime mess?". msnbc.com. Associated Press. 2007-03-13. Retrieved 2008-07-13.
- ↑ Ben S. Bernanke (2007-05-17). The Subprime Mortgage Market (Speech). Chicago, Illinois. Retrieved 2008-07-13.
- ↑ Ben S. Bernanke (2007-10-17). The Recent Financial Turmoil and its Economic and Policy Consequences (Speech). New York, New York. Retrieved 2008-07-13.
- ↑ Ben S. Bernanke (2008-01-10). Financial Markets, the Economic Outlook, and Monetary Policy (Speech). Washington, D.C. Retrieved 2008-06-05.
- ↑ Bernanke, Ben S (2008-05-05). Mortgage Delinquencies and Foreclosures (Speech). Columbia Business School's 32nd Annual Dinner, New York, New York. Retrieved 2008-05-19.
- ↑
- ↑ Harvard Report
- ↑ "Delinquencies and Foreclosures Increase in Latest MBA National Delinquency Survey" (Press release). Mortgage Bankers Association. 2007-06-12. Retrieved 2008-07-13.
- ↑ "U.S. FORECLOSURE ACTIVITY INCREASES 75 PERCENT IN 2007". RealtyTrac. 2008-01-29. Retrieved 2008-06-06.
- ↑ Realty Trac-2008 Data
- ↑ CNN - Realty Trac Data
- ↑ NY Post - The Foreclosure Five
- ↑ Realty-Trac 2008 Foreclosure Report
- ↑ NY Times
- ↑ MBA Survey
- ↑ Christie, Les (2007-10-17). "ARM resets peaking: Borrowers unprepared - Oct. 17, 2007". CNN. Retrieved 2008-05-19. Check date values in:
|year= / |date= mismatch(help) - ↑ "FRB: Testimony--Chairman Bernanke on the economic situation and outlook--8 November 2007". 2008. Retrieved 2008-05-19.
- ↑ Negative Equity
- ↑ "New home sales fell by record amount in 2007 - Real estate - MSNBC.com". 2008. Retrieved 2008-05-19.
- ↑ "Housing Meltdown". 2008. Retrieved 2008-05-19.
- ↑ Vacant homes 2.9MM
- ↑ "America's economy – Getting worried downtown". The Economist. 2007-11-15. Retrieved 2008-05-19. Check date values in:
|year= / |date= mismatch(help) - ↑ Case Shiller Data File
- ↑ Case Shiller Index May 2008
- 1 2 FT-Wolf Japan's Lessons
- ↑ Bureau of Economic Analysis - Personal Savings Chart
- ↑ Lasch, Christopher. "The Culture of Consumerism". Consumerism. Smithsonian Center for Education and Museum Studies. p. 1. Retrieved 2008-09-15.
- ↑ Bureau of Economic Analysis, NIPA, Table 2.9, 100 - line 46.
- ↑ Bureau of Economic Analysis, NIPA, Table 7.12, line 90.
- ↑ Z.1 Historical Tables (1974) and current Z.1 release (2008), Table B.100, lines 31,48.
- ↑ "Zakaria: A More Disciplined America | Newsweek Business | Newsweek.com". Newsweek.com. Retrieved 2008-10-24.
- ↑ Fortune-The $4 trillion housing headache
- ↑ Board of Governors of the Federal Reserve System, Release Z.1, 9/19/08. Table 218, lines 2, 11-13, 18, 19. At midyear 2008, securitized home equity loans amounted to a mere $56 billion (line 26).
- 1 2 Staff writer (9 October 2008). "Special report: The world economy: When fortune frowned". The Economist. Retrieved 24 October 2008.
- 1 2 Blackburn, Robin (March–April 2008). "The Subprime Crisis". New Left Review. New Left Review. II (50).
- ↑ "Lessons from the Crisis". pimco.com. PIMCO. 26 November 2008. Archived from the original on 27 May 2010.
- ↑ "FT.com / Video & Audio / Interactive graphics - Credit squeeze explained". 2008. Retrieved 2008-05-19.
- ↑ Case Study-Mortgage Company Risk Factors
- ↑ Daniel Gross (2008-04-01). "The Mark-to-Market Melee". Newsweek. Washington Post Company. Retrieved 2008-05-19.
- ↑ "Subprime mortgage woes infect commercial paper market - MarketWatch". 2008. Retrieved 2008-05-19.
- ↑ Neil Unmack (2007-10-18). "Rhinebridge Commercial Paper SIV May Not Repay Debt (Update1)". New York City, United States: Bloomberg L.P. Retrieved 2008-07-13.
- ↑ "The $2 bail-out". The Economist. London: The Economist Group. 2008-03-19. Retrieved 2008-05-19.
- ↑ PIMCO - Lessons from the Crisis
- ↑ "BofA: The Credit Crunch Takes Its Toll". 2008. Retrieved 2008-05-19.
- ↑ Leverage Info
- ↑ Business Week - Lehman & Merrill Lynch
- ↑ Time Magazine - Financial Madness
- ↑ AIG-Fortune Magazine-$150 Billion Was Just the Beginning
- ↑ "SIVs, next shoe to drop in global credit crisis? - International Business Times -". 2008. Archived from the original on 2008-02-25. Retrieved 2008-05-19.
- ↑ Blackburn - Subprime crisis
- ↑ Roubini-The U.S. Financial System is Effectively Insolvent-March 2009
- ↑ Fox News - E Mac Discussion of Citibank
- 1 2 WSJ Article - Bailout of Money Funds
- ↑ Diya Gullapalli and Shefali Anand. Bailout of Money Funds Seems to Stanch Outflow. The Wall Street Journal. Markets. 2008-09-20. Retrieved 2008-09-25
- ↑ WSJ Article
- ↑ Markewatch Article - LIBOR Jumps to Record
- 1 2 Bloomberg-Credit Swap Disclosure Obscures True Financial Risk
- ↑ AP - Lehman Debt Auction Gives Clue to Potential Losses
- ↑ Lehman 10Q May 08
- ↑ NYT - How the Thundering Herd Faltered and Fell
- ↑ Fed-Money Supply Explanation
- ↑ Fed Release December 16
- ↑ Case Shiller Index
- ↑ Economist-A Helping Hand to Homeowners
- ↑ Andrews, Edmund L.; Uchitelle, Louis (2008-02-22). "Negative Equity". The New York Times. Retrieved 2010-05-24.
- ↑ NYT - How to Help People Whose Homes are Underwater
- ↑ "Bloomberg.com: Worldwide". Bloomberg.com. Retrieved 2008-10-26.
- ↑ "FDIC Quarterly Profile Q1 08" (PDF).
- ↑ "FDIC Profile FY 2007 Pre-Adjustment" (PDF).
- ↑ Banks Tighten Lending Standards
- 1 2 Geithner-Speech Reducing Systemic Risk in a Dynamic Financial System
- ↑ Krugman, Paul (2009). The Return of Depression Economics and the Crisis of 2008. W.W. Norton Company Limited. ISBN 978-0-393-07101-6.
External links
- PBS Frontline - Inside the Meltdown
- Schneiderman, R.M; Philip Caulfield; Celena Fang; Elisabeth Goodridge; Vikas Bajaj (2008-09-15). "How a Market Crisis Unfolded: Some of the key events in the upheaval.". New York Times. Retrieved 2008-09-17. (Graphic and interactive timeline.)
- Cooper, George (2008). The Origin of Financial Crises: Central banks, credit bubbles and the efficient market fallacy. Petersfield, Hampshire, U.K.: Harriman House. p. 208. ISBN 978-1-905641-85-7.
- "Fannie, Freddie and Henry". Wall Street Journal. 2008-09-09. Retrieved 2008-09-09. (Interactive timeline of Treasury Secretary Paulson's changing policy actions in relation to Fannie Mae and Freddie Mac – requires Flash.)
- Milken Institute, Demystifying the Mortgage Meltdown: Slideshow, October 2, 2008.