Stereoscopic acuity
Stereoscopic acuity, also stereoacuity, is the smallest detectable depth difference that can be seen in binocular vision.
Specification and measurement
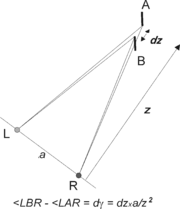
Stereoacuity [1] is most simply explained by considering one of its earliest test, a two-peg device, named Howard-Dolman test after its inventors:[2] The observer is shown a black peg at a distance of 6m (=20 feet). A second peg, below it, can be moved back and forth until it is just detectably nearer than the fixed one. Stereoacuity is this difference in the two positions, converted into an angle of binocular disparity, i.e., the difference in their binocular parallax.
Conversion to the angle of disparity dγ is performed by inserting the position difference dz in the formula

where a is the interocular separation of the observer and z the distance of the fixed peg from the eye. To transfer dγ into the usual unit of minutes of arc, a multiplicative constant c is inserted whose value is 3437.75 (1 radian in arcminutes). In the calculation a, dz and z must be in the same units, say, feet, inches, cm or meters. For the average interocular distance of 6.5 cm, a target distance of 6m and a typical stereoacuity of 0.5 minute of arc, the just detectable depth interval is 8 cm. As targets come closer, this interval gets smaller by the inverse square of the distance, so that an equivalent detectable depth interval at ¼ meter is 0.01 cm or the depth of impression of the head on a coin. These very small values of normal stereoacuity, expressed in differences of either object distances, or angle of disparity, makes it a hyperacuity.
Tests of stereoacuity
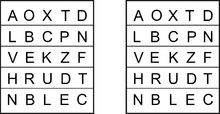
Since the Howard-Dolman test described above is cumbersome, stereoacuity is usually measured using a stereogram in which separate panels are shown to each eye by superimposing them in a stereoscope using prisms or goggles with color or polarizing filters or alternating occlusion (for a review see ). A good procedure is a chart, analogous to the familiar Snellen visual acuity chart, in which one letter in each row differs in depth (front or behind) sequentially increasing in difficulty. For children the fly test is ideal: the image of a fly is transilluminated by polarized light; wearing polarizing glasses the wing appears at a different depth and allows stereopsis to be demonstrated by trying to pull on it.
Expected performance
There is no equivalent in stereoacuity of the normal 20/20 visual acuity standard. In every case, the numerical score, even if expressed in disparity angle, depends to some extent on the test being used. Superior observers under ideal conditions can achieve 0.1 arc min or even better.
The distinction between screening for the presence of stereopsis and a measurement of stereoacuity is valuable. To ascertain that depth can be seen in a binocular views, a test must be easily administered and not subject to deception. The random-dot stereogram is used widely for this purpose and has the advantage that for the uninitiated the object shape is unknown. It is made of random small pattern elements; depth can be created only in multiples of elements and therefore may not reach the small threshold disparity which is the purpose of stereoacuity measurements.
A population study revealed a surprisingly high incidence of good stereoacuity:.[3] Out of 188 biology students, 97.3% could perform at 2.3 minutes of arc or better.
Factors influencing stereoacuity
Optimum stereoacuity requires that the following mitigating factors be avoided:
- Low contrast [4]
- Short duration exposures (less than 500 milliseconds) [5]
- Fuzzy or closely spaced pattern elements.[5]
- Uncorrected or unequally corrected refractive errors (monovision)
Perceptual training in stereopsis
More than other such visual capabilities, the limits of stereopsis depend on the observer's familiarity with the situation. Stereo thresholds almost always improve, often several-fold, with training [6] and involve perceptual factors, differing in their particulars for each test.[7] This is most vividly evident in the time it takes to "solve" a random-dot stereogram rapidly decreases between the first exposure and subsequent views [8]
See also
References
- ↑ Howard IP, Rogers BJ (2002) Seeing in Depth. Vol. 1I. Chapter 19 Porteous, Toronto
- ↑ Howard HJ (1919) A test for the judgment of distance. Amer. J. Ophthalmol., 2, 656-675
- ↑ Coutant BE(1993) Population distribution of stereoscopic ability. Ophthalmic Physiol Opt, 13, 3-7.
- ↑ Westheimer G, Pettet MW (1990) Contrast and duration of exposure differentially affect vernier and stereoscopic acuity. Proc R Soc Lond B Biol Sci, 241, 42-6
- ↑ The Ferrier Lecture (1994) Seeing depth with two eyes: stereopsis. Proc R Soc Lond B Biol Sci, 257, 205-14
- ↑ Fendick M, Westheimer G. (1983) Effects of practice and the separation of test targets on foveal and peripheral stereoacuity. Vision Research, 23, 145-50
- ↑ McKee SP, Taylor DG (2010) The precision of binocular and monocular depth judgments in natural settings. J. Vision, 10, 5
- ↑ Harwerth RS, Rawlings SC (1977) Viewing time and stereoscopic threshold with random-dot stereograms. Am J Optom Physiol Opt, 54, 452-457.