State College Area School District
| State College Area School District | |
|---|---|
|
"We are the future!" | |
| Location | |
|
State College, Pennsylvania United States | |
| District information | |
| Type | Public |
| Superintendent | Robert O'Donnell; $197,500 + additional $10,000 403b |
| Budget | $146,985,66(2016–17) [1] |
| Students and staff | |
| Students | 6,750 |
| Teachers | 634 in 2016 [2] |
| Staff | approximately 1,410 |
| District mascot | The Little Lion |
| Colors | Maroon & Gray |
| Other information | |
| Per pupil spending | $15,467 (2010) |
| Per pupil spending | $21,629 (2016) |
| Tuition | for nonresident and charter school students ES $11,343.06, HS- 12,296.17 [3] |
| Website | State College Area School District |
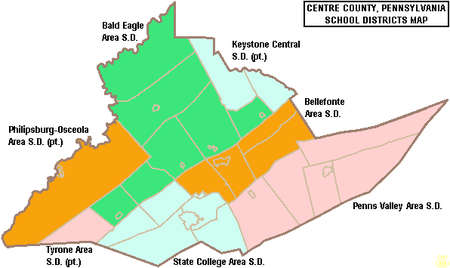
The State College Area School District (SCASD) is a large, suburban/rural public school district based in State College, Pennsylvania that serves students and includes public schools in the Borough of State College, Pennsylvania, and the surrounding townships of College, Ferguson, Halfmoon, Harris, and Patton. State College Area School District encompasses approximately 150 square miles (390 km2). According to 2008 local census data, the district served a resident population of 86,106. Per District officials, the State College Area School District provided basic educational services to 6,750 pupils as of June 2016 (down from 7,096 pupils in 2010). The district employs about 634 teachers, 720 full-time and part-time support personnel, and 40 administrators. State College Area School District received more than $16.9 million in state funding (15 percent of budget) in school year 2007-08. The State College Area School District provides schooling for approximately 6,750 students in the 2015-16 school year.[4] The District is the third largest employer in Centre County. It is governed by a Board of Directors consisting of nine members. Each board member is elected for a four-year term of office. The SCASD is a member of seven demographically similar school districts in Pennsylvania. The cohort includes: Abington, Cumberland Valley, Lower Merion, North Allegheny, Parkland, State College Area, and Tredyffrin-Easttown school districts. About 20 percent (569 students) of the district's 8,100 school age K-12 student base are now enrolled in alternative (private, parochial, and charter) schools.
This district operates nine elementary schools, three secondary schools (two middle schools and one high school), and four public charter schools.
Academic achievement
State College Area School District was ranked 40th out of 498 Pennsylvania school districts in 2016, by the Pittsburgh Business Times. State College ranked 4th of the seven cohort districts. The ranking was based on the last three years of student academic performance on the PSSAs for: reading, mathematics, science and writing. .[5] The PSSAs are given to all children in grades 3rd through 8th and the 11th grade in high school. Adapted examinations are given to children in the special education programs. The 2016 The Niche Survey, using more comprehensive criteria than the Pittsburgh Business Times, also rated State College 4th within the seven-district cohort, 15 in Pennsylvania, and 121 nationally. Browse Niche.com for specific rating criteria.
In 2015, the Pittsburgh Business Times (PBT) also reported an Overachievers Ranking for 500 Pennsylvania school districts. State College Area School District ranked 243 a significant drop from a range of 105 to 113 between 2011 and 2014. [9] The editor describes the ranking as: "a ranking answers the question - which school districts do better than expectations based upon economics? This rank takes the Honor Roll rank and adds the percentage of students in the district eligible for free and reduced-price lunch into the formula. The PBT opines, a district finishing high on this rank is smashing expectations, and any district above the median point is exceeding expectations."[10]
In 2016, the academic achievement as measured by the Pennsylvania Department of Education annual proficiency assessment—the Pennsylvania System of School Assessment (PSSA) -- of the students of State College Area School District was in the 82nd percentile of Pennsylvania's 500 school districts. Scale (0-99; 100 is state best).[11]
In 2010 and 2011, State College Area School District achieved AYP status under the federal No Child Left Behind Act.[12] In 2011, 94 percent of all 500 Pennsylvania Public School Districts achieved the No Child Left Behind Act progress level of 72% of students reading on grade level and 67% of students demonstrating on grade level math. In 2011, 46.9 percent of Pennsylvania school districts achieved Adequate Yearly Progress (AYP) based on student performance. An additional 37.8 percent of school districts made AYP based on a calculated method called safe harbor, 8.2 percent on the growth model and 0.8 percent on a two-year average performance. However in 2011-12 three SCASD schools had AYP warnings thus detracting from the superior school rating. Data from 2011 to 2016 has not been made available by the SCASD. Data for 2015 may be found at http://www.scasd.org/cms/lib5/PA01000006/Centricity/Domain/80/annual%20report%202014-15%20main%205-6.pdf
Graduation rate
In 2015, the State College Area School District reported a graduation rate of 97.5%.[13] http://www.scasd.org/cms/lib5/PA01000006/Centricity/Domain/80/annual%20report%202014-15%20main%205-6.pdfBy contrast US News and World Report 2016 Best High Schools ratings using Pennsylvania Department of Education data reported a SCASD 2015 graduation rate of 93 percent. The Pennsylvania Data Center and Department of Education report a SCASD 2015 total graduation rate of 91 percent for the 4-year cohort, 95 percent for 5-year cohort, and 95.5 percent for 6-year cohort. The 4-year cohort is the standard used for reporting graduation rates in Pennsylvania. http://www.education.pa.gov/Data-and-Statistics/Pages/Cohort-Graduation-Rate-.aspx Confused? So are many parents. In plain English, the SCASD has a graduation rate of 91 percent for those students attending four years of high school. The SCASD does not explain its 97.5 graduation rate.
The Pennsylvania Department of Education introduced cohort graduation rates in 2010-11. The cohort graduation rates are a calculation of the percentage of students who have graduated with a regular high school diploma within a designated number of years since the student first entered high school. The rate is determined for a cohort of students who all entered any high school for the first time during the same school year. The Pennsylvania Department of Education, Division of Data Quality, compiles statistical information covering the 4-Year, 5-Year, and 6-Year Graduation Rates for Pennsylvania public schools. Pennsylvania's public high schools provide the graduate and enrollment data through the Pennsylvania Information Management System (PIMS), which is used to calculate the above rates. However, for three sequential audits, 2010, 2013, and 2015 by the Pennsylvania Auditor General, the SCASD has been cited for PIMS deficiencies. Contact the SCASD or the Auditor General for copies of the audit reports.
Below are the graduation rates contained in the Pennsylvania Department of Education, Data and Statistics, Cohort Graduation Rates, 4-year cohort.
- 2015 - 91%
- 2014 - 93%
- 2013 - 94%
- 2012 - 93%
- 2011 - 96%
- 2010 - 93%
- 2009 - 95.7% [14]
- 2008 - 95% [15]
- 2007 - 94% [16]
State College Area High School
In 2015 the high school had an ADM enrollment of 2,358 students (a decrease of 180 over five years). In 2012, State College Area High School was in Warning status due to lagging achievement in reading and mathematics. There is no indication that the warning has been removed.[17] In 2011, the school was in Warning status due to lagging achievement of special education students and English language learners. The school achieved AYP. In 2010, the school was AYP status [18] In 2010, the school reported 2,538 pupils grades 9th through 12th. Three hundred twenty-eight students qualified for a federal free or reduced-priced lunch. The school employed 203 teachers.[19] In 2012 the High School Administration reported that 4 teachers were rated "non-Highly Qualified" under No Child Left Behind and 2 teachers had emergency certifications. U.S. News & World Report (USN&WR) rankings of Best High Schools 2016 in Pennsylvania and nationally ranked State College below 228 (the cut off score for high college readiness) in Pennsylvania and not qualified for ranking nationally. USN&WR used Pennsylvania Department of Education data: http://www.usnews.com/education/best-high-schools) . The primary reason was a college readiness score of 28 of 100 possible points. Other cohort high schools scored between 33 and 61 points.
Test scores below from: http://www.scasd.org/cms/lib5/PA01000006/Centricity/Domain/80/annual%20report%202014-15%20main%205-6.pdf
11th Grade Reading
- 2015 - PSSA not reported
- 2014 - not reported
- 2013 - not reported
- 2012 - 84% on grade level, (7% below basic). State - 67% of 11th graders are on grade level.[20]
- 2011 - 83% (6% below basic). State - 69.1% [21]
- 2010 - 86%, (7% below basic). State - 66% [22]
- 2009 - 75% (12% below basic), State - 65% [23]
- 2008 - 81% (9% below basic), State - 65% [24]
- 2007 - 83% (8% below basic), State - 65% [25]
11th Grade Math:
- 2015 - not reported
- 2014 - not reported
- 2013 - not reported
- 2012 - 80% on grade level (9% below basic). In Pennsylvania, 59% of 11th graders are on grade level.[26]
- 2011 - 79%, (8% below basic). State - 60.3%.
- 2010 - 78%, (10% below basic). State - 59%
- 2009 - 69%, (14% below basic). State - 56%.
- 2008 - 78%, (11% below basic), State - 56% [27]
- 2007 - 76%, (11% below basic), State - 53%
11th Grade Science:
- 2015 - not reported
- 2014 - not reported
- 2013 - not reported
- 2012 - 67% on grade level (8% below basic). State - 42% of 11th graders were on grade level.[28]
- 2011 - 65% (8% below basic). State - 40% [29]
- 2010 - 68% (6% below basic). State - 39%
- 2009 - 62% (7% below basic). State - 40% [30]
- 2008 - 62%, State - 39%
SAT scores
- 2015 - The District's Critical Reading average Score was 550. The Math average score was 568. The Writing average score was 526.
- 2014 - not reported
- 2013 - not reported
In 2012, 525 State College Area School District students took the SAT exams. The District's Verbal Average Score was 556. The Math average score was 572. The Writing average score was 537. The statewide Verbal SAT exams results were: Verbal 491, Math 501, Writing 480. In the USA, 1.65 million students took the exams achieving scores: Verbal 496, Math 514, Writing 488. According to the College Board the maximum score on each section was 800, and 360 students nationwide scored a perfect 2,400.
In 2011, 555 State College Area High School students took the SAT exams. The district's Verbal Average Score was 548. The Math average score was 585. The Writing average score was 537.[31] Pennsylvania ranked 40th among state with SAT scores: Verbal - 493, Math - 501, Writing - 479.[32] In the United States 1.65 million students took the exam in 2011. They averaged 497 (out of 800) verbal, 514 math and 489 in writing.[33]
College remediation rate
Data for 2010 to 2015 not reported. According to a Pennsylvania Department of Education study released in January 2009, 21% of the State College Area High School graduates required remediation in mathematics and or reading before they were prepared to take college level courses in the Pennsylvania State System of Higher Education or community colleges.[34] Less than 66% of Pennsylvania high school graduates, who enroll in a four-year college in Pennsylvania, will earn a bachelor's degree within six years. Among Pennsylvania high school graduates pursuing an associate degree, only one in three graduate in three years.[35] Per the Pennsylvania Department of Education, one in three recent high school graduates who attend Pennsylvania's public universities and community colleges takes at least one remedial course in math, reading or English.
Middle schools
The SCASD has two middle schools. Here are the ratings at Niche.com based on Pennsylvania Department of Education reports. The 2015 rating shows ratings of each school respectively within Pennsylvania and 16,371 middle schools nationally and the percent total subject area proficiency. Park Forest (24 Pennsylvania/73 nationally) 73 percent. Mount Nittany (25/163) 85 percent. Note: Mount Nittany was rated higher than Park Forest in proficiency but not overall. Go here to see how rankings were determined: https://k12.niche.com/rankings/public-middle-schools/best-overall/s/pennsylvania/
Mount Nittany Middle School is located at 656 Brandywine Drive, State College. It serves 713 pupils grades 6th through 8th. One hundred twenty students qualified for a free or reduced-price lunch due to family poverty. The school employed 69 teachers.[36] According to a report by the Pennsylvania Department of Education, 100% of its teachers were rated "Highly Qualified" under No Child Left Behind.[37]
In 2012, Mount Nittany Middle School declined to "Warning" status due to lagging student achievement in reading and math. In 2010 and 2011, the Middle School achieved AYP status under No Child Left Behind.[38] Data for 2013 to 2015 not reported.
PSSA Results:
|
8th Grade Reading:
|
8th Grade Math:
|
8th Grade Science:
- 2015 - not reported
- 2014 - not reported
- 2013 - not reported
- 2012 - 78% on grade level (8% below basic). State - 59%
- 2011 - 82% (5% below basic). State – 58.3%
- 2010 - 78% (6% below basic). State – 57% [45]
- 2009 - 78% (9% below basic). State - 55% [46]
|
7th Grade Reading:
|
7th Grade Math:
|
|
6th Grade Reading:
|
6th Grade Math:
|
Park Forest Middle School is located at 2180 School Drive, State College. It serves 840 pupils grades 6th through 8th. One hundred twenty five students qualified for a free or reduced-price lunch due to family poverty. The school employed 68 teachers.[47] In 2010 and 2011 the school achieved AYP status under No Child LEft Behind.[48] According to a report by the Pennsylvania Department of Education, 100% of its teachers were rated "Highly Qualified" under No Child Left Behind.[49]
PSSA Results:
|
8th Grade Reading:
|
8th Grade Math:
|
8th Grade Science:
- 2015 - not reported
- 2014 - not reported
- 2013 - not reported
- 2012 - 82% on grade level (7% below basic). State - 59%
- 2011 - 74% (13% below basic). State – 58.3%
- 2010 - 85% (6% below basic). State – 57% [54]
- 2009 - 77% (10% below basic). State - 55% [55]
|
7th Grade Reading:
|
7th Grade Math:
|
|
6th Grade Reading:
|
6th Grade Math:
|
2015 Elementary Schools Consolidated—Reading: Grade 3 (81.1 percent), Grade 4 (80.5 percent), Grade 5 (84.3 percent). Math: Grade 3 (72.3 percent), Grade 4 (67.8 percent), Grade 5 (65.5 percent).
Keystone state mandated end-of-course Assessments: Algebra 1 (85.16 percent), Biology (82.52 percent), English literature (grade 11) (83.86 percent).
National Recognition
The district's balanced academic competitiveness, accreditation, recognition for excellence, instructional expenditures, and small class size have received national acknowledgment. State College Area High School earned a silver medal in U.S. News and World Report's premiere ranking of the nation's best high schools in 2008 and was rated one of the "Top High Schools in the Country" by Newsweek magazine in 2007. In 2016 State College Area High School did not earn any medals in the U.S. News and World Report's premiere ranking of the nation's best high schools. Rather U.S. News & World Report Rankings of Best High Schools 2016 in Pennsylvania and nationally ranks State College below 228 of 650 high schools in Pennsylvania and not qualified for ranking nationally. USN&WR used Pennsylvania Department of Education data: http://www.usnews.com/education/best-high-schools)
State High Renovation Controversy
There is a debate between school board members and an organization named State High Vision (SHV). The school board plans High School Facilities Plan to demolish one of the high school buildings and disintegrate the other. The school board believes this is the most cost effective option and that they have looked at all of the options. State High Vision, an organization of some community citizens, claims that the plan was decided on with little community input. SHV also doesn’t like the creation of what they deem a mega-school (3,400 students in one building), claiming that students learn better in a smaller environment. About 200 students held walk outs in protest of the renovation project in 2007. Eric Topp provides a comprehensive description of the hullabaloo and opined incompetence by the school board at: http://www.erictopp.net/5.html State College Area School District in Pennsylvania several years ago abandoned plans to build a new high school. In May 2011 the district received notice that it owed $10 million to the Royal Bank of Canada for skipping an interest payment on money it never borrowed for a school it didn't build. The State College case has an unusual twist reported by the Wall Street Journal. the district agreed to swap interest rates before it borrowed the money, called a forward swap; it filed a lawsuit in a U.S. district court saying their ignorance made the contract void. The district skipped its first payment—for $978,000. Royal Bank of Canada says the school authorized the debt—even if it never borrowed money for the project—and that the swap is valid. The court agreed. The SCASD earned the distinction of approving the only forward SWAP by a school district in Pennsylvania and probably in the nation. It was a failed attempt to circumvent the then new Pennsylvania Act 1 (2006) requiring public referendum for excessive constructive spending.. They did this despite advice from financial advisors not to. Read more: School District, Bank in Swap Clash, The Wall Street Journal, May 24, 2011, http://www.wsj.com/articles/SB10001424052702303654804576341772921133838
High School Referendum
In May 2014 State College voters approved by public referendum and as required by Pennsylvania Act 1 (2006) to incur debt of $85 million over 30 years to rebuild the high school. The school board committed during public meetings urging support of the referendum that the cost would not exceed $115 million ($85 million debt plus $30 million capital reserve). During a March 28, 2016 school board meeting the total project cost was stated as $137,249,182, an increase of $7 million before construction has begun. http://www.centredaily.com/news/local/community/state-college/article68731897.html#navlink=SecList Other estimates projected a total cost of $143 million. In June 2016, with construction only beginning, the actual cost increased to $140 million (22 percent over budget). http://www.centredaily.com/news/local/education/article85942462.html#navlink=Lead Other estimates, by State College Watchdog, project a total cost of $150 million (30 percent over budget). The district superintendent Robert O'Donnell reportedly explained during a school board meeting on July 25th that the referendum was approved to pay for a concept not a project plan commitment of $115 million. The local newspaper, the Centre Daily Times printed an opinion article, "Don't Be Fooled" which accused the school district of strategic misrepresentation with respect to financial planning.http://www.centredaily.com/opinion/letters-to-the-editor/article115985388.html#navlink=Lead
Elementary schools
The SCASD has eight elementary schools. Here are the ratings at Nich.com based on Pennsylvania Department of Education reports. The 2015 rating shows ratings of each school respectively within Pennsylvania and 53,705 elementary schools nationally, the percent total subject area proficiency. All schools were rated A+. Corl Street (44 Pennsylvania/312 nationally) 90 percent. Radio Park (55/409) 84 percent. Easterly Parkway (61/486) 82 percent. Houserville/Lemont (63/502) 87 percent. Ferguson Township (65/504) 87 percent. Grays Woods (77/579) 87 percent. Mount Nittany (108/828) 77 percent. Park Forest (96/102) 81 percent. Go here to see how rankings were determined: https://k12.niche.com/rankings/public-elementary-schools/best-overall/ Nevertheless, the SCASD school board in May and June
Mount Nittany Elementary School is located at 240 Villa Crest Drive, State College. According to the National Center for Education Statistics, in 2010, the school reported an enrollment of 322 pupils in grades kindergarten through 5th, with 88 pupils receiving a federal free or reduced-price lunch due to family poverty. The school employed 23 teachers, yielding a student–teacher ratio of 14:1.[58] According to a report by the Pennsylvania Department of Education, 100% of its teachers were rated "Highly Qualified" under No Child Left Behind.[59] In 2010 and 2011, Elementary School achieved AYP status.[60] In 2011, only 78% of the students were reading on grade level in grades 3rd through 5th. In math, 89% of the students in 3rd through 5th grades were on grade level and 57% scored advanced. In 4th grade science, 86% of the pupils were on grade level.[61] The school was permanently closed at the end of the 2010- 2011 school year. Students were reassigned to the new Mount Nittany Elementary School for the next school year. The building was sold to Saint Joseph's Catholic Academy in July 2011.[62]
Corl Street Elementary School is a neighborhood school located at 235 Corl Street, State College. According to the National Center for Education Statistics, in 2010, the school reported an enrollment of 259 pupils in grades kindergarten through 5th, with 33 pupils receiving a federal free or reduced-price lunch due to family poverty. Corl Street Elementary School has the highest Pennsylvania System of School Assessment scores in the SCASD and among the highest in Pennsylvania. In May 2016 the school board announced it may close this neighborhood school, prompting protests from parents and teachers. The school employed 17 teachers, yielding a student–teacher ratio of 15:1.[63] According to a report by the Pennsylvania Department of Education, 100% of its teachers were rated "Highly Qualified" under No Child Left Behind.[64] In 2010 through 2012, Corl Street Elementary School achieved AYP status.[65] In 2011, 89% of the students were reading on grade level in grades 3rd through 5th. In math, 96% of the students in 3rd through 5th grades were on grade level and 71% scored advanced. In 4th grade science, 100% of the pupils were on grade level.[66] In 2012, 92% of the students were reading on grade level in grades 3rd through 5th with 56%. In math, 97% of the students in 3rd through 5th grades were on grade level and 78% scored advanced. In 4th grade science, 98% of the pupils were on grade level with 80% achieving advanced.[67] For a neighborhood perspective read: "Keep Coral Street Promises" at: http://www.centredaily.com/opinion/letters-to-the-editor/article82658212.html#navlink=SecList
Easterly Parkway Elementary School is located at 234 Easterly Parkway, State College. According to the National Center for Education Statistics, in 2010, the school reported an enrollment of 360 pupils in grades kindergarten through 5th, with 87 pupils receiving a federal free or reduced-price lunch due to family poverty. The school employed 27 teachers, yielding a student–teacher ratio of 13:1.[68] According to a report by the Pennsylvania Department of Education, teachers were rated "Non‐Highly Qualified" under No Child Left Behind.[69] In 2012, Easterly Parkway ES declined to Warning AYP status. In 2010 and 2011, Easterly Parkway Elementary School achieved AYP status.[70] In 2011, 80% of the students were reading on grade level in grades 3rd through 5th. In math, 84% of the students in 3rd through 5th grades were on grade level and 55% scored advanced. In 4th grade science, 91% of the pupils were on grade level.[71] In 2012, only 77% of the students were reading on grade level in grades 3rd through 5th. In math, 85% of the students in 3rd through 5th grades were on grade level and 56% scored advanced. In 4th grade science, 88% of the pupils were on grade level.[72] The school has a very good program for children with disabilities.
Ferguson Township Elementary School is located at 215 West Main Street, Pine Grove Mills. According to the National Center for Education Statistics, in 2010, the school reported an enrollment of 320 pupils in grades kindergarten through 5th, with 56 pupils receiving a federal free or reduced-price lunch due to family poverty. The school employed 19 teachers, yielding a student–teacher ratio of 16:1.[73] According to a report by the Pennsylvania Department of Education, 100% of its teachers were rated "Highly Qualified" under No Child Left Behind.[74] In 2010 and 2011, Ferguson Township Elementary School achieved AYP status.[75] In 2011, 85% of the students were reading on grade level in grades 3rd through 5th. In math, 92% of the students in 3rd through 5th grades were on grade level and 66% scored advanced. In 4th grade science, 98% of the pupils were on grade level.[76] In 2012, 82% of the students were reading on grade level in grades 3rd through 5th. In math, 91% of the students in 3rd through 5th grades were on grade level and 64% scored advanced. In 4th grade science, 97% of the pupils were on grade level, with 66% achieving advanced.[77]
Grays Wood Elementary School is located at 60 Brackenbourne Drive, Port Matilda. According to the National Center for Education Statistics, in 2010, the school reported an enrollment of 405 pupils in grades kindergarten through 5th, with 38 pupils receiving a federal free or reduced-price lunch due to family poverty. The school employed 27 teachers, yielding a student–teacher ratio of 15:1.[78] According to a report by the Pennsylvania Department of Education, 100% of its teachers were rated "Highly Qualified" under No Child Left Behind.[79] In 2010 and 2011, Grays Wood Elementary School achieved AYP status.[80] In 2011, 86% of the students were reading on grade level in grades 3rd through 5th. In math, 92% of the students in 3rd through 5th grades were on grade level and 65% scored advanced. In 4th grade science, 94% of the pupils were on grade level.[81] In 2012, 84% of the students were reading on grade level in grades 3rd through 5th. In math, 91% of the students in 3rd through 5th grades were on grade level and 66% scored advanced. In 4th grade science, 95% of the pupils were on grade level, with 70% advanced.[82]
Houserville/Lemont Elementary School is located at 675 Elmwood Street, State College. According to the National Center for Education Statistics, in 2010, the school reported an enrollment of 360 pupils in grades kindergarten through 5th, with 57 pupils receiving a federal free or reduced-price lunch due to family poverty. The school employed 26 teachers, yielding a student–teacher ratio of 14:1.[83] According to a report by the Pennsylvania Department of Education, 100% of its teachers were rated "Highly Qualified" under the federal No Child Left Behind Act.[84] In 2010 and 2011, Houserville/Lemont Elementary School achieved AYP status.[85] In 2011, 84% of the students were reading on grade level in grades 3rd through 5th. In math, 93% of the students in 3rd through 5th grades were on grade level and 62% scored advanced. In 4th grade science, 89% of the pupils were on grade level.[86] In 2012, 82% of the students were reading on grade level in grades 3rd through 5th. In math, 92% of the students in 3rd through 5th grades were on grade level and 71% scored advanced. In 4th grade science, 94% of the pupils were on grade level, with 73% achieving advanced.[87]
Park Forest Elementary School is located at 2181 School Drive, State College. According to the National Center for Education Statistics, in 2010, the school reported an enrollment of 474 pupils in grades kindergarten through 5th, with 97 pupils receiving a federal free or reduced-price lunch due to family poverty. The school employed 35 teachers, yielding a student–teacher ratio of 13:1.[88] According to a report by the Pennsylvania Department of Education, 100% of its teachers were rated "Highly Qualified" under No Child Left Behind.[89] In 2011, Park Forest Elementary School achieved AYP status, while in 2010 the school was in Warning status due to lagging student achievement in reading and math.[90] In 2011, 81% of the students were reading on grade level in grades 3rd through 5th. In math, 86% of the students in 3rd through 5th grades were on grade level and 55% scored advanced. In 4th grade science, 91% of the pupils were on grade level.[91] In 2012, 81% of the students were reading on grade level in grades 3rd through 5th. In math, 89% of the students in 3rd through 5th grades were on grade level and 62% scored advanced. In 4th grade science, 88% of the pupils were on grade level.[92]
Radio Park Elementary School is located at 800 W Cherry Lane, State College. According to the National Center for Education Statistics, in 2010, the school reported an enrollment of 429 pupils in grades kindergarten through 5th, with 87 pupils receiving a federal free or reduced-price lunch due to family poverty. The school employed 31 teachers, yielding a student–teacher ratio of 13:1.[93] According to a report by the Pennsylvania Department of Education, 100% of its teachers were rated "Highly Qualified" under No Child Left Behind.[94] In 2010 and 2011, Radio Park Elementary School achieved AYP status.[95] In 2011, 85% of the students were reading on grade level in grades 3rd through 5th. In math, 92% of the students in 3rd through 5th grades were on grade level and 79% scored advanced. In 4th grade science, 94% of the pupils were on grade level with 69% achieving advanced.[96] In 2012, 80% of the students were reading on grade level in grades 3rd through 5th. In math, 91% of the students in 3rd through 5th grades were on grade level and 73% scored advanced. In 4th grade science, 86% of the pupils were on grade level with 62% advanced.[97]
District Wide Facilities Master Plan
In 2008 after the high school fiasco, the SCASD hired DeJong Inc. consultants, and with considerable input by the community, crafted a District Wide Facilities Master Plan to guide the district's building renovations in the coming years. Community emphasis and preference was to retain and refurbish neighborhood elementary schools as the top priority. Despite the excellence and wide acceptance of the 2008 Master Plan. District administrators and school board members had the plan rewritten in 2013 to favor closing smaller neighborhood schools, such as Corl Street and Lemont, in order to create larger consolidated elementary schools. The new plan was met with fierce opposition from the community. The local newspaper, the Centre Daily Times, archives provide details. Many residents contended that the proposals for mega elementary schools were costly, wasteful of valuable resources, and poorly envisioned for its historic properties. In particular, the proposal to close Lemont Elementary School , a splendid limestone structure from the 1930s in the historic village of Lemont, garnered community involvement. A group opposed to its closing has formed as the Friends of Lemont School to convince the District to remain committed to neighborhood schools and be respectful of its historic schools through rehabilitating them rather than abandoning them. In June 2016 the school board announced it will most likely close (called "repurpose" in education speak) neighborhood schools again despite protests from parents and teachers. Advocates speaking at high attendance public meetings emphasized that consolidating neighborhood schools contravened the 2008-09 District Wide Facilities Master Plan in which refurbishment of neighborhood schools was afforded top priority. Instead, in 2013, the priority was changed to building a mostly new high school (again exceeding the announced cost). Architects and new consultants were hired to sell the revised master plan. As of June, 2014 with construction only beginning, the announced cost increased from $115 to $140 million (an increase of $25 million or 22 percent). http://www.centredaily.com/news/local/education/article85942462.html#navlink=SecList
The $25 million high school cost overrun, as of June 2016, is more than half of the funds needed to refurbish all the elementary schools.
Special education
The SCASD has not reported information for this section since 2010. In December 2010, the district administration reported that 889 pupils or 12.3% of the district's pupils received Special Education services.[98][99]
In order to comply with state and federal laws, the school district engages in identification procedures to ensure that eligible students receive an appropriate educational program consisting of special education and related services, individualized to meet student needs. At no cost to the parents, these services are provided in compliance with state and federal law; and are reasonably calculated to yield meaningful educational benefit and student progress.[100] To identify students who may be eligible for special education, various screening activities are conducted on an ongoing basis. These screening activities include: review of group-based data (cumulative records, enrollment records, health records, report cards, ability and achievement test scores); hearing, vision, motor, and speech/language screening; and review by the Special Education administration. When screening results suggest that the student may be eligible, the District seeks parental consent to conduct a multidisciplinary evaluation. Parents who suspect their child is eligible may verbally request a multidisciplinary evaluation from a professional employee of the District or contact the Coordinator of Special Education.[101]
In 2010, the state of Pennsylvania provided $1,026,815,000 for special education services. The funds were distributed to districts based on a state policy which estimates that 16% of the district's pupils are receiving special education services. This funding is in addition to the state's basic education per pupil funding, as well as, all other state and federal funding.[102]
State College Area School District received a $3,221,641 supplement for special education services in 2010.[103] For the 2011-12 school year, all Pennsylvania public school districts received the same level of funding for special education that they received in 2010-11. This level funding is provided regardless of changes in the number of pupils who need special education services and regardless of the level of services the respective students required.[104]
SCASD Public Charter Schools
The first SCASD public charter school, Wonderland Charter School, began as a kindergarten in 1999 and in the last sixteen years expanded grade by grade to 5th grade and charter school status with over 100 total students in 2016 . Wonderland is routinely cited in legislative records as one of the best charter schools in Pennsylvania. The Pennsylvania Auditor General’s 2013 Performance Compliance Audit reported Wonderland 100 percent compliant with state charter school law. All prior Auditor General audits of Wonderland also reported 100 percent compliance. In each of the last fifteen years, the students mastered over 95% of their assigned academic objectives. Go here to read about curriculum and methodology: http://www.wonderlandcharter.com/ The SCASD now has four public charter schools: Centre Learning Community (over 100 students) http://www.clccharter.org/, Nittany Valley Charter School (48 students) http://www.nvcs.org/, and Young Scholars of Central Pennsylvania Charter School (344 students) http://new.yscp.org/web3/ Although the SCASD Delta Program (130 students) is not designated a charter school for all practical purposes it should be http://www.scasd.org/site/default.aspx?domainid=1444
SCASD traditional enrollment is decreasing while charter school enrollment is increasing! The SCASD average daily maintenance (ADM), or enrollment, as of October 1, 2005 (the department of education official measure date and method) was about 7,300, compared to 2015 with 6,700 K-12 students (minus 600 or minus 8.2 percent over ten years). The high school enrollment decreased from 2,700 to about 2,350 during the same period, minus 350 or 13 percent. In 2005 the SCASD enrolled 2,940 elementary students; by 2014-15 2,893 students were enrolled (minus 47 or minus1.6 percent). Moreover, in 2014-15 there were 505 5th graders but only 428 1st graders the same year. Further enrollment decrease is projected. The decline occurs during a period of about 3 percent average annual population growth in the school district. These numbers include students enrolled in district charter schools and the Delta Program. The Pennsylvania Department of Education, Bureau Data and Statistics provides this data. http://www.education.pa.gov/Data-and-Statistics/Pages/default.aspx About 16 percent of SCASD students belong to minority groups and the largest group is Asian. Asian students are the highest scoring on state performance tests.
Enrollment in district public charter, religious, and private schools increases every year since 1999. The increase from 2014-15 (1,443 students) to 2015-16 (1,544 students) is 7 percent. About 20 percent of the school district area's 8,100 K-12 student base now attend alternate schools. https://www.scribd.com/doc/238531651/State-College-Area-School-District-Criticism
Alternate schools in State College frequently purchase poorly maintained school buildings and transition them to fully functional charter and religious schools. They also build new buildings for considerably less cost per square foot than does the district. This occurs because the SCASD is required to pay union construction wage scale and charter schools are not. (Most construction in State College in non-union.)
The Pennsylvania Department of Education (PDE) determines per student cost by dividing the total expenditures for any school year by the ADM (enrollment). That cost includes debt service. (Most school districts, however, explain per student cost by dividing only instructional cost by enrollment.) The difference is significant. Using the PDE method, in 2016-17 the SCASD projects per student cost at over $21,000. (That is more than tuition at Pennsylvania State University, which among the most expensive public universities in the nation.)
The Pennsylvania School Boards Association (PSBA) opposes charter schools contending they are allocated funds by the state that are better allocated by school boards. The PSBA Education Research and Policy Center t presents their data in the "Costs of Charter and Cyber Schools:" https://www.psba.org/wp-content/uploads/2014/09/Charter_School_Funding-White-Paper_Update_2014.pdf The Pennsylvania Department of Education provides an explanation of charter school funding based on public law in "How Are Charter Schools Funded;" http://www.education.pa.gov/K-12/Charter%20Schools/Pages/Charter-School-Funding.aspx
In plain English, the district is required to pay the district's charter schools a per student allocation in an amount determined by the PDE and based on a formula using the district's revenue among other factors. http://thenotebook.org/articles/2015/04/24/how-are-charter-schools-funded-in-pa On April, 2016. that amount is $12,416 per non special education student and $25,125 per special education student. Yes, charter schools are required to enroll special needs students. The per charter student allocation in the SCASD is 58 percent of the district's per student cost of $21,000. The remaining 42 percent of the $21,000 is retained by the district as overhead and is used to provide administration and services such as transportation, athletic teams, and extracurricular membership. Those services are little used by charter students at the main campus. Nevertheless, the district argues that it really pays 82 percent of the charter student cost. The charter schools counter that because they provide before-and-after-school childcare services, most parents drive their children before and pickup after school bus service is available. Before and after school childcare, which also provides supervised homework completion, is in great demand at elementary schools. The SCASD charter schools provide this service within the $12,416 allocation or at a very low subsidized cost. By contrast the school district replies it cannot provide that service within the $21,000 cost per student. The district wants additional revenue to provide that service.
SCASD public charter schools pay for their own building, building services, all student administration costs, teacher compensation, field trips, expendables, and most provide before and after school care (early drop off, late pick up).
There are other reasons that charter schools appeal to some parents. Most SCASD charters use a variation of a teaching method called instructional system development or ISD requiring a teacher to identify the task, condition, and testing standard for each teaching module of every subject. This helps students who need more structure. In charter schools most homework is done in school with teacher supervision. Teacher unions rebel at the entire concept and prefer the so-called critical thinking concept. ISD, used correctly by design, actually improves critical thinking and is used increasingly in STEM courses. The military, modern industry, NASA, and Japanese schools among many others use ISD. ISD is not explained as a teaching methodology on the SCASD website. http://www.au.af.mil/au/awc/awcgate/doe/isd/paper.htm
There are now enough elementary students to fill two SCASD schools. As more SCASD students switch to charter schools, fewer staff can be justified for long-established schools. Charters in State College pay teacher salaries about $8,000 less per year. However, charters are permitted to award bonuses for meeting tested objectives. That appeals to some teachers but not to teacher unions.
The Pennsylvania State Education Association (teachers union), Pennsylvania School Boards Association and the Pennsylvania Association of School Business Officials are critics of charter schools in Pennsylvania.
A former SCASD school board president, circa 1998, publicly stated, "there will be no charter schools in the SCASD." She was wrong. Since 1998, the SCASD has lost every battle in the charter school war; every school board refusal to approve a charter is overturned; every Pennsylvania Department of Education Appeal Board decision is lost; every arbitration hearing is lost; and the district lost in Commonwealth Court. Over a hundred total confrontations all lost at great expense to taxpayers. Charter schools are thriving. https://www.scribd.com/doc/235148488/SCASD-Charter-School-War
Increasingly, local citizens challenge the professionalism of the school board's and district administration's peevish attitude toward its charter schools. Embracing charter schools, their innovative concepts, and their obvious appeal to many parents in this university-dominated school district is the better solution. The school board is encouraged to exploit the success of charter schools rather than flail at the exodus. The key is improving the climate and performance of average students. Parents are voting with their enrollment registrations — mega elementary schools are not the right direction. http://www.centredaily.com/opinion/letters-to-the-editor/article82658847.html#navlink=SecList
Budget
Pennsylvania public school districts budget and expend funds according to procedures mandated by the General Assembly and the Pennsylvania Department of Education (PDE). An annual operating budget is prepared by school district administrative officials. A uniform form is furnished by the PDE and submitted to the board of school directors for approval prior to the beginning of each fiscal year on July 1.
Under Pennsylvania’s Taxpayer Relief Act, Act 1 of the Special Session of 2006, all school districts of the first class A, second class, third class and fourth class must adopt a preliminary budget proposal. The proposal must include estimated revenues and expenditures and the proposed tax rates. This proposed budget must be considered by the Board no later than 90 days prior to the date of the election immediately preceding the fiscal year. The preliminary budget proposal must also be printed and made available for public inspection at least 20 days prior to its adoption. The board of school directors may hold a public hearing on the budget, but are not required to do so. The board must give at least 10 days’ public notice of its intent to adopt the final budget according to Act 1 of 2006.[105]
In 2012, the average teacher salary in State College Area School District was $65,014.98 a year, while the cost of the benefits teachers received was $17,818 per employee, for a total annual average teacher compensation of $82,833.[106] In 2011, the District employed 656 teachers with an average salary of $65,551 and a top salary of $169,000.[107]
In 2009, State College Area School District reported employing 796 teachers and administrators with a salary range of $45,000 to $152,300.The median salary was $64,625. Fifteen salaries exceeded $100,000 a year.[108] By 2011, the District employed 656 teachers and administrators, with the average teacher salary in State College Area School District at $64,211.89 a year, while the cost of the benefits the teachers receive at $15,233.03 per employee, for a total annual average teacher compensation of $79,444.92.[109] According to a study conducted at the American Enterprise Institute, in 2011, public school teachers’ total compensation is roughly 50 percent higher than they would likely receive in the private sector. The study found that the most generous benefits that teachers receive are not accounted for in many studies of compensation, including: pension, retiree health benefits and job security.[110][111]
In 2007, State College Area School District employed 555 teachers. The average teacher salary in the district was $57,450 for 180 days worked.[112] As of 2007, Pennsylvania ranked in the top 10 states in average teacher salaries. When adjusted for cost of living Pennsylvania ranked fourth in the nation for teacher compensation.[113] Additionally, the teachers received a defined benefit pension, health insurance, life insurance, professional development reimbursement, paid personal days, 10 paid sick days, and other benefits.[114]
Per pupil spending In 2008, State College Area School District per pupil spending was $13,633, (by 2016-2017 per pupil spending increased to about $21,600). Per pupil spending is correctly calculated by dividing total expenditures including debt service by average daily membership (enrollment). SCASD per pupil cost is ranked among the top 10 percent among 500 Pennsylvania public school districts.[115] In 2010 the per pupil spending had increased to $14,388.64.[116] Among the states, Pennsylvania’s total per pupil revenue (including all sources) ranked 11th at $15,023 per student, in 2008-09.[117] In 2007, the Pennsylvania per pupil total expenditures was $12,759.[118] In 2015-16 State College Area School District per pupil spending was $19,964 per student (projected total expenditures and Fund Balance of $135.7 million/ ADM enrollment of 6,800). Local taxpayers provide 85 percent of revenue (among the highest local levies in Pennsylvania), the state 15 percent, the federal government less than 1 percent.
State College Area School District administrative costs in 2008 were $729.62 per pupil. The lowest administrative cost per pupil in Pennsylvania was $398, in 2008.[119] The per pupil administrative cost for 2015-16 is about $1,236 among the highest of any district of similar size in Pennsylvania. The district provides an extensive benefit package to all administrators.[120] Superintendent of Schools, Dr. Richard Mextorf, resigned on December 4, 2010 as a result of a DUI arrest.[121] The acting Superintendent of Schools as Michael Hardy. In June 2011, the school board awarded a five-year contract to Dr. Robert J. O'Donnell as Superintendent with a starting salary of $169,000.[122] He was also given $20,000 for his expenses in relocating from Lancaster, Pennsylvania.[123] The salary was $15,000 more than the previous superintendent's contract. The Pennsylvania School Boards Association maintains statistics on salaries of public school district employees in Pennsylvania. According to the association's report, the average salary for a superintendent, for the 2007-08 school year, was $122,165. Superintendents and administrators receive a benefit package commensurate with that offered to the district's teachers' union.[124]
Reserves In 2008, State College Area School District reported no balance in an unreserved-designated fund. The unreserved-undesignated fund balance was reported as $10,049,629.[125] In 2010, State College Area Administration reported an increase to $8,000,000.00 in the unreserved-undesignated fund and $6,331,870.00 in its unreserved-undesignated fund. Pennsylvania school district reserve funds are divided into two categories – designated and undesignated. The undesignated funds are not committed to any planned project. Designated funds and any other funds, such as capital reserves, are allocated to specific projects. School districts are required by state law to keep 5 percent of their annual spending in the undesignated reserve funds to preserve bond ratings. According to the Pennsylvania Department of Education, from 2003 to 2010, as a whole, Pennsylvania school districts amassed nearly $3 billion in reserved funds.[126]
Audit In November 2010, the Pennsylvania Auditor General conducted a performance audit of the district. Several findings, including the lapsing of a professional certificate, which caused a subsidy forfeiture, were reported to the school board and administration.[127]
Tuition Students who live in the District's attendance area may choose to attend one of Pennsylvania's 157 public charter schools. A student living in a neighboring public school district or a foreign exchange student may seek admission to Area School District. For these cases, the Pennsylvania Department of Education sets an annual tuition rate for each school district. It is the amount the public school district pays to a charter school for each resident student that attends the charter and it is the amount a nonresident student's parents must pay to attend the District's schools. The 2012 tuition rates are Elementary School - $11,343.06, High School - $12,296.17.[128]
State College Area School District is funded by a combination of: a local earned income tax - 1.7%, a property tax, and a real estate transfer tax -0.5% (82 percent of total revenue), funding from the Commonwealth of Pennsylvania is 17 percent of budget and less than 1 percent from the federal government. Grants can provide an opportunity to supplement school funding without raising local taxes. Interest earnings on accounts also provide non tax income to the District. In the Commonwealth of Pennsylvania, pension income and Social Security income are exempted from state personal income tax and local earned income tax, regardless of the level of the individual’s personal wealth.[129] The average Pennsylvania public school teacher pension in 2011 exceeds $60,000 a year plus they receive federal Social Security benefits: both are free of Pennsylvania state income tax and local income tax, which funds local public schools.[130]
State basic education funding
For the 2013-14 school year, the State College Area School District received a 2.1% increase or $6,440,816 in Pennsylvania Basic Education Funding. This is $132,929 more than its 2012-13 state BEF to the District. Additionally, State College Area School District received $128,440 in Accountability Block Grant funding to focus on academic achievement and level funding for special education services. Among the public school districts in Centre County, Penns Valley Area School District received the highest percentage increase in BEF at 13.4%. The District has the option of applying for several other state and federal grants to increase revenues. The Commonwealth’s budget increased Basic Education Funding statewide by $123 million to over $5.5 billion. Most of Pennsylvania’s 500 public school districts received an increase of Basic Education Funding in a range of 0.9% to 4%. Eight public school districts received exceptionally high funding increases of 10% to 16%. The highest increase in state funding was awarded to Austin Area School District which received a 22.5% increase in Basic Education Funding.[131] The state funded the PSERS (Pennsylvania school employee pension fund) with $1,017,000,000 and Social Security payments for school employees of $495 million.[132]
For the 2012-13 school year, State College Area School District received $6,307,887.[133] The Governor's Executive Budget for 2012-2013 includes $9.34 billion for kindergarten through 12th grade public education, including $5.4 billion in basic education funding, which was an increase of $49 million over the 2011-12 budget. State College Area School District received $128,440 in Accountability Block Grant funding to focus on academic achievement.
In the 2011-12 school year, the State College Area School District received $6,307,887 in state Basic Education Funding.[134] Additionally, the District received $128,440 in Accountability Block Grant funding.[135] The Pennsylvania Department of Education reported that 1,220 pupils received a federal free and reduced-price lunch, due to the family meeting the federal poverty level.
For the 2010-11 school year, State College Area School District's state Basic Education Funding increased by 2% for an additional $128,371 and a total of $6,434,044. The greatest increase, in state Basic Education Funding, in Centre County, was a 5.71% increase awarded to Penns Valley Area School District. One hundred fifty school districts received the base 2% increase for 2010.[136] Kennett Consolidated School District in Chester County received the highest increase in the state at 23.65% increase in funding, for the 2010-11 school year. The amount of increase each school district receives was determined by the Governor and the Secretary of Education through the allocation set in the state budget proposal made in February each year.[137]
In the 2009-2010 budget year, the Commonwealth of Pennsylvania provided State College Area School District a 2% increase, in Basic Education Funding, for a total of $$6,434,044. Penns Valley Area School District received an 3.89% increase, while the other two Centre County districts also received increases above 3.5%. In Pennsylvania, over 15 school districts received Basic Education Funding increases in excess of 10% in 2009. Muhlenberg School District in Berks County received the highest with a 22.31% increase in basic education funding from the Commonwealth. Ninety school districts received the base 2% increase in 2009. The state's Basic Education Funding to the State College Area School District in 2008-09 was $6,307,886.53 [138] According to the Pennsylvania Department of Education, 1,011 students qualified for free or reduced-price lunch due to low family income in 2008.[139]
Accountability Block Grants
Beginning in 2004-2005, the state launched the Accountability Block Grant school funding. This program has provided $1.5 billion to Pennsylvania’s school districts. The Accountability Block Grant program requires that its taxpayer dollars are focused on specific interventions that are most likely to increase student academic achievement. These interventions include: teacher training, all-day kindergarten, lower class size K-3rd grade, literacy and math coaching programs that provide teachers with individualized job-embedded professional development to improve their instruction, before or after school tutoring assistance to struggling students. For 2010-11, the State College Area School District applied for and received $348,619 in addition to all other state and federal funding. The district used the funding to provide all-day kindergarten[140][141]
Classrooms for the Future grant
The Classroom for the Future state program provided districts with hundreds of thousands of extra state funding to buy laptop computers for each core curriculum high school class (English, Science, History, Math) and paid for teacher training to optimize the computers use. The program was funded from 2006-2009. State College Area School District was denied funding in 2006-07. In 2007-08 the district was awarded $693,767. In 2008-09, the district received an additional $124,566 for a total funding of $818,333. Of the 501 public school districts in Pennsylvania, 447 of them received Classrooms for the Future state grant awards.[142]
Other grants
State College Area School District did not participate in: Pennsylvania Department of Environmental Protection's Environmental Education annual grants, PA Science Its Elementary grants (discontinued effective with 2009-10 budget by Governor Rendell), Education Assistance Grants, 2012 Striving Readers Comprehensive Literacy grant, 2012 and 2013 Hybrid Learning Grants,[143] nor the federal 21st Century Learning grants.
Common Cents state initiative
The State College Area School Board chose to not permit the Pennsylvania Department of Education Common Cents program access to the district records. The program called for the state to audit the district, at no cost to local taxpayers, to identify ways the district could save tax dollars.[144] After the review of the information, the district was not required to implement the recommended cost savings changes.
Federal Stimulus funding
The State College Area School District received an extra $2,285,966 in ARRA - Federal Stimulus money to be used in specific programs like special education and meeting the academic needs of low-income students.[145] This funding was for 2009-10 to 2010-2011 school years.
Race to the Top grant
State College Area School District officials did not apply for the Race to the Top federal grant which would have brought the district millions of additional federal dollars for improving student academic achievement.[146] Participation required the administration, the school board and the local teachers' union to sign an agreement to prioritize improving student academic success. In Pennsylvania, 120 public school districts and 56 charter schools agreed to participate.[147] Pennsylvania was not approved in the first round of the grant. The failure of districts to agree to participate was cited as one reason that Pennsylvania was not approved. A second round of state Race to the Top application judging will occur in June 2010.[148]
Real estate taxes
The State College Area School Board set the 2016-17 property tax at 43.473 mills a plus 4.32 percent increase of the 2015-16 property tax. The 2015-16 increase set at 41.674 mills a plus 5.5 percent increase of the 2014-2015 tax. The 2014-2015 property taxes at 39.5056 mills.[149] A mill is $1 of tax for every $1,000 of a property's assessed value. Property taxes, in the Commonwealth of Pennsylvania, apply only to real estate - land and buildings. The property tax is not levied on cars, business inventory, or other personal property. Certain types of property are exempt from property taxes, including: places of worship, places of burial, private social clubs, charitable and educational institutions and government property. Irregular property reassessments have become a serious issue in the commonwealth as it creates a significant disparity in taxation within a community and across a region. Pennsylvania school district revenues are dominated by two main sources: 1) Property tax collections, which account for the vast majority (between 75-85%) of local revenues; and 2) Act 511 tax collections (Local Tax Enabling Act), which are around 15% of revenues for school districts.[150] The millage rate increased 34 percent in ten years (3.4 percent average) during the same period that inflation increased 1.95 percent
The average yearly property tax paid by Centre County residents amounts to about 3.34% of their yearly income. Centre County ranked 438th out of the 3143 United States counties for property taxes as a percentage of median income.[160] According to a report prepared by the Pennsylvania Department of Education, the total real estate taxes collected by all school districts in Pennsylvania rose from $6,474,133,936 in 1999-00 to $10,438,463,356 in 2008-09 and to $11,153,412,490 in 2011.[161] Property taxes in Pennsylvania are relatively high on a national scale. According to the Tax Foundation, Pennsylvania ranked 11th in the U.S. in 2008 in terms of property taxes paid as a percentage of home value (1.34%) and 12th in the country in terms of property taxes as a percentage of income (3.55%).[162]
Property tax relief
In 2011, the Homestead/Farmstead Property Tax Relief from gambling for the State College Area School District was $107 per approved permanent primary residence. Within the district, 13,305 property owners applied for the tax relief. In Centre County, the highest amount of tax relief in 2011, went to Bellefonte Area School District at $186.[163] The relief was subtracted from the total annual school property tax bill. Property owners apply for the relief through the county Treasurer's office. Farmers can qualify for a farmstead exemption on building used for agricultural purposes. The farm must be at least 10 contiguous acres and must be the primary residence of the owner. Farmers can qualify for both the homestead exemption and the farmstead exemption. As required by law, the Commonwealth’s Budget Secretary certified on April 15, 2011, that $612,100,000 in state-funded local tax relief will be awarded in 2011-2012.
In 2010, approved residents received $110 for 13,106 properties [164]
In 2009, the Homestead/Farmstead Property Tax Relief from gambling for the State College Area School District was $110 per approved permanent primary residence. In the district, 7,071 property owners applied for the tax relief. In Centre County, the highest amount of tax relief in 2009, went to Bellefonte Area School District at $198. The highest property tax relief, among Pennsylvania school districts, went to the residents of Chester Upland School District of Delaware County who received $632 per approved homestead.[165] In Cumberland County, 75.93% of eligible property owners applied for property tax relief in 2009.[166]
Additionally, the Pennsylvania Property Tax/Rent Rebate program is provided for low income Pennsylvanians aged 65 and older; widows and widowers aged 50 and older; and people with disabilities age 18 and older. The income limit is $35,000 for homeowners. The maximum rebate for both homeowners and renters is $650. Applicants can exclude one-half (1/2) of their Social Security income, so people who make substantially more than $35,000 may still qualify for a rebate. Individuals must apply annually for the rebate. This can be taken in addition to Homestead/Farmstead Property Tax Relief.[167]
Act 1 Adjusted index
The Act 1 of 2006 Index regulates the rates at which each school district can raise property taxes in Pennsylvania. Districts are not allowed to raise taxes above that index unless they allow voters to vote by referendum, or they seek an exception from the state Department of Education. The base index for the 2010-2011 school year is 1.4 percent, but it can be adjusted higher, depending on a number of factors, such as property values and the personal income of district residents. Act 1 included 10 exceptions, including: increasing pension costs, increases in special education costs, a catastrophe like a fire or flood, increasing rising health care costs for contracts in effect in 2006 or dwindling tax bases. The base index is the average of the percentage increase in the statewide average weekly wage, as determined by the PA Department of Labor and Industry, for the preceding calendar year and the percentage increase in the Employment Cost Index for Elementary and Secondary Schools, as determined by the Bureau of Labor Statistics in the U.S. Department of Labor, for the previous 12-month period ending June 30. For a school district with a market value/personal income aid ratio (MV/PI AR) greater than 0.4000, its index equals the base index multiplied by the sum of .75 and its MV/PI AR for the current year.[168]
The School District Adjusted Index for the State College Area School District 2006-2007 through 2011-2016-17.[169]
|
For the 2015-16, and 2015-17 budget years, the State College Area School board levied the maxim Act 1 permitted tax increase with exceptions of 5.5 and 4.32 percent respectively.
For the 2015-16 and 2015-17 budget years, the State College Area School board did not evidence any attempt to restrain increased spending.
For the 2013-14 budget year, State College Area School Board applied for one exception to exceed their Act 1 Index limit due to rapidly escalating teacher pension costs. For the school budget year 2013-14, 311 Pennsylvania public school districts adopted a resolution certifying that tax rates would not be increased above their index. Another 171 school districts adopted a preliminary budget leaving open the option of exceeded the Index limit. For the exception for pension costs, 89 school districts received approval to exceed the Index in full while others received a partial approval of their request. For special education costs, 75 districts received approval to exceed their tax limit. For the pension costs exception, 169 school districts received approval to exceed the Index. Eleven Pennsylvania public school districts received an approval for grandfathered construction debts.[175]
For the 2012-13 budget year, State College Area School Board applied for two exceptions to exceed the Act 1 Index: teacher pension costs and special education costs. For 2012-2013, 274 school districts adopted a resolution certifying that tax rates would not be increased above their index; 223 school districts adopted a preliminary budget leaving open the option of exceeded the Index limit. For the exception for pension costs, 194 school districts received approval to exceed the Index. For special education costs, 129 districts received approval to exceed the tax limit.[176]
For the 2011-12 school year, the State College Area School Board applied for 2 exceptions to exceed the Act 1 Index: pension costs and special education costs. Each year, the State College Area School Board has the option of adopting either 1) a resolution in January certifying they will not increase taxes above their index or 2) a preliminary budget in February. A school district adopting the resolution may not apply for referendum exceptions or ask voters for a tax increase above the inflation index. A specific timeline for these decisions is publisher each year by the Pennsylvania Department of Education.[177]
According to a state report, for the 2011-2012 school year budgets, 247 school districts adopted a resolution certifying that tax rates would not be increased above their index; 250 school districts adopted a preliminary budget. Of the 250 school districts that adopted a preliminary budget, 231 adopted real estate tax rates that exceeded their index. Tax rate increases in the other 19 school districts that adopted a preliminary budget did not exceed the school district’s index. Of the districts who sought exceptions 221 used the pension costs exemption and 171 sought a Special Education costs exemption. Only 1 school district sought an exemption for Nonacademic School Construction Project, while 1 sought an exception for Electoral debt for school construction.[178]
In 2010-11, State College Area School Board applied for 2 exceptions to exceed the Act 1 index for the budget: pension costs and special education costs.[179]
State College Area School Board also did not apply for exceptions to exceed the Act 1 index for the budget in 2009-10.[180] In the Spring of 2010, 135 Pennsylvania school boards asked to exceed their adjusted index. Approval was granted to 133 of them and 128 sought an exception for pension costs increases.[181]
Extracurriculars
The district offers an extensive extracurricular program for elementary through high school students, including: clubs, activities and sports. Eligibility is determined by school board policy.[182][183] The district's athletics programs are under the Pennsylvania Interscholastic Athletic Association.[184] Constraints on spending have been considered as an art of controlling costs district wide.[185] The district made cuts in its extensive intramural programs in 2011.[186]
By Pennsylvania law, all K-12 students in the district, including those who attend a private nonpublic school, cyber charter school, charter school and those homeschooled, are eligible to participate in the extracurricular programs, including all athletics. They must meet the same eligibility rules as the students enrolled in the district's schools.[187][188]
Sports
The District funds:
|
|
- Middle School Sports
|
|
According to PIAA directory July 2013 [189]
Snow day policies
The district has the ability to call parents (at 4 different times or at all of them, 5:30, 6:15, 6:30, 7:00 am) to announce a snow day or opening delay.
See also
References
- ↑ SCASD Public Budget Hearing June, 2016
- ↑ National Center for Education Statistics, Common Core of Data - State College Area School District, 2010
- ↑ Pennsylvania Department of Education, Pennsylvania Public School District Tuition Rates, May 2012
- ↑ "State College Area School District Figures". 2016.
- ↑ "Statewide Honor Roll Rankings 2015". Pittsburgh Business Times. April 10, 2015.
- ↑ Pittsburgh Business Times (April 2011). "Pennsylvania School District Rankings".
- ↑ Pittsburgh Business Times (2009). "Statewide Honor Roll Rankings".
- ↑ Pittsburgh Business Times (May 23, 2007). "Three of top school districts in state hail from Allegheny County".
- ↑ Pittsburgh Business Times, Statewide Overachivers Ranking Information, April 7, 2015
- ↑ "Overachiever statewide ranking". Pittsburgh Business Times. May 6, 2010.
- ↑ The Morning Call (2016). "State College Area School District 2015 PSSA Results".
- ↑ Pennsylvania Department of Education, State College Area School District AYP Overview, September 29, 2011
- ↑ SCASD (September 21, 2012). "State College Annual Report 2014-15" (PDF).
- ↑ State College Area School District Administration (2009). "State College Area School District Report about the district".
- ↑ The Times Tribune (2009). "State College Area School District Report Card 2008".
- ↑ Pennsylvania Partnerships for Children. "High School Graduation rate 2007". Retrieved February 19, 2011.
- ↑ Pennsylvania Department of Education (September 21, 2012). "STATE COLLEGE AREA High School AYP Overview 2012".
- ↑ Pennsylvania Department of Education, State College Area High School AYP Overview, September 29, 2011
- ↑ National Center for Education Statistics, Common Care Date - State College Area High School, 2010
- ↑ Pennsylvania Department of Education (September 29, 2012). "2011-2012 PSSA and AYP Results".
- ↑ Pennsylvania Department of Education (September 29, 2011). "2010-2011 PSSA and AYP Results".
- ↑ Pennsylvania Department of Education (2010). "2009-2010 PSSA and AYP Results".
- ↑ The Times-Tribune. (September 2009). "Grading Our Schools database, 2009 PSSA results,".
- ↑ Pennsylvania Department of Education (August 2008). "2007-2008 PSSA and AYP Results".
- ↑ Pennsylvania Department of Education (2007). "PSSA Math and Reading results".
- ↑ Pittsburgh Post Gazette (October 15, 2012). "How is your school doing?".
- ↑ Pennsylvania Department of Education (2008). "State College Area School District report Card 2008".
- ↑ Pennsylvania Department of Education (September 21, 2012). "State College Area High School Academic Achievement Report Card 2012" (PDF).
- ↑ Pennsylvania Department of Education (September 29, 2011). "2010-2011 PSSA results in Science".
- ↑ The Times-Tribune (2009). "Grading Our Schools database, 2009 Science PSSA results".
- ↑ Pennsylvania Department of Education (2011). "Public School SAT Scores 2011".
- ↑ College Board (September 2011). "SAT Scores State By State - Pennsylvania".
- ↑ "While U.S. SAT scores dip across the board, N.J. test-takers hold steady". NJ.com. September 2011.
- ↑ Pennsylvania Department of Education (January 20, 2009). "Pennsylvania College Remediation Report,".
- ↑ National Center for Education Statistics, IPEDS Integrated Postsecondary Education Data System, 2008
- ↑ National Center for Education Statistics, Common Care data - Mount Nittany Middle School, 2010
- ↑ Pennsylvania Department of Education, Professional Qualifications of Teachers Mount Nittany Middle School, September 29, 2011
- ↑ Pennsylvania Department of Education, Mount Nittany Middle School AYP Overview, September 29, 2011
- ↑ Pittsburgh Post Gazette (October 15, 2012). "How is your school doing?".
- ↑ Pennsylvania Department of Education (September 29, 2011). "Mount Nittany Middle School Academic Achievement Report Card 2011" (PDF).
- ↑ Pennsylvania Department of Education, Mount Nittany Middle School Academic Achievement Report Card 2009, March 2010
- ↑ Pennsylvania Department of Education (September 21, 2012). "Mount Nittany Middle School Academic Achievement Report Card 2012" (PDF).
- ↑ Pennsylvania Department of Education Report (September 14, 2010). "2010 PSSAs: Reading, Math, Writing Results".
- ↑ Pennsylvania Department of Education (2009). "2009 PSSAs: Reading, Math, Writing and Science Results".
- ↑ Pennsylvania Department of Education Report (August 2010). "Science PSSA 2010 by Schools".
- ↑ Pennsylvania Department of Education Report (August 2009). "Science PSSA 2009 by Schools".
- ↑ National Center for Education Statistics, Common Care data - Park Forest Middle School, 2010
- ↑ Pennsylvania Department of Education, Park Forest Middle School AYP Overview, September 29, 2011
- ↑ Pennsylvania Department of Education, Professional Qualifications of Teachers Park Forest Middle School, September 29, 2011
- ↑ Pennsylvania Department of Education, Park Forest Middle School Academic Achievement Report Card 2011, September 29, 2011
- ↑ Pennsylvania Department of Education (September 21, 2012). "Park Forest Middle School Academic Achievement Report Card 2012" (PDF).
- ↑ Pennsylvania Department of Education, 2010 PSSAs: Reading, Math, Writing Results, September 14, 2010
- ↑ Pennsylvania Department of Education, 2009 PSSAs: Reading, Math, Writing and Science Results, October 20, 2009
- ↑ Pennsylvania Department of Education, Report Science PSSA 2010 by Schools, September 14, 2010
- ↑ Pennsylvania Department of Education, Report Science PSSA 2009 by Schools, October 2009
- ↑ Pennsylvania Department of Education, Park Forest Middle School Academic Achievement Report Card 2010, October 20, 2010
- ↑ Pennsylvania Department of Education, Park Forest Middle School Academic Achievement Report Card 2009, September 15, 2009
- ↑ National Center for Education Statistics, Common Care Data – Boalsburg/Panorama Village Elementary School, 2010
- ↑ Pennsylvania Department of Education, Professional Qualifications of Teachers Boalsburg/Panorama Village Elementary School, September 29, 2011
- ↑ Pennsylvania Department of Education, Boalsburg/Panorama Village Elementary School AYP Overview, September 29, 2011
- ↑ Pennsylvania Department of Education (September 29, 2011). "Boalsburg/Panorama Village Elementary School Report Card 2011" (PDF).
- ↑ StateCollege.com (June 25, 2010). "School Board To Vote Tonight On Boalsburg Elementary Sale".
- ↑ National Center for Education Statistics, Common Care Data – Corl Street Elementary School, 2010
- ↑ Pennsylvania Department of Education, Professional Qualifications of Teachers Corl Street Elementary School, September 29, 2011
- ↑ Pennsylvania Department of Education, Corl Street Elementary School AYP Overview, September 29, 2011
- ↑ Pennsylvania Department of Education, Corl Street Elementary School Report Card 2011, September 29, 2011
- ↑ Pennsylvania Department of Education (September 21, 2012). "Corl Street Elementary School Report Card 2012" (PDF).
- ↑ National Center for Education Statistics, Common Care Data – Easterly Parkway Elementary School, 2010
- ↑ Pennsylvania Department of Education, Professional Qualifications of Teachers Easterly Parkway Elementary School, September 29, 2011
- ↑ Pennsylvania Department of Education, Easterly Parkway Elementary School AYP Overview, September 29, 2011
- ↑ Pennsylvania Department of Education (September 29, 2011). "Easterly Parkway Elementary School Report Card 2011" (PDF).
- ↑ Pennsylvania Department of Education (September 21, 2012). "Easterly Parkway Elementary School Report Card 2012" (PDF).
- ↑ National Center for Education Statistics, Common Care Data – Ferguson Township Elementary School, 2010
- ↑ Pennsylvania Department of Education, Professional Qualifications of Teachers Ferguson Township Elementary School, September 29, 2011
- ↑ Pennsylvania Department of Education, Ferguson Township Elementary School AYP Overview, September 29, 2011
- ↑ Pennsylvania Department of Education, Ferguson Township Elementary School Report Card 2011, September 29, 2011
- ↑ Pennsylvania Department of Education (September 21, 2012). "Ferguson Township Elementary School Report Card 2012" (PDF).
- ↑ National Center for Education Statistics, Common Care Data – Grays Wood Elementary School, 2010
- ↑ Pennsylvania Department of Education, Professional Qualifications of Teachers Grays Wood Elementary School, September 29, 2011
- ↑ Pennsylvania Department of Education, Grays Wood Elementary School AYP Overview, September 29, 2011
- ↑ Pennsylvania Department of Education, Grays Wood Elementary School Report Card 2011, September 29, 2011
- ↑ Pennsylvania Department of Education (September 21, 2012). "Grays Wood Elementary School Report Card 2012" (PDF).
- ↑ National Center for Education Statistics, Common Care Data – Houserville/Lemont Elementary School, 2010
- ↑ Pennsylvania Department of Education, Professional Qualifications of Teachers Houserville/Lemont Elementary School, September 29, 2011
- ↑ Pennsylvania Department of Education, Houserville/Lemont Elementary School AYP Overview, September 29, 2011
- ↑ Pennsylvania Department of Education, Houserville/Lemont Elementary School Report Card 2011, September 29, 2011
- ↑ Pennsylvania Department of Education (September 21, 2012). "Houserville/Lemont Elementary School Report Card 2012" (PDF).
- ↑ National Center for Education Statistics, Common Care Data – Park Forest Elementary School, 2010
- ↑ Pennsylvania Department of Education, Professional Qualifications of Teachers Park Forest Elementary School, September 29, 2011
- ↑ Pennsylvania Department of Education, Park Forest Elementary School AYP Overview, September 29, 2011
- ↑ Pennsylvania Department of Education, Park Forest Elementary School Report Card 2011, September 29, 2011
- ↑ Pennsylvania Department of Education (September 21, 2012). "Park Forest Elementary School Report Card 2012" (PDF).
- ↑ National Center for Education Statistics, Common Care Data – Radio Park Elementary School, 2010
- ↑ Pennsylvania Department of Education, Professional Qualifications of Teachers Radio Park Elementary School, September 29, 2011
- ↑ Pennsylvania Department of Education, Radio Park Elementary School AYP Overview, September 29, 2011
- ↑ Pennsylvania Department of Education (September 29, 2011). "Radio Park Elementary School Report Card 2011" (PDF).
- ↑ Pennsylvania Department of Education (September 21, 2012). "Radio Park Elementary School Report Card 2012" (PDF).
- ↑ Pennsylvania Bureau of Special Education Services (2010). "State College Area School District Special Education Data Report LEA Performance on State Performance Plan (SPP) Targets".
- ↑ Pennsylvania House Majority Policy Committee (2010). "PA House Majority Policy Committee May 12, 2010 Hearing Testimony and Handouts".
- ↑ Pennsylvania Bureau of Special Education (2008). "Pennsylvania Parent Guide to Special Education Services".
- ↑ State College Area School District administration (2011). "The Special Education Annual Notice".
- ↑ Pennsylvania Department of Education. "Pennsylvania Special Education Funding".
- ↑ Pennsylvania Department of Education (July 2010). "Special Education Funding from Pennsylvania State_2010-2011".
- ↑ Pennsylvania Department of Education (2011). "Special Education Funding 2011-2012 Fiscal Year".
- ↑ Pennsylvania General Assembly, Taxpayer Relief Act, Act 1 of the Special Session of 2006, June 27, 2006
- ↑ Pennsylvania Department of Education (2012). "Investing in Pennsylvania Students".
- ↑ "State College Area School District Payroll report 2011". OpenPA Gov.org. 2013.
- ↑ Openpagov.org (2010). "State College Area School District Payroll".
- ↑ Pennsylvania Department of Education (2012). "Investing in Pennsylvania Students".
- ↑ American Enterprise Institute, (2011). "Assessing the Compensation of Public School Teachers".
- ↑ State College Area School Board (2011). "State College Area School District Teachers Contract 2006-2011".
- ↑ Fenton, Jacob, (March 2009). "Average classroom teacher salary in Centre County, 2006-07.". The Morning Call.
- ↑ PA Delaware County Times, Teachers need to know enough is enough, April 20, 2010.
- ↑ State College Area School Board (2010). "State College Area School District Teachers' Union Employment Contract 2010".
- ↑ "Central Pennsylvania School Districts Spending Versus Academic Results". 2009.
- ↑ Pennsylvania Department of Education (2010). "2009-10 Selected Data - 2009-10 Total Expenditures per ADM".
- ↑ United States Census Bureau (2009). "States Ranked According to Per Pupil Elementary-Secondary Public School System Finance Amounts: 2008-09" (PDF).
- ↑ US Census Bureau (2009). "Total and current expenditures per pupil in fall enrollment in public elementary and secondary education, by function and state or jurisdiction: 2006-07".
- ↑ Fenton, Jacob (February 2009). "Pennsylvania School District Data: Will School Consolidation Save Money?". The Morning Call.
- ↑ State College Area School District ACT-93 Agreement, State College Area School Board, 2010
- ↑ {{cite web ]url=http://www.statecollege.com/news/local-news/mextorf-resigns-as-state-college-area-school-district-superintendent-593388/ |title=Mextorf Resigns as State College Area School District Superintendent |author=Adam Smeltz |date=December 4, 2010}}
- ↑ WeAreCentralPa (June 14, 2011). "State College Area School District Hires New Superintendent".
- ↑ Sade Blount (October 2, 2011). "SCASD School Superintendent receives raise during layoffs".
- ↑ Pennsylvania School Board Association (October 2009). "Public School Salaries 11th Annual".
- ↑ Pennsylvania Department of Education. "Fund Balances by Local Education Agency 1997 to 2008".
- ↑ Jan Murphy (September 22, 2010). "Pennsylvania's public schools boost reserves".
- ↑ Pennsylvania Auditor General (November 2010). "State College Area School District Centre County, Pennsylvania Performance Audit Report".
- ↑ Pennsylvania Department of Education (May 2012). "Pennsylvania Public School District Tuition Rates".
- ↑ Pennsylvania Department of Revenue (April 2010). "Personal Income Taxation Guidelines".
- ↑ John Finnerty (2013). "PA teachers pensions". CNHI Harrisburg Bureau.
- ↑ Democrat Appropriations Committee, Report on Education funding by LEA, July 2, 2013
- ↑ Pennsylvania Office of the Budget, 2013-14 State Budget Highlights, 2013
- ↑ Senator Jake Corman (June 28, 2012). "Pennsylvania Education funding by Local School District" (PDF).
- ↑ PA Senate Appropriations Committee (June 28, 2011). "School District 2011-12 funding Report".
- ↑ Pennsylvania Senate Appropriations Committee (June 2011). "Senate Budget Hearings 2011-2012 School District funding for 2011-2012".
- ↑ Pennsylvania House Education Committee (June 30, 2010). "PA Basic Education Funding-Printout2".
- ↑ Office of Budget, (February 2010). "Pennsylvania Budget Proposal,".
- ↑ Pennsylvania Department of Education (October 2009). "Report on Funding by school district".
- ↑ Pennsylvania Department of Education, School District Funding Report, October 2009
- ↑ Pennsylvania Department of Education. "Accountability Block Grant report 2010, Grantee list 2010".
- ↑ Pennsylvania Department of Education. "Accountability Block Grant Mid Year report".
- ↑ Pennsylvania Auditor General (2008-12-22). "Special Performance Audit Classrooms For the Future grants" (PDF).
- ↑ Pennsylvania Department of Education Press Office (October 17, 2013). "Acting Secretary of Education Says Hybrid Learning Benefits Students; Highlights Success of First-Year Pilot Program".
- ↑ Pennsylvania Department of Education. "Common Cents program - Making Every Dollar Count". Retrieved February 1, 2011.
- ↑ Centre County ARRA FUNDING website accessed April 2010.
- ↑ Governor's Press Office. (January 20, 2010). "Pennsylvania's 'Race to the Top' Fueled by Effective Reforms, Strong Local Support,".
- ↑ Pennsylvania Department of Education Secretary Gerald Zahorchek (December 2009). "Pennsylvania Race to the Top Letter to Superintendents".
- ↑ U.S. Department of Education (March 29, 2010). "Race to the Top Fund".
- ↑ Centre Daily Times (June 23, 2014). "Tax increase set for State College Area School District residents".
- ↑ Pennsylvania Department of Education,. "Act 511 Tax Report, 2004".
- ↑ M Morgan., State College school board OKs budget with tax increase, The Centre Daily Times, June 10, 2013
- ↑ Pennsylvania Department of Education, Real Estate Tax Rates by School District 2012-13 Real Estate Mills, 2012
- ↑ Pennsylvania Department of Education (2011). "Real Estate Tax Millage by School District,".
- ↑ Pennsylvania Department of Education. "Finances_Real Estate Tax Rates 2010-11".
- ↑ Pennsylvania Department of Education, Financial Elements Reports, 2010
- ↑ Pennsylvania Department of Education (2008). "Pennsylvania School District Real Estate Tax Rates 2008-09".
- ↑ Pennsylvania Department of Education (2008). "Real Estate Tax Millage by School District,".
- ↑ Pennsylvania Department of Education, Real Estate Tax Millage by School District, 2006
- ↑ Pennsylvania Department of Education, Real Estate Tax Millage by School District, 2005
- ↑ Tax-rates.org., The 2013 Tax Resource County Property Taxes 2012, 2012
- ↑ Pennsylvania Department of Education, Pennsylvania School Finances - Summaries of Annual Financial Report Data 2010-11, 2011
- ↑ New Census Data on Property Taxes on Homeowners, Tax Foundation, September 22, 2009.
- ↑ Pennsylvania Department of Education (May 2011). "Cenre County Property Tax relief 2011".
- ↑ Pennsylvania Department of Education Report (May 1, 2010). "Tax Relief per Homestead 2010,".
- ↑ Tax Relief per Homestead 2009, Pennsylvania Department of Education Report May 1, 2009
- ↑ Auditor General Office (2010-02-23). "Special Report Pennsylvania Property Tax Relief,".
- ↑ "Pennsylvania Property Tax/Rent Rebate Program". 2009.
- ↑ Pennsylvania Department of Education, 2010-11 Act 1 of 2006 Referendum Exception Guidelines, 2010
- ↑ Pennsylvania Department of Education (May 2010). "Special Session Act 1 of 2006 School District Adjusted Index for 2006-2007 through 2010-2011,".
- ↑ Pennsylvania Department of Education (Sep 18, 2010). "Index Calculation Required by the Taxpayer Relief Act".
- ↑ Pennsylvania Department of Education. "Financial Data Elements".
- ↑ Pennsylvania Department of Education, 2012-2013 School District Adjusted Index, September 2011
- ↑ Pennsylvania Department of Education, 2013-2014 School District Adjusted Index, September 2012
- ↑ Pennsylvania Department of Education, 2014-2015 School District Adjusted Index, September 2013
- ↑ Pennsylvania Department of Education, Report on Referendum Exceptions For School Year 2013-2014, April 2013
- ↑ Pennsylvania Department of Education, Report on Referendum Exceptions For School Year 2012-2013, March 30, 2012
- ↑ Pennsylvania Department of Education (2011). "Special Session Act 1 of 2006 the Taxpayer Relief Act information".
- ↑ Pennsylvania Department of Education (April 2011). "Report on Exceptions".
- ↑ Pennsylvania Department of Education (April 2010). "Pennsylvania SSAct1_Act1 Exceptions Report 2010-2011 April 2010".
- ↑ Pennsylvania Department of Education (April 2009). "Pennsylvania SSAct1 Exception requests Report_2009-2010_May 2009".
- ↑ Scarcella, Frank and Pursell, Tricia, Local school tax assessments exceed state averages. The Daily Item, May 25, 2010
- ↑ State College Area School Board Policy Manual Extracurriculars Policy
- ↑ State College Area School Board Policy (2011). "Interscholastic Athletics Eligibility Standards".
- ↑ "State College Area School District Student Athlete Handbook" (PDF).
- ↑ Adam Smeltz (April 23, 2011). "Possible Athletics, Extracurricular Cuts to Go Before State College School Board".
- ↑ Adam Smeltz (April 9, 2011). "Proposed Job, Program Cuts Outlined for State College Schools".
- ↑ Mechanicsburg School Administration. "Guidelines and Procedures for the Participation of Home Education and Charter/Cyber School Students in Extracurricular Activities".
- ↑ Pennsylvania Office of the Governor Press Release, (November 10, 2005). "Home-Schooled, Charter School Children Can Participate in School District Extracurricular Activities,".
- ↑ Pennsylvania Interscholastic Athletics Association (2013). "PIAA School Directory".
External links
- Official website
- High School Facilities Project
- State High Vision
- The Sensible Solution
- Vote for Change
- Friends of Lemont School
- Centre Daily Times article--"History, Craftsmanship Make Lemont School Worth Saving
Coordinates: 40°47′03″N 77°54′17″W / 40.78418°N 77.90473°W