Staple food
A staple food, or simply a staple, is a food that is eaten routinely and in such quantities that it constitutes a dominant portion of a standard diet for a given people, supplying a large fraction of energy needs and generally forming a significant proportion of the intake of other nutrients as well. The staple food of a specific society may be eaten as often as every day or every meal, and most people live on a diet based on just a small number of staples.[1]
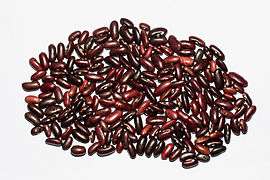
Staple foods vary from place to place, but typically they are inexpensive or readily-available foods that supply one or more of the three organic macronutrients needed for survival and health: carbohydrates, proteins, and fats. Typical examples of staples include tubers and roots; and grains, legumes, and other seeds. Early agricultural civilizations valued the foods that they established as staples because, in addition to providing necessary nutrition, they generally are suitable for storage over long periods of time without decay. Such nonperishable foods are the only possible staples during seasons of shortage, such as dry seasons or cold temperate winters, against which times harvests have been stored. During seasons of plenty, wider choices of foods may be available.
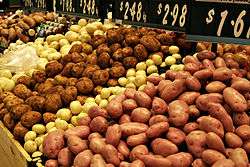
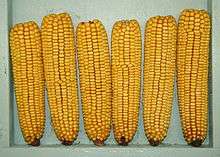
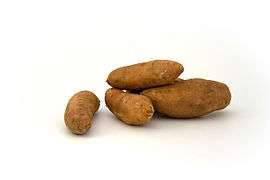
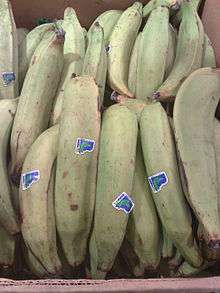
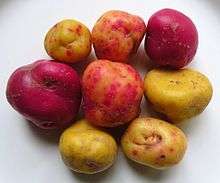
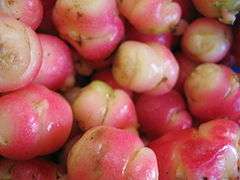
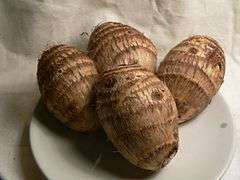
Most staple plant foods are derived either from cereals such as wheat, barley, rye, maize, or rice; or starchy tubers or root vegetables such as potatoes, yams, taro, arrowroot, or cassava.[2] Other staple foods include pulses (dried legumes), sago (derived from the pith of the sago palm tree), and fruits (such as breadfruit and plantains).[3] Staple foods may also contain (depending on the region): sorghum, olive oil, coconut oil and sugar (e.g. from plantains).[4][5][6] Most staples are plant materials, but in some communities fishing is the primary source of nutrition.[7]
Demographics
Of the more than 50,000 edible plant species in the world, only a few hundred contribute significantly to human food supplies. Although there are over 10,000 species in the cereal family, just a few have been widely cultivated over the past 2,000 years.
The staple food in different parts of the world is a function of weather patterns, local terrain, farming constraints, acquired tastes and ecosystems. For example, the main energy source staples in the average African diet are cereals (46 percent), roots and tubers (20 percent) and animal products (7 percent). In Western Europe the main staples in the average diet are animal products (33 percent), cereals (26 percent) and roots and tubers (4 percent).
Most of the global human population lives on a diet based on one or more of the following staples: rice, wheat, maize (corn), millet, sorghum, roots and tubers (potatoes, cassava, yams and taro) and animal products such as meat, milk, eggs, cheese and fish. Regional staples include rye, soybeans, barley, oats and teff.
Just 15 crop plants provide 90 percent of the world's food energy intake (exclusive of meat), with rice, maize and wheat comprising two-thirds of human food consumption. The three are the staples of over 4 billion people,[8] and rice feeds almost half of humanity.
Roots and tubers, meanwhile, are important staples for over 1 billion people in the developing world, accounting for roughly 40 percent of the food eaten by half the population of sub-Saharan Africa. Roots and tubers are high in carbohydrates, calcium and vitamin C but low in protein. Cassava root is a major staple food in the developing world, providing a basic diet for around 500 million people.
With economic development and free trade, many countries have shifted away from low-nutrient-density staple foods to higher-nutrient-density staples, as well as towards greater meat consumption. Despite this trend, there is growing recognition of the importance of traditional staple crops in nutrition. Efforts are underway to identify better strains with superior nutrition, disease resistance and higher yields.
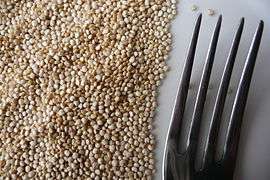
Some foods like quinoa—a pseudocereal grain that originally came from the Andes—were also staple foods centuries ago.[9] Oca, ulluco and amaranth seed are other foods claimed to be staples in Andean history.[10] Pemmican was a staple of the Plains Indians of North America.[11] In 2010, the global consumption of "speciality grains" such as quinoa was very small compared to other staples such as rice, wheat and maize. These grains, once popular but then forgotten, are being reevaluated and reintroduced.
Production
Most staple food is produced using modern and conventional farming practices. However, the production of staple food using organic farming methods is growing.
| World production 2012[13] | Average world yield 2010 | World's most productive countries[14] 2012[15] |
World's largest producing countries (2013)[16] | ||||
|---|---|---|---|---|---|---|---|
| Rank | Crop | (metric tons) | (tons per hectare) | (tons per hectare) | Country | (metric tons) | Country |
| 1 | Maize (corn) | 873 million | 5.1 | 25.9 | United States | 354 million | United States |
| 2 | Rice | 738 million | 4.3 | 9.5 | Egypt | 204 million | China |
| 3 | Wheat | 671 million | 3.1 | 8.9 | New Zealand | 122 million | China |
| 4 | Potatoes | 365 million | 17.2 | 45.4 | Netherlands | 96 million | China |
| 5 | Cassava | 269 million | 12.5 | 34.8 | India | 47 million | Nigeria |
| 6 | Soybeans | 241 million | 2.4 | 4.4 | Egypt | 91 million | United States |
| 7 | Sweet potatoes | 108 million | 13.5 | 33.3 | Senegal | 71 million | China |
| 8 | Yams | 59.5 million | 10.5 | 28.3 | Colombia | 36 million | Nigeria |
| 9 | Sorghum | 57.0 million | 1.5 | 86.7 | United States | 10 million | United States |
| 10 | Plantain | 37.2 million | 6.3 | 31.1 | El Salvador | 9 million | Uganda |
Refining
Rice is most commonly cooked and eaten as entire grains, but most other cereals are milled into flour or meal, which is used to make bread, noodles/ pasta, porridges and "mushes" like mealie pap. Mashed root vegetables can be used to make porridge-like dishes, including poi and fufu. Pulses (particularly chickpeas) and starchy root vegetables such as canna root can also be made into flour.
Part of balanced nutrition
Although nutritious, vegetable staples generally do not provide a full range of nutrients, so other foods need to be added to the diet, to ward off malnutrition. The deficiency disease pellagra is associated with a diet consisting primarily of maize; the disease beriberi with a diet of white (refined) rice.[17]
Nutritional content
The following table shows the nutrient content of major staple vegetable foods in raw form, with the caveat that raw grains are not edible and cannot be digested. Raw grains must be sprouted, or prepared and cooked for human consumption. In sprouted and cooked form, the relative nutritional and anti-nutritional contents of each of these grains is remarkably different from that of raw form of these grains (reported in this table). Potatoes must also be cooked and should not be sprouted.
| Nutrient component: | Maize / Corn[A] | Rice (white)[B] | Rice (brown)[I] | Wheat[C] | Potato[D] | Cassava[E] | Soybean (Green)[F] | Sweet potato[G] | Yam[Y] | Sorghum[H] | Plantain[Z] | RDA |
|---|---|---|---|---|---|---|---|---|---|---|---|---|
| Water (g) | 10 | 12 | 10 | 13 | 79 | 60 | 68 | 77 | 70 | 9 | 65 | 3000 |
| Energy (kJ) | 1528 | 1528 | 1549 | 1369 | 322 | 670 | 615 | 360 | 494 | 1419 | 511 | 2000–2500 |
| Protein (g) | 9.4 | 7.1 | 7.9 | 12.6 | 2.0 | 1.4 | 13.0 | 1.6 | 1.5 | 11.3 | 1.3 | 50 |
| Fat (g) | 4.74 | 0.66 | 2.92 | 1.54 | 0.09 | 0.28 | 6.8 | 0.05 | 0.17 | 3.3 | 0.37 | |
| Carbohydrates (g) | 74 | 80 | 77 | 71 | 17 | 38 | 11 | 20 | 28 | 75 | 32 | 130 |
| Fiber (g) | 7.3 | 1.3 | 3.5 | 12.2 | 2.2 | 1.8 | 4.2 | 3 | 4.1 | 6.3 | 2.3 | 30 |
| Sugar (g) | 0.64 | 0.12 | 0.85 | 0.41 | 0.78 | 1.7 | 0 | 4.18 | 0.5 | 0 | 15 | |
| Calcium (mg) | 7 | 28 | 23 | 29 | 12 | 16 | 197 | 30 | 17 | 28 | 3 | 1000 |
| Iron (mg) | 2.71 | 0.8 | 1.47 | 3.19 | 0.78 | 0.27 | 3.55 | 0.61 | 0.54 | 4.4 | 0.6 | 8 |
| Magnesium (mg) | 127 | 25 | 143 | 126 | 23 | 21 | 65 | 25 | 21 | 0 | 37 | 400 |
| Phosphorus (mg) | 210 | 115 | 333 | 288 | 57 | 27 | 194 | 47 | 55 | 287 | 34 | 700 |
| Potassium (mg) | 287 | 115 | 223 | 363 | 421 | 271 | 620 | 337 | 816 | 350 | 499 | 4700 |
| Sodium (mg) | 35 | 5 | 7 | 2 | 6 | 14 | 15 | 55 | 9 | 6 | 4 | 1500 |
| Zinc (mg) | 2.21 | 1.09 | 2.02 | 2.65 | 0.29 | 0.34 | 0.99 | 0.3 | 0.24 | 0 | 0.14 | 11 |
| Copper (mg) | 0.31 | 0.22 | 0.43 | 0.11 | 0.10 | 0.13 | 0.15 | 0.18 | - | 0.08 | 0.9 | |
| Manganese (mg) | 0.49 | 1.09 | 3.74 | 3.99 | 0.15 | 0.38 | 0.55 | 0.26 | 0.40 | - | - | 2.3 |
| Selenium (μg) | 15.5 | 15.1 | 70.7 | 0.3 | 0.7 | 1.5 | 0.6 | 0.7 | 0 | 1.5 | 55 | |
| Vitamin C (mg) | 0 | 0 | 0 | 0 | 19.7 | 20.6 | 29 | 2.4 | 17.1 | 0 | 18.4 | 90 |
| Thiamin (B1)(mg) | 0.39 | 0.07 | 0.40 | 0.30 | 0.08 | 0.09 | 0.44 | 0.08 | 0.11 | 0.24 | 0.05 | 1.2 |
| Riboflavin (B2)(mg) | 0.20 | 0.05 | 0.09 | 0.12 | 0.03 | 0.05 | 0.18 | 0.06 | 0.03 | 0.14 | 0.05 | 1.3 |
| Niacin (B3) (mg) | 3.63 | 1.6 | 5.09 | 5.46 | 1.05 | 0.85 | 1.65 | 0.56 | 0.55 | 2.93 | 0.69 | 16 |
| Pantothenic acid (B5) (mg) | 0.42 | 1.01 | 1.49 | 0.95 | 0.30 | 0.11 | 0.15 | 0.80 | 0.31 | - | 0.26 | 5 |
| Vitamin B6 (mg) | 0.62 | 0.16 | 0.51 | 0.3 | 0.30 | 0.09 | 0.07 | 0.21 | 0.29 | - | 0.30 | 1.3 |
| Folate Total (B9) (μg) | 19 | 8 | 20 | 38 | 16 | 27 | 165 | 11 | 23 | 0 | 22 | 400 |
| Vitamin A (IU) | 214 | 0 | 0 | 9 | 2 | 13 | 180 | 14187 | 138 | 0 | 1127 | 5000 |
| Vitamin E, alpha-tocopherol (mg) | 0.49 | 0.11 | 0.59 | 1.01 | 0.01 | 0.19 | 0 | 0.26 | 0.39 | 0 | 0.14 | 15 |
| Vitamin K1 (μg) | 0.3 | 0.1 | 1.9 | 1.9 | 1.9 | 1.9 | 0 | 1.8 | 2.6 | 0 | 0.7 | 120 |
| Beta-carotene (μg) | 97 | 0 | 5 | 1 | 8 | 0 | 8509 | 83 | 0 | 457 | 10500 | |
| Lutein+zeaxanthin (μg) | 1355 | 0 | 220 | 8 | 0 | 0 | 0 | 0 | 0 | 30 | ||
| Saturated fatty acids (g) | 0.67 | 0.18 | 0.58 | 0.26 | 0.03 | 0.07 | 0.79 | 0.02 | 0.04 | 0.46 | 0.14 | |
| Monounsaturated fatty acids (g) | 1.25 | 0.21 | 1.05 | 0.2 | 0.00 | 0.08 | 1.28 | 0.00 | 0.01 | 0.99 | 0.03 | |
| Polyunsaturated fatty acids (g) | 2.16 | 0.18 | 1.04 | 0.63 | 0.04 | 0.05 | 3.20 | 0.01 | 0.08 | 1.37 | 0.07 |
| A yellow corn | B raw unenriched long-grain white rice | ||||||||
| C hard red winter wheat | D raw potato with flesh and skin | ||||||||
| E raw cassava | F raw green soybeans | ||||||||
| G raw sweet potato | H raw sorghum | ||||||||
| Y raw yam | Z raw plantains | ||||||||
| I raw long-grain brown rice |
Note: The highlighted value is the highest nutrient density amongst these staples. Other foods of the world, consumed in smaller quantities, may have nutrient densities higher than these values.
Gallery of food staples
 Boiled white rice
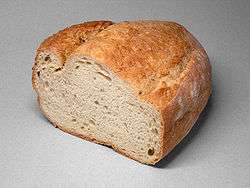
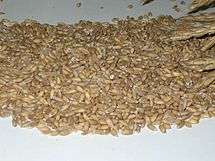
 Amaranth (left) and wheat seeds
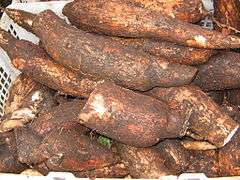
 Edamame (green soybeans)
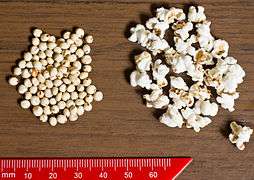 Sorghum seeds and popped sorghum

See also
| Wikimedia Commons has media related to Staple food. |
References
- ↑ United Nations Food and Agriculture Organization: Agriculture and Consumer Protection. "Dimensions of Need - Staples: What do people eat?". Retrieved 2010-10-15.
- ↑ Staple foods — Root and Tuber Crops
- ↑ Staple Foods II -- Fruits
- ↑ "African Food Staples". Retrieved 29 May 2015.
- ↑ "Olive Oil & Health - All Olive Oil". Retrieved 29 May 2015.
- ↑ "How Sugar Went From a Condiment to a Diet Staple".
- ↑ "Fish as food". Retrieved 29 May 2015.
- ↑ "Dimensions of Need: An atlas of food and agriculture". Food and Agriculture Organization of the United Nations. 1995.
- ↑ E.A. Oelke; et al. "Quinoa". University of Minneasota.
- ↑ Arbizu and Tapia (1994). "Plant Production and Protection Series No. 26. FAO, Rome, Italy". FAO / Purdue University.
- ↑ John E. Foster. "Pemmican". The Canadian Encyclopedia. Retrieved 29 May 2015.
- ↑ Allianz. "Food security: Ten Crops that Feed the World". Allianz.
- ↑ "Food and Agricultural commodities production / Commodities by regions". Food and Agriculture Organization of the United Nations. 2012.
- ↑ The numbers in this column are country average; regional farm productivity within the country varies, with some farms even higher.
- ↑ "FAOSTAT: Production-Crops, 2010 data". Food and Agriculture Organization of the United Nations. 2011.
- ↑ "Food and Agricultural commodities production / Countries by commodity (2013 data)". Food and Agriculture Organization of the United Nations. Retrieved 2016-04-24.
- ↑ United Nations Food and Agriculture Organization: Agriculture and Consumer Protection. "Rice and Human Nutrition" (PDF). Retrieved 2010-10-15.
- ↑ "Nutrient data laboratory". United States Department of Agriculture. Retrieved August 10, 2016.
| Diet |
| ||||||||||||||||||||||||||||||||||
|---|---|---|---|---|---|---|---|---|---|---|---|---|---|---|---|---|---|---|---|---|---|---|---|---|---|---|---|---|---|---|---|---|---|---|---|
| Nutrition |
| ||||||||||||||||||||||||||||||||||
| |||||||||||||||||||||||||||||||||||