Standard illuminant
A standard illuminant is a theoretical source of visible light with a profile (its spectral power distribution) which is published. Standard illuminants provide a basis for comparing images or colors recorded under different lighting.
CIE illuminants
The International Commission on Illumination (usually abbreviated CIE for its French name) is the body responsible for publishing all of the well-known standard illuminants. Each of these is known by a letter or by a letter-number combination.
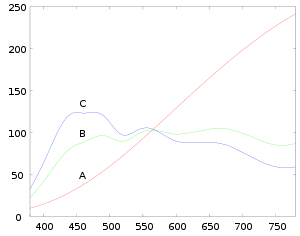
Illuminants A, B, and C were introduced in 1931, with the intention of respectively representing average incandescent light, direct sunlight, and average daylight. Illuminants D represent phases of daylight, Illuminant E is the equal-energy illuminant, while Illuminants F represent fluorescent lamps of various composition.
There are instructions on how to experimentally produce light sources ("standard sources") corresponding to the older illuminants. For the relatively newer ones (such as series D), experimenters are left to measure to profiles of their sources and compare them to the published spectra:[1]
At present no artificial source is recommended to realize CIE standard illuminant D65 or any other illuminant D of different CCT. It is hoped that new developments in light sources and filters will eventually offer sufficient basis for a CIE recommendation.— CIE, Technical Report (2004) Colorimetry, 3rd ed., Publication 15:2004, CIE Central Bureau, Vienna
Nevertheless, they do provide a measure, called the Metamerism Index, to assess the quality of daylight simulators.[2][3] The Metamerism Index tests how well five sets of metameric samples match under the test and reference illuminant. In a manner similar to the color rendering index, the average difference between the metamers is calculated.[4]
Illuminant A
The CIE defines illuminant A in these terms:
CIE standard illuminant A is intended to represent typical, domestic, tungsten-filament lighting. Its relative spectral power distribution is that of a Planckian radiator at a temperature of approximately 2856 K. CIE standard illuminant A should be used in all applications of colorimetry involving the use of incandescent lighting, unless there are specific reasons for using a different illuminant.
The spectral radiant exitance of a black body follows Planck's law:

At the time of standardizing illuminant A, both (which does not affect the relative SPD) and were different. In 1968, the estimate of c2 was revised from 0.01438 m·K to 0.014388 m·K (and before that, it was 0.01435 m·K when illuminant A was standardized). This difference shifted the Planckian locus, changing the color temperature of the illuminant from its nominal 2848 K to 2856 K:


In order to avoid further possible changes in the color temperature, the CIE now specifies the SPD directly, based on the original (1931) value of c2:[1]

The coefficients have been selected to achieve a peak SPD of 100 nm at 560 nm. The tristimulus values are (X, Y, Z) = (109.85, 100.00, 35.58), and the chromaticity coordinates using the standard observer are (x, y) = (0.447,58, 0.407,45).
Illuminants B and C
Illuminants B and C are daylight simulators. They are derived from Illuminant A by using liquid filters. B served as a representative of noon sunlight, with a correlated color temperature (CCT) of 4874 K, while C represented average day light with a CCT of 6774 K. They are poor approximations of any phase of natural daylight, particularly in the short-wave visible and in the ultraviolet spectral ranges. Still, the lighting cabinets, such as the Spectralight III, that use filtered incandescent lamps have better fits to the D illuminants in the 400 nm to 700 nm range than do the fluorescent daylight simulators.[5] As a result, these illuminants have been deprecated in favor of the D series:[1]
Illuminant C does not have the status of a CIE standard but its relative spectral power distribution, tristimulus values and chromaticity coordinates are given in Table T.1 and Table T.3, as many practical measurement instruments and calculations still use this illuminant.— CIE, Publication 15:2004[6]
The liquid filters, designed by Raymond Davis, Jr. and Kasson S. Gibson in 1931,[7] have a relatively high absorbance at the red end of the spectrum, effectively increasing the CCT of the gas lamp to daylight levels. This is similar in function to a CTO color gel that photographers and cinematographers use today, albeit much less convenient.
Each filter uses a pair of solutions, comprising specific amounts of distilled water, copper sulfate, mannite, pyridine, sulfuric acid, cobalt, and ammonium sulfate. The solutions are separated by a sheet of uncolored glass. The amounts of the ingredients are carefully chosen so that their combination yields a color temperature conversion filter; that is, the filtered light is still white.
Illuminant series D
Derived by Judd, MacAdam, and Wyszecki,[8] the D series of illuminants are constructed to represent natural daylight. They are difficult to produce artificially, but are easy to characterize mathematically.
H. W. Budde of the National Research Council of Canada in Ottawa, H. R. Condit and F. Grum of the Eastman Kodak Company in Rochester, New York,[9] and S. T. Henderson and D. Hodgkiss of Thorn Electrical Industries in Enfield[10] had independently measured the spectral power distribution (SPD) of daylight from 330 nm to 700 nm, totaling among them 622 samples. Judd et al. analyzed these samples and found that the (x, y) chromaticity coordinates had a simple, quadratic relation:

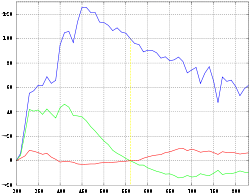
Simonds supervised the characteristic vector analysis of the SPDs.[11][12] Application of his method revealed that the SPDs could be satisfactorily approximated by using the mean (S0) and first two characteristic vectors (S1 and S2):

In simpler terms, the SPD of the studied daylight samples can be expressed as the linear combination of three, fixed SPDs. The first vector (S0) is the mean of all the SPD samples, which is the best reconstituted SPD that can be formed with only a fixed vector. The second vector (S1) corresponds to yellow–blue variation, accounting for changes in the correlated color temperature due to presence or absence of clouds or direct sunlight.[8] The third vector (S2) corresponds to pink–green variation caused by the presence of water in the form of vapor and haze.[8]
To construct a daylight simulator of a particular correlated color temperature one merely needs to know the coefficients M1 and M2 of the characteristic vectors S1 and S2.
Expressing the chromaticities x and y as:


and making use of known tristimulus values for the mean vectors, they were able to express M1 and M2 as follows:
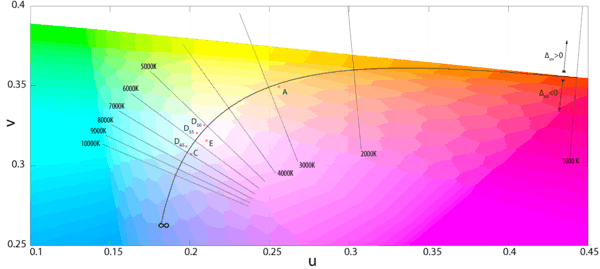


The only problem is that this left unsolved the computation of the coordinate for a particular phase of daylight. Judd et al. simply tabulated the values of certain chromaticity coordinates, corresponding to commonly used correlated color temperatures, such as 5500 K, 6500 K, and 7500 K. For other color temperatures, one could consult figures made by Kelly.[13] This problem was addressed in the CIE report that formalized illuminant D, with an approximation of the x coordinate in terms of the reciprocal color temperature, valid from 4000 K to 25,000 K.[14] The y coordinate trivially followed from Judd's quadratic relation.

Judd et al. then extended the reconstituted SPDs to 300 nm–330 nm and 700 nm–830 nm by using Moon's spectral absorbance data of the Earth's atmosphere.[15]
The tabulated SPDs presented by the CIE today are derived by linear interpolation of the 10 nm data set down to 5 nm. The limited nature of the photometric data is not an impediment to the calculation of the CIEXYZ tristimulus values since the CIE standard colorimetric observer's color matching functions are only tabulated from 380 to 780 nm in increments of 5 nm.[16]
Similar studies have been undertaken in other parts of the world, or repeating Judd et al.'s analysis with modern computational methods. In several of these studies, the daylight locus is notably closer to the Planckian locus than in Judd et al.[17]

- Computation
The relative spectral power distribution (SPD) of a D series illuminant can be derived from its chromaticity coordinates in the CIE 1931 color space, :[18]


where T is the illuminant's CCT. The chromaticity coordinates of the Illuminants D are said to form the CIE Daylight Locus. The relative SPD is given by:


where are the mean and first two eigenvector SPDs, depicted above.[18] The characteristic vectors both have a zero at 560 nm, since all the relative SPDs have been normalized about this point.

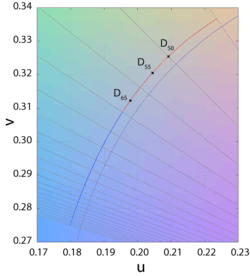
The CCTs of the canonical illuminants, D50, D55, D65, and D75, differ slightly from what their names suggest. For example, D50 has a CCT of 5003 K ("horizon" light), while D65 has a CCT of 6504 K (noon light). As explained in a previous section, this is because the value of the constants in Planck's law have been slightly changed since the definition of these canonical illuminants, whose SPDs are based on the original values in Planck's law. In order to match all significant digits of the published data of the canonical illuminants the values of M1 and M2 have to be rounded to three decimal places before calculation of SD.[1]
Illuminant E
Illuminant E is an equal-energy radiator; it has a constant SPD inside the visible spectrum. It is useful as a theoretical reference; an illuminant that gives equal weight to all wavelengths, presenting an even color. It also has equal CIE XYZ tristimulus values, thus its chromaticity coordinates are (x,y)=(1/3,1/3). This is by design; the XYZ color matching functions are normalized such that their integrals over the visible spectrum are the same.[1]
Illuminant E is not a black body, so it does not have a color temperature, but it can be approximated by a D series illuminant with a CCT of 5455 K. (Of the canonical illuminants, D55 is the closest.) Manufacturers sometimes compare light sources against Illuminant E to calculate the excitation purity.[19]
Illuminant series F
The F series of illuminants represent various types of fluorescent lighting.
F1–F6 "standard" fluorescent lamps consist of two semi-broadband emissions of antimony and manganese activations in calcium halophosphate phosphor.[20] F4 is of particular interest since it was used for calibrating the CIE color rendering index (the CRI formula was chosen such that F4 would have a CRI of 51). F7–F9 are "broadband" (full-spectrum light) fluorescent lamps with multiple phosphors, and higher CRIs. Finally, F10–F12 are narrow triband illuminants consisting of three "narrowband" emissions (caused by ternary compositions of rare-earth phosphors) in the R,G,B regions of the visible spectrum. The phosphor weights can be tuned to achieve the desired CCT.
The spectra of these illuminants are published in Publication 15:2004.[6][21]
-
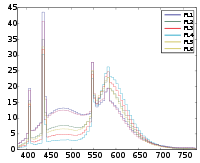
FL 1–6: Standard
-
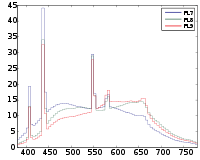
FL 7–9: Broadband
-
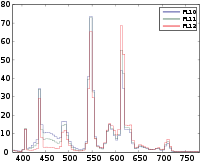
FL 10–12: Narrowband
White point
The spectrum of a standard illuminant, like any other profile of light, can be converted into tristimulus values. The set of three tristimulus coordinates of an illuminant is called a white point. If the profile is normalized, then the white point can equivalently be expressed as a pair of chromaticity coordinates.
If an image is recorded in tristimulus coordinates (or in values which can be converted to and from them), then the white point of the illuminant used gives the maximum value of the tristimulus coordinates that will be recorded at any point in the image, in the absence of fluorescence. It is called the white point of the image.
The process of calculating the white point discards a great deal of information about the profile of the illuminant, and so although it is true that for every illuminant the exact white point can be calculated, it is not the case that knowing the white point of an image alone tells you a great deal about the illuminant that was used to record it.
White points of standard illuminants
A list of standardized illuminants, their CIE chromaticity coordinates (x,y) of a perfectly reflecting (or transmitting) diffuser, and their correlated color temperatures (CCTs) are given below. The CIE chromaticity coordinates are given for both the 2 degree field of view (1931) and the 10 degree field of view (1964). The color swatches represent the hue of each white point, calculated with luminance Y=0.54 and the standard observer, assuming correct sRGB display calibration.
| Name | CIE 1931 2° | CIE 1964 10° | CCT (K) | Hue | Note | ||
|---|---|---|---|---|---|---|---|
| x2 | y2 | x10 | y10 | ||||
| A | 0.44757 | 0.40745 | 0.45117 | 0.40594 | 2856 | Incandescent / Tungsten | |
| B | 0.34842 | 0.35161 | 0.34980 | 0.35270 | 4874 | {obsolete} Direct sunlight at noon | |
| C | 0.31006 | 0.31616 | 0.31039 | 0.31905 | 6774 | {obsolete} Average / North sky Daylight | |
| D50 | 0.34567 | 0.35850 | 0.34773 | 0.35952 | 5003 | Horizon Light. ICC profile PCS | |
| D55 | 0.33242 | 0.34743 | 0.33411 | 0.34877 | 5503 | Mid-morning / Mid-afternoon Daylight | |
| D65 | 0.31271 | 0.32902 | 0.31382 | 0.33100 | 6504 | Noon Daylight: Television, sRGB color space | |
| D75 | 0.29902 | 0.31485 | 0.29968 | 0.31740 | 7504 | North sky Daylight | |
| E | 1/3 | 1/3 | 1/3 | 1/3 | 5454 | Equal energy | |
| F1 | 0.31310 | 0.33727 | 0.31811 | 0.33559 | 6430 | Daylight Fluorescent | |
| F2 | 0.37208 | 0.37529 | 0.37925 | 0.36733 | 4230 | Cool White Fluorescent | |
| F3 | 0.40910 | 0.39430 | 0.41761 | 0.38324 | 3450 | White Fluorescent | |
| F4 | 0.44018 | 0.40329 | 0.44920 | 0.39074 | 2940 | Warm White Fluorescent | |
| F5 | 0.31379 | 0.34531 | 0.31975 | 0.34246 | 6350 | Daylight Fluorescent | |
| F6 | 0.37790 | 0.38835 | 0.38660 | 0.37847 | 4150 | Lite White Fluorescent | |
| F7 | 0.31292 | 0.32933 | 0.31569 | 0.32960 | 6500 | D65 simulator, Daylight simulator | |
| F8 | 0.34588 | 0.35875 | 0.34902 | 0.35939 | 5000 | D50 simulator, Sylvania F40 Design 50 | |
| F9 | 0.37417 | 0.37281 | 0.37829 | 0.37045 | 4150 | Cool White Deluxe Fluorescent | |
| F10 | 0.34609 | 0.35986 | 0.35090 | 0.35444 | 5000 | Philips TL85, Ultralume 50 | |
| F11 | 0.38052 | 0.37713 | 0.38541 | 0.37123 | 4000 | Philips TL84, Ultralume 40 | |
| F12 | 0.43695 | 0.40441 | 0.44256 | 0.39717 | 3000 | Philips TL83, Ultralume 30 | |
References
- 1 2 3 4 5 Schanda, János (2007). "3: CIE Colorimetry". Colorimetry: Understanding the CIE System. Wiley Interscience. pp. 37–46. ISBN 978-0-470-04904-4.
- ↑ CIE Technical Report (1999). A Method for Assessing the Quality of Daylight Simulators for Colorimetry. 51.2-1999 (including Supplement 1-1999). Paris: Bureau central de la CIE. ISBN 92-9034-051-7.
A method is provided for evaluating the suitability of a test source as a simulator of CIE Standard Illuminants D55, D65, or D75. The Supplement, prepared in 1999, adds the CIE Illuminant D50 to the line of illuminants where the method can be applied to. For each of these standard illuminants, spectral radiance factor data are supplied for five pairs of nonfluorescent samples that are metameric matches. The colorimetric differences of the five pairs are computed for the test illuminant; the average of these differences is taken as the visible range metamerism index and is used as a measure of the quality of the test illuminant as a simulator for nonfluorescent samples. For fluorescent samples, the quality is further assessed in terms of an ultraviolet range metamerism index, defined as the average of the colorimetric differences computed with the test illuminant for three further pairs of samples, each pair consisting of a fluorescent and a nonfluorescent sample which are metameric under the standard illuminant.
- ↑ CIE Standard (2004). Standard Method of Assessing the Spectral Quality of Daylight Simulators for Visual Appraisal and Measurement of Colour. S012/E:2004. Prepared by TC 1-53 "A Standard Method for Assessing the Quality of Daylight Simulators". ISO Standard 23603:2005(E).
- ↑ Lam, Yuk-Ming; Xin, John H. (August 2002). "Evaluation of the quality of different D65 simulators for visual assessment". Color Research & Application. 27 (4): 243–251. doi:10.1002/col.10061.
- ↑ Wyszecki, Gunter (1970). "Development of New CIE Sources for Colorimetry". Die Farbe. 19: 43–.
- 1 2 CIE Technical Report (2004). Colorimetry. Publication 15:2004 (3rd ed.). CIE Central Bureau, Vienna. ISBN 3-901906-33-9.
- ↑ Davis, Raymond; Gibson, Kasson S. (January 21, 1931). "Filters for the reproduction of sunlight and daylight and the determination of color temperature". Precision Measurement and Calibration. National Bureau of Standards. 10: 641–805.
- 1 2 3 Judd, Deane B.; MacAdam, David L.; Wyszecki, Günter (August 1964). "Spectral Distribution of Typical Daylight as a Function of Correlated Color Temperature". JOSA. 54 (8): 1031–1040. doi:10.1364/JOSA.54.001031.
- ↑ Condit, Harold R.; Grum, Frank (July 1964). "Spectral energy distribution of daylight". JOSA. 54 (7): 937–944. doi:10.1364/JOSA.54.000937. Retrieved 2008-05-13.
- ↑ Henderson, Stanley Thomas; Hodgkiss, D. (1963). "The spectral energy distribution of daylight". British Journal of Applied Physics. 14 (3): 125–131. doi:10.1088/0508-3443/14/3/307.
Henderson, Stanley Thomas; Hodgkiss, D. (1964). "The spectral energy distribution of daylight". British Journal of Applied Physics. 15 (8): 947–952. doi:10.1088/0508-3443/15/8/310. - ↑ Simonds, John L. (August 1963). "Application of Characteristic Vector Analysis to Photographic and Optical Response Data". JOSA. 53 (8): 968–974. doi:10.1364/JOSA.53.000968.
- ↑ Tzeng, Di-Yuan; Berns, Roy S. (April 2005). "A review of principal component analysis and its applications to color technology". Color Research & Application. 30 (2): 84–98. doi:10.1002/col.20086.
- ↑ Kelly, Kenneth L. (August 1963). "Lines of Constant Correlated Color Temperature Based on MacAdam's (u,v) Uniform Chromaticity Transformation of the CIE Diagram". JOSA. 53 (8): 999–1002. doi:10.1364/JOSA.53.000999.
- ↑ Commission Internationale de l'Eclairage (1964). Proceedings of the 15th Session, Vienna.
- ↑ Moon, Parry (November 1940). "Proposed standard solar-radiation curves for engineering use". Journal of the Franklin Institute. 230 (5): 583–617. doi:10.1016/S0016-0032(40)90364-7.
- ↑ CIE 1931 and 1964 Standard Colorimetric Observers from 380 nm to 780 nm in increments of 5 nm.
- ↑ Studies from the 1960s and 1970s include:
G. T. Winch; M. C. Boshoff; C. J. Kok & A. G. du Toit (April 1966). "Spectroradiometric and Colorimetric Characteristics of Daylight in the Southern Hemisphere: Pretoria, South Africa". JOSA. 56 (4): 456–464. doi:10.1364/JOSA.56.000456.The derived chromaticities were found to be much closer to the full radiator locus than those previously published, which had been obtained in the northern hemisphere.
Das, S.R.; Sastri, V.D.P. (March 1965). "Spectral Distribution and Color of Tropical Daylight". JOSA. 55 (3): 319–323. doi:10.1364/JOSA.55.000319.
Sastri, V.D.P.; Das, S.R. (March 1968). "Typical Spectral Distributions and Color for Tropical Daylight". JOSA. 58 (3): 391–398. doi:10.1364/JOSA.58.000391.
Sastri, V.D.P. (January 11, 1976). "Locus of daylight chromaticities in relation to atmospheric conditions". Journal of Physics D: Applied Physics. 9 (1): L1–L3. doi:10.1088/0022-3727/9/1/001.
Dixon, E.R. (April 1978). "Spectral distribution of Australian daylight". JOSA. 68 (4): 437–450. doi:10.1364/JOSA.68.000437.
Analyses using the faster computation of the 1990s and 2000s include:
Hernández-Andrés, Javier; Javier Romero; Antonio García-Beltrán; Juan L. Nieves (February 20, 1998). "Testing Linear Models on Spectral Daylight Measurements". Applied Optics. 37 (6): 971–977. doi:10.1364/AO.37.000971. PMID 18268673.
Hernández-Andrés, Javier; Javier Romero, Juan L. Nieves, and Raymond L. Lee, Jr. (June 2001). "Color and spectral analysis of daylight in southern Europe". JOSA A. 18 (6): 1325–1335. doi:10.1364/JOSAA.18.001325. Cite uses deprecated parameter|coauthors=(help)
Thanh Hai Bui; Reiner Lenz; Tomas Landelius (2004). Group theoretical investigations of daylight spectra (PDF). CGIV (European Conference on Colour Graphics, Imaging and Vision). pp. 437–442. Retrieved 2008-05-13. - 1 2 The coefficients differ from those in the original paper due to the change in the constants in Planck's law. See Lindbloom for the current version, and Planckian locus for details.
- ↑ Philips. "Optical Testing for SuperFlux, SnapLED and LUXEON Emitters" (PDF).
CIE has defined the color coordinates of several different white Illuminants, but within Lumileds, CIE Illuminant E is used for all color calculations
- ↑ For commercial examples of calcium halophosphate fluorescents, see for example US 5447660 Method for making a calcium halophosphate phosphor or US 6666993 Single component calcium halophosphate phosphor
- ↑ Spectral power distribution of Illuminants Series F (Excel), in 5 nm increments from 380 nm to 780 nm.
- ↑ Danny Pascale. "A Review of RGB color spaces" (PDF). Babel Color.
- ↑ Equivalent White Light Sources, and CIE Illuminants
- ↑ CIE F-series Spectral Data, CIE 15.2:1986
External links
- Selected colorimetric tables in Excel, as published in CIE 15:2004
- Konica Minolta Sensing: Light sources & Illuminants