Spectral leakage
The Fourier transform of a function of time, s(t), is a complex-valued function of frequency, S(f), often referred to as a frequency spectrum. Any linear time-invariant operation on s(t) produces a new spectrum of the form H(f)•S(f), which changes the relative magnitudes and/or angles (phase) of the non-zero values of S(f). Any other type of operation creates new frequency components that may be referred to as spectral leakage in the broadest sense. Sampling, for instance, produces leakage, which we call aliases of the original spectral component. For Fourier transform purposes, sampling is modeled as a product between s(t) and a Dirac comb function. The spectrum of a product is the convolution between S(f) and another function, which inevitably creates the new frequency components. But the term 'leakage' usually refers to the effect of windowing, which is the product of s(t) with a different kind of function, the window function. Window functions happen to have finite duration, but that is not necessary to create leakage. Multiplication by a time-variant function is sufficient.
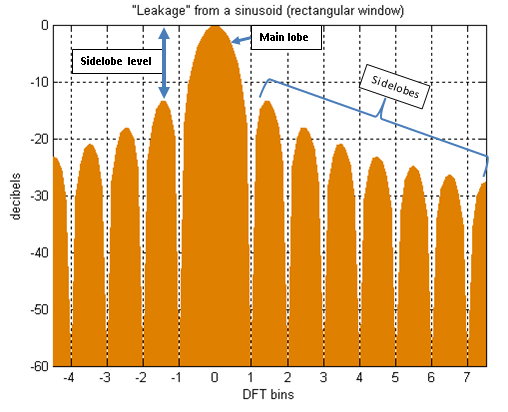
Leakage caused by a window function is most easily characterized by its effect on a sinusoidal s(t) function, whose unwindowed Fourier transform is zero for all but one frequency. The customary frequency of choice is 0 Hz, because the windowed Fourier transform is simply the Fourier transform of the window function itself:

Discrete-time functions
When both sampling and windowing are applied to s(t), in either order, the leakage caused by windowing is a relatively localized spreading of frequency components, with often a blurring effect, whereas the aliasing caused by sampling is a periodic repetition of the entire blurred spectrum.
Window tradeoffs
.png)
The total leakage of a window function is measured by a metric called equivalent noise bandwidth (ENBW)[1] or noise equivalent bandwidth (NEB). The best window in that regard is the simplest, called rectangular because of its flat top and vertical sides. Its spreading effect occurs mostly a factor of 10 to 100 below the amplitude of the original component. Unfortunately the spreading is very wide, which may mask important spectrum details at even lower levels. That prevents the rectangular window from being a popular choice. Non-rectangular window functions actually increase the total leakage, but they can also redistribute it to places where it does the least harm, depending on the application. Specifically, to different degrees they reduce the level of the spreading by increasing the high-level leakage in the near vicinity of the original component. In general, they control the trade-off between resolving comparable strength signals with similar frequencies or resolving disparate strength signals with dissimilar frequencies: one speaks of "high resolution" versus "high dynamic range" windows. And leakage near the original component is actually beneficial for a metric known as scalloping loss.
We customarily think of leakage as a spreading out of (say) a sinusoid in one "bin" of a DFT into the other bins at levels that generally decrease with distance. What that actually means is that when the actual sinusoid frequency lies in bin "k", its presence is sensed/recorded at different levels in the other bins; i.e. the correlations they measure are non-zero. The value measured in bin k+10 and plotted on the spectrum graph is the response of that measurement to the imperfect (i.e. windowed) sinusoid 10 bins away. And when the input is just white noise (energy at all frequencies), the value measured in bin k is the sum of its responses to a continuum of frequencies. One could say that leakage is actually a leaking in process, rather than leaking out. That perspective might help to interpret the different noise-floor levels between the two graphs in the figure on the right. Both spectra were made from the same data set with the same noise power. But the bins in the bottom graph each responded more strongly than the bins in the top graph. The exact amount of the difference is given by the ENBW difference of the two window functions.
Citations
- ↑ Harris, Fredric j. (Jan 1978). "On the use of Windows for Harmonic Analysis with the Discrete Fourier Transform" (PDF). Proceedings of the IEEE. 66 (1): 51–83. doi:10.1109/PROC.1978.10837. Article on FFT windows which introduced many of the key metrics used to compare windows.
See also
- Window_function#Windowing
- DTFT#Sampling_the_DTFT
- Knife-edge effect, spatial analog of truncation
- Gibbs phenomenon