Southampton Itchen (UK Parliament constituency)
| Southampton, Itchen | |
|---|---|
|
Borough constituency for the House of Commons | |
|
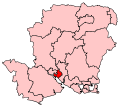
Boundary of Southampton, Itchen in Hampshire. | |
|
Location of Hampshire within England. | |
| County | Hampshire |
| Electorate | 74,513 (December 2010)[1] |
| Major settlements | Southampton |
| Current constituency | |
| Created | 1950 |
| Member of parliament | Royston Smith (Conservative) |
| Number of members | One |
| Created from | Southampton |
| Overlaps | |
| European Parliament constituency | South East England |

Southampton, Itchen is a constituency[n 1] represented in the House of Commons of the UK Parliament since 2015 by Royston Smith, a Conservative member of parliament.[n 2]
History
The constituency was created in 1950, when the previous two-member Southampton constituency was abolished.
The constituency is named after the River Itchen, which flows through it and is the lesser of the two major rivers that reach the tidal estuary of Southampton Water at the city. Although until the 1970s it was a safe Labour seat, it elected a Conservative MP, Christopher Chope in 1983 and 1987 after the sitting MP Bob Mitchell left Labour in 1981 for the SDP. The combination of Mitchell as a strong SDP-Liberal Alliance candidate in both 1983 and 1987, together with Conservative landslides, made Southampton Itchen highly competitive.
The former Labour MP, John Denham, narrowly defeated Chope by 551 votes in 1992 and held the seat with more substantial majorities until 2010 when he won by just 192 votes. These two election results with marginal majorities, with moderate third-party polling, and the Conservative gain in 2015, indicate Southampton Itchen may now be thought of as a two-party marginal seat.
Royston Smith unexpectedly regained the seat for the Conservative Party in 2015. He had previously led the Conservative group on the city council and had contested the seat in 2010.
Boundaries
1950-1983: The County Borough of Southampton wards of Bevois, Bitterne and Peartree, Bitterne and Sholing, Newtown, Northam, Portswood, St Denys, St Mary's, Trinity, and Woolston.
1983-1997: The City of Southampton wards of Bargate, Bitterne, Bitterne Park, Harefield, Peartree, St Luke's, and Sholing.
1997-present: The City of Southampton wards of Bargate, Bitterne, Bitterne Park, Harefield, Peartree, Sholing, and Woolston.
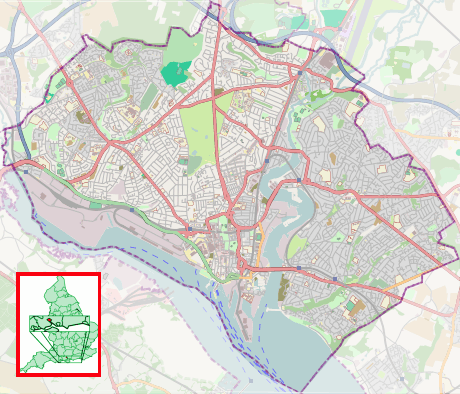
The seat covers the eastern part of the City of Southampton, in southern England, specifically the city centre, the eastern port areas (the Port of Southampton is one of the principal ports of the UK), the exclusive Ocean Village quarter, the inner city council estates and the economically-deprived Thornhill estate on its eastern boundary. It is seen as the more working class of the two constituencies in the city (the other is Southampton Test – named after the other major river).
The constituency is bounded to the west by Southampton Test (Labour), to the north and east by Eastleigh (Conservative) and in the far north by Romsey and Southampton North (Conservative).
Constituency profile
Workless claimants, registered jobseekers, were in November 2012 close to but slightly below than the national average of 3.8%, at 3.5% of the population based on a statistical compilation by The Guardian, above the average for the South East seats of 2.5% but below, for example, five seats in East Kent.[2]
Members of Parliament
| Election | Member[3] | Party | |
|---|---|---|---|
| 1950 | Ralph Morley | Labour | |
| 1955 | Dr Horace King | Labour | |
| 1965 | Speaker | ||
| 1971 by-election | Bob Mitchell | Labour | |
| 1981 | SDP | ||
| 1983 | Christopher Chope | Conservative | |
| 1992 | John Denham | Labour | |
| 2015 | Royston Smith | Conservative | |
Elections
Elections in the 2010s
| Party | Candidate | Votes | % | ± | |
|---|---|---|---|---|---|
| Conservative | Royston Smith | 18,656 | 41.7 | +5.4 | |
| Labour | Rowenna Davis | 16,340 | 36.5 | -0.2 | |
| UKIP | Kim Rose | 6,010 | 13.4 | +9.1 | |
| Green | John Spottiswoode | 1,876 | 4.2 | +2.8 | |
| Liberal Democrat | Eleanor Bell | 1,595 | 3.6 | -17.3 | |
| TUSC | Sue Atkins | 233 | 0.5 | +0.1 | |
| Majority | 2,316 | 5.2 | +4.8 | ||
| Turnout | 44,710 | 61.8 | +2.2 | ||
| Conservative gain from Labour | Swing | 2.8 | |||
| Party | Candidate | Votes | % | ± | |
|---|---|---|---|---|---|
| Labour | John Denham | 16,326 | 36.8 | −11.5 | |
| Conservative | Royston Smith | 16,134 | 36.3 | +9.0 | |
| Liberal Democrat | David Goodall | 9,256 | 20.8 | +0.1 | |
| UKIP | Alan Kebbell | 1,928 | 4.3 | +0.6 | |
| Green | John Spottiswoode | 600 | 1.4 | +1.4 | |
| TUSC | Tim Cutter | 168 | 0.4 | +0.4 | |
| Majority | 192 | 0.4 | -21.1 | ||
| Turnout | 44,412 | 59.6 | +4.8 | ||
| Labour hold | Swing | −10.3 | |||
Elections in the 2000s
| Party | Candidate | Votes | % | ± | |
|---|---|---|---|---|---|
| Labour | John Denham | 20,871 | 48.3 | −6.2 | |
| Conservative | Flick Drummond | 11,569 | 26.8 | −0.6 | |
| Liberal Democrat | David Goodall | 9,162 | 21.2 | +6.2 | |
| UKIP | Kim Rose | 1,623 | 3.8 | +1.8 | |
| Majority | 9,302 | 21.5 | |||
| Turnout | 43,225 | 55.5 | 1.5 | ||
| Labour hold | Swing | −2.8 | |||
| Party | Candidate | Votes | % | ± | |
|---|---|---|---|---|---|
| Labour | John Denham | 22,553 | 54.5 | −0.3 | |
| Conservative | Caroline Nokes | 11,330 | 27.4 | −1.0 | |
| Liberal Democrat | Mark Cooper | 6,195 | 15.0 | +3.3 | |
| UKIP | Kim Rose | 829 | 2.0 | +1.7 | |
| Socialist Alliance | Gavin Marsh | 241 | 0.6 | ||
| Socialist Labour | Michael Holmes | 225 | 0.5 | ||
| Majority | 11,223 | 27.1 | |||
| Turnout | 41,373 | 54.0 | |||
| Labour hold | Swing | +0.37 | |||
Electorate: 76,603
Elections in the 1990s
| Party | Candidate | Votes | % | ± | |
|---|---|---|---|---|---|
| Labour | John Denham | 29,498 | 54.8 | +10.8 | |
| Conservative | Peter Fleet | 15,269 | 28.4 | −13.7 | |
| Liberal Democrat | David Harrison | 6,289 | 11.7 | −2.2 | |
| Referendum | John Clegg | 1,660 | 3.1 | N/A | |
| Socialist Labour | Kim Rose | 628 | 1.2 | N/A | |
| UKIP | Clive Hoar | 172 | 0.3 | N/A | |
| Socialist Alternative | Gavin Marsh | 113 | 0.2 | N/A | |
| Natural Law | Rosemary Barry | 110 | 0.2 | N/A | |
| ProLife Alliance | Ferdi McDermott | 99 | 0.2 | N/A | |
| Majority | 14,220 | 26.4 | +21.4 | ||
| Turnout | 53,838 | 70.0 | |||
| Labour hold | Swing | +12.3 | |||
Electorate: 76,869
| Party | Candidate | Votes | % | ± | |
|---|---|---|---|---|---|
| Labour | John Denham | 24,402 | 44.0 | +11.9 | |
| Conservative | Christopher Chope | 23,851 | 43.0 | −1.3 | |
| Liberal Democrat | James R.T. Hodgson | 7,221 | 13.0 | −10.6 | |
| Majority | 551 | 1.0 | −11.2 | ||
| Turnout | 55,474 | 76.9 | +1.1 | ||
| Labour gain from Conservative | Swing | +6.6 | |||
Elections in the 1980s
| Party | Candidate | Votes | % | ± | |
|---|---|---|---|---|---|
| Conservative | Christopher Chope | 24,419 | 44.3 | ||
| Labour | John Denham | 17,703 | 32.1 | ||
| Social Democratic | Bob Mitchell | 13,006 | 23.6 | ||
| Majority | 6,716 | 12.2 | |||
| Turnout | 75.9 | ||||
| Conservative hold | Swing | ||||
| Party | Candidate | Votes | % | ± | |
|---|---|---|---|---|---|
| Conservative | Christopher Chope | 21,937 | 41.5 | ||
| Social Democratic | Bob Mitchell | 16,647 | 31.5 | ||
| Labour | John Denham | 14,324 | 27.1 | ||
| Majority | 5,290 | 10.0 | |||
| Turnout | 73.3 | ||||
| Conservative gain from Social Democratic | Swing | ||||
Elections in the 1970s
| Party | Candidate | Votes | % | ± | |
|---|---|---|---|---|---|
| Labour | Bob Mitchell | 28,036 | 46.3 | ||
| Conservative | Andrew Hunter | 26,434 | 43.6 | ||
| Liberal | John Pindar | 6,132 | 10.1 | ||
| Majority | 1,602 | 2.6 | |||
| Turnout | 74.7 | ||||
| Labour hold | Swing | ||||
| Party | Candidate | Votes | % | ± | |
|---|---|---|---|---|---|
| Labour | Bob Mitchell | 28,168 | 48.9 | ||
| Conservative | P. T. James | 20,373 | 35.4 | ||
| Liberal | Joseph Cherryson | 9,071 | 15.7 | ||
| Majority | 7,795 | 13.5 | |||
| Turnout | 70.3 | ||||
| Labour hold | Swing | ||||
| Party | Candidate | Votes | % | ± | |
|---|---|---|---|---|---|
| Labour | Bob Mitchell | 27,557 | 44.0 | ||
| Conservative | P. T. James | 21,967 | 35.0 | ||
| Liberal | Joseph Cherryson | 13,173 | 21.0 | ||
| Majority | 5,590 | 8.9 | |||
| Turnout | 77.2 | ||||
| Labour hold | Swing | ||||
| Party | Candidate | Votes | % | ± | |
|---|---|---|---|---|---|
| Labour | Bob Mitchell | 22,575 | 55.36 | N/A | |
| Conservative | James Spicer | 12,900 | 31.63 | N/A | |
| National Democratic | Edwin Bray | 3,090 | 7.58 | ||
| Liberal | Joseph Cherryson | 2,214 | 5.43 | ||
| Majority | 9,675 | 23.73 | |||
| Turnout | 40,779 | ||||
| Labour gain from Speaker | Swing | ||||
| Party | Candidate | Votes | % | ± | |
|---|---|---|---|---|---|
| Speaker | Horace King | 29,417 | 67.2 | ||
| National Democratic | Edwin Bray | 9,581 | 21.9 | ||
| Independent | Brian Henry Phillips | 4,794 | 11.0 | ||
| Majority | 19,836 | 45.3 | |||
| Turnout | 54.1 | ||||
| Speaker hold | Swing | ||||
Elections in the 1960s
| Party | Candidate | Votes | % | ± | |
|---|---|---|---|---|---|
| Speaker | Horace King | 30,463 | 85.4 | ||
| Independent | K. D. Hunt | 5,217 | 14.6 | ||
| Majority | 25,246 | 70.8 | |||
| Turnout | 49.0 | ||||
| Speaker hold | Swing | ||||
| Party | Candidate | Votes | % | ± | |
|---|---|---|---|---|---|
| Labour | Horace King | 28,949 | 52.7 | ||
| Conservative | G. G. Olson | 18,974 | 34.5 | ||
| Liberal | Joseph Cherryson | 7,007 | 12.8 | ||
| Majority | 9,975 | 18.2 | |||
| Turnout | 76.1 | ||||
| Labour hold | Swing | ||||
Elections in the 1950s
| Party | Candidate | Votes | % | ± | |
|---|---|---|---|---|---|
| Labour | Horace King | 29,123 | 53.42 | ||
| Conservative | Evelyn King | 25,390 | 46.58 | ||
| Majority | 3,733 | 6.85 | |||
| Turnout | 78.00 | ||||
| Labour hold | Swing | ||||
| Party | Candidate | Votes | % | ± | |
|---|---|---|---|---|---|
| Labour | Horace King | 29,149 | 55.49 | ||
| Conservative | L.T. Loader | 23,378 | 44.51 | ||
| Majority | 5,771 | 10.99 | |||
| Turnout | 78.28 | ||||
| Labour hold | Swing | ||||
| Party | Candidate | Votes | % | ± | |
|---|---|---|---|---|---|
| Labour | Ralph Morley | 30,330 | 54.12 | ||
| Liberal National | R.J. Stranger | 25,708 | 45.88 | ||
| Majority | 4,622 | 8.25 | |||
| Turnout | 83.59 | ||||
| Labour hold | Swing | ||||
| Party | Candidate | Votes | % | ± | |
|---|---|---|---|---|---|
| Labour | Ralph Morley | 29,749 | 53.44 | N/A | |
| Liberal National | Sir Robert Hampden Hobart | 24,536 | 44.08 | N/A | |
| Independent Conservative | William Craven Craven-Ellis | 1,380 | 2.48 | N/A | |
| Majority | 5,213 | 9.36 | N/A | ||
| Turnout | 84.0 | N/A | |||
| Labour win (new seat) | |||||
See also
Notes and references
- Notes
- ↑ A borough constituency (for the purposes of election expenses and type of returning officer)
- ↑ As with all constituencies, the constituency elects one Member of Parliament (MP) by the first past the post system of election at least every five years.
- References
- ↑ "Electorate Figures – Boundary Commission for England". 2011 Electorate Figures. Boundary Commission for England. 4 March 2011. Retrieved 13 March 2011.
- ↑ Unemployment claimants by constituency The Guardian
- ↑ Leigh Rayment's Historical List of MPs – Constituencies beginning with "I"
- ↑ "Election Data 2015". Electoral Calculus. Archived from the original on 17 October 2015. Retrieved 17 October 2015.
- ↑ Archived 15 April 2015 at the Wayback Machine.
- ↑ "BBC NEWS – Election 2015 – Southampton Itchen". BBC News.
- ↑ "Election Data 2010". Electoral Calculus. Archived from the original on 26 July 2013. Retrieved 17 October 2015.
- ↑ "Election Data 2005". Electoral Calculus. Archived from the original on 15 October 2011. Retrieved 18 October 2015.
- ↑ "Election Data 2001". Electoral Calculus. Archived from the original on 15 October 2011. Retrieved 18 October 2015.
- ↑ "Election Data 1997". Electoral Calculus. Archived from the original on 15 October 2011. Retrieved 18 October 2015.
- ↑ "Politics Resources". Election 1997. Politics Resources. 1 May 1997. Retrieved 7 January 2011.
- ↑ C. Rallings & M. Thrasher, The Media Guide to the New Parliamentary Constituencies, p.150 (Plymouth: LGC Elections Centre, 1995)
- ↑ The 1997 election result is calculated relative to the notional, not the actual, 1992 result.
- ↑ "Election Data 1992". Electoral Calculus. Archived from the original on 15 October 2011. Retrieved 18 October 2015.
- ↑ "Politics Resources". Election 1992. Politics Resources. 9 April 1992. Retrieved 6 December 2010.
- ↑ "Election Data 1987". Electoral Calculus. Archived from the original on 15 October 2011. Retrieved 18 October 2015.
- ↑ "Election Data 1983". Electoral Calculus. Archived from the original on 15 October 2011. Retrieved 18 October 2015.
| Parliament of the United Kingdom | ||
|---|---|---|
| Preceded by Cities of London and Westminster |
Constituency represented by the Speaker 1965–1971 |
Succeeded by Wirral |
Areas and suburbs of Southampton | |||||||||
|---|---|---|---|---|---|---|---|---|---|
| |||||||||
| Southampton Itchen |
| ||||||||
| Southampton Test | |||||||||
| Romsey and Southampton North | |||||||||
| |||||||||
Coordinates: 50°55′N 1°21′W / 50.917°N 1.350°W