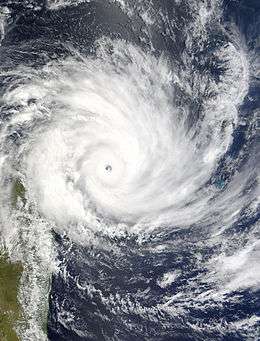
South-West Indian Ocean tropical cyclone
In the south-west Indian Ocean, tropical cyclones form south of the equator and west of 90° E to the coast of Africa.
Warnings and nomenclature
Each year, the Météo-France office (MFR) based on Réunion island issues warnings on tropical cyclones within the basin, which is defined as the waters of the Indian Ocean from the coast of Africa to 90° E, south of the equator. The agency issues the warnings as part of its role as a Regional Specialized Meteorological Center, designated as such in 1993 by the World Meteorological Organization. Intensities are estimated through the Dvorak technique, which utilizes images from satellites by the American National Oceanic and Atmospheric Administration.[1][2]
The Joint Typhoon Warning Center – a joint United States Navy – United States Air Force task force – also issues tropical cyclone warnings for the region.[3] Wind estimates from Météo-France and most other basins throughout the world are sustained over 10 minutes, while estimates from the United States-based Joint Typhoon Warning Center are sustained over 1 minute. 1-minute winds are about 1.14 times the amount of 10-minute winds.[4]
If a tropical storm in the basin strengthens to attain 10 minute sustained winds of at least 120 km/h (75 mph), the MFR classifies it as a tropical cyclone, equivalent to a hurricane or typhoon (a use of "tropical cyclone" which is more restrictive than the usual definition).[5]
History of the basin
The first storm in the database for MFR originated on January 11, 1848. In January 1960, the first named storm was Alex, and each subsequent year had a list of storm names. Beginning in 1967, satellites helped locate cyclones in the basin, and in the following year, the MFR began estimating storm intensities from the satellite images. By 1977, the agency was using the Dvorak technique on an unofficial basis, but officially adopted it in 1981. Originally, the basin only extended to 80° E, and while it was extended eastward to the current 90° E, a lack of satellite imagery initially made data uncertain east of 80° E. The World Meteorological Organization designated the MFR as a Regional Tropical Cyclones Advisory Centre in 1988, and upgraded it to a Regional Specialized Meteorological Center in 1993. In May 1998, two Europe-based Meteosat satellites began providing complete coverage of the basin. On July 1, 2002, the MFR shifted the cyclone year to begin on this date and end on June 30 of the following year; previously, the cyclone year began on August 1 and ended on the subsequent July 31. In 2003, the MFR extended their area of warning responsibility to 40° S, having previously been limited at 30° S.[2] During 2011, MFR started a reanalysis project of all tropical systems between 1978–98, with methods such as a Dvorak technique reanalysis and use of microwave imagery.[6] Preliminary results from this reanalysis project include correcting an increasing trend in the number of very intense tropical cyclones in the basin since 1978.[6] This also revealed a seemingly systematic underestimation of tropical cyclone intensities in the past.[6]
Statistics
From the 1980–81 to the 2010–11 season, there was an average of 9.3 tropical storms each year in the basin. A tropical storm has 10 minute winds of at least 65 km/h (40 mph). There are an average of five storms that become tropical cyclones, which have 10 minute winds of at least 120 km/h (75 mph).[7] As of 2002, there was an average of 54 days when tropical systems were active in the basin, of which 20 had tropical cyclones active, or a system with winds of over 120 km/h (75 mph). The median start date for the season was November 17, and the median end date was April 20.[1]
Climatology
Generally, the monsoon does not cross into the Mozambique Channel until December; as a result, storms rarely form there before that time.[1] From 1948 to 2010, 94 tropical systems developed in the small body of water, of which about half made landfall.[8] Occasionally, small storms form in the Mozambique Channel that resemble Mediterranean tropical cyclones or storms in the northeastern Atlantic Ocean; these systems are well-organized but have weaker convection than typical tropical cyclones, and originate over cooler than normal water temperatures of less than 26 °C (79 °F). A survey in 2004 conducted by weather expert Gary Padgett found meteorologists split whether these storms should be classified as tropical or subtropical.[9]
In an average year, ten tropical depressions or storms strike Madagascar, and most generally do not cause much damage.[10] Occasionally, storms or their remnants enter the interior of southeastern Africa, bringing heavy rainfall to Zimbabwe.[11]
Seasons
- List of South-West Indian Ocean cyclones before 1963
- 1962–63 South-West Indian Ocean cyclone season
- 1963–64 South-West Indian Ocean cyclone season
- 1964–65 South-West Indian Ocean cyclone season
- 1965–66 South-West Indian Ocean cyclone season
- 1966–67 South-West Indian Ocean cyclone season
- 1967–68 South-West Indian Ocean cyclone season
- 1968–69 South-West Indian Ocean cyclone season
- 1969–70 South-West Indian Ocean cyclone season
1970s
| Season | TD's | TS | TC | ITC | VITC | Strongest storm | Deaths | Damage USD | Notes and References |
|---|---|---|---|---|---|---|---|---|---|
| 1970–1971 | Maggie-Muriel | ||||||||
| 1971–1972 | Fabienne | ||||||||
| 1972–1973 | Lydie | ||||||||
| 1973–1974 | Deidre-Delinda | ||||||||
| 1974–1975 | Gervaise | ||||||||
| 1975–1976 | Terry-Danae | ||||||||
| 1976–1977 | Jack-Io | ||||||||
| 1977–1978 | Aurore | ||||||||
| 1978–1979 | Celine | ||||||||
| 1979–1980 | Viola-Claudette |
1980s
| Season | TS | TC | ITC | Strongest storm | Deaths | Damage USD | Notes and References |
|---|---|---|---|---|---|---|---|
| 1980–81 | 10 | 3 | 1 | Alice-Adelaide/Florine | |||
| 1981–82 | 10 | 3 | 1 | Chris-Damia | |||
| 1982–83 | 3 | 0 | 0 | Bemany/Elinah | 33 | $23 million | |
| 1983–84 | 11 | 4 | 4 | Andry/Annette-Jaminy/Kamisy | 356 | $496 million | |
| 1984–85 | 8 | 1 | 0 | Helisaonina | 0 | Unknown | |
| 1985–86 | 12 | 5 | 1 | Erinesta | 32 | Unknown | |
| 1986–87 | 5 | 1 | 0 | Daodo | 10 | $2 million | |
| 1987–88 | 9 | 4 | 1 | Gasitao | 100 | $10 million | |
| 1988–89 | 11 | 5 | 0 | Leon-Hanitra/Krissy | 11 | $217 million | |
| 1989–90 | 9 | 4 | 1 | Walter-Gregoara | 46 | $1.5 million |
1990s
| Season | TD's | TS | TC | ITC | VITC | Strongest storm | Deaths | Damage USD | Notes and References |
|---|---|---|---|---|---|---|---|---|---|
| 1990–91 | 11 | 7 | 5 | 0 | 0 | Bella | |||
| 1991–92 | 13 | 10 | 3 | 1 | 0 | Harriet-Heather | |||
| 1992–93 | 15 | 12 | 4 | 2 | 0 | Edwina | [A 1][12] | ||
| 1993–94 | 15 | 14 | 8 | 4 | 0 | Geralda | 558 | ||
| 1994–95 | 13 | 11 | 5 | 3 | 0 | Marlene | [13] | ||
| 1995–96 | 11 | 10 | 6 | 3 | 0 | Bonita | 11 | [14] | |
| 1996–97 | 12 | 12 | 5 | 4 | 0 | Daniella | 227 | ||
| 1997–98 | 16 | 8 | 5 | 1 | 0 | Anacelle | |||
| 1998–99 | 14 | 6 | 2 | 2 | 0 | Evrina | |||
| 1999-00 | 14 | 9 | 4 | 3 | 1 | Hudah | 1,073 | [15] |
2000s
| Season | TD's | TS | TC | ITC | VITC | Strongest storm | Deaths | Damage USD | Notes and References |
|---|---|---|---|---|---|---|---|---|---|
| 2000–01 | 11 | 8 | 5 | 4 | 0 | Charly | 2 | [A 1][16] | |
| 2001–02 | 15 | 11 | 9 | 5 | 1 | Hary | 52 | $287 million | [17] |
| 2002–03 | 14 | 12 | 7 | 3 | 0 | Kalunde | 149 | $3.02 million | [A 1] |
| 2003–04 | 16 | 11 | 8 | 3 | 1 | Gafilo | 396 | $250 million | [18][19] |
| 2004–05 | 18 | 10 | 4 | 3 | 2 | Juliet | 253 | [19] | |
| 2005–06 | 13 | 6 | 3 | 2 | 0 | Carina | 26 | [20][21] | |
| 2006–07 | 15 | 11 | 7 | 6 | 0 | Dora/Favio | 174 | $266 million | [A 1][21] |
| 2007–08 | 15 | 12 | 6 | 4 | 0 | Hondo | 127 | $38 million | [21] |
| 2008–09 | 12 | 10 | 2 | 2 | 0 | Fanele/Gael | 32 | [22] | |
| 2009–10 | 16 | 10 | 5 | 2 | 1 | Edzani | 120 | [A 1][22][23] |
2010s
| Season | TD's | TS | TC | ITC | VITC | Strongest storm | Deaths | Damage USD | Notes and References |
|---|---|---|---|---|---|---|---|---|---|
| 2010-11 | 9 | 4 | 2 | 1 | 0 | Bingiza | 22 | [A 1][24] | |
| 2011-12 | 14 | 10 | 3 | 2 | 0 | Giovanna | 164 | [A 1][24] | |
| 2012-13 | 10 | 10 | 7 | 3 | 0 | Anais | 35 | $46 million | |
| 2013-14 | 13 | 11 | 5 | 5 | 2 | Bruce | 11 | $89.2 million | |
| 2014-15 | 13 | 11 | 5 | 3 | 2 | Eunice | 111 | $46.4 million | |
| 2015-16 | 8 | 8 | 3 | 3 | 1 | Fantala | 13 | $4.5 million | [25] |
| 2016-17 | 1 | 1 | 0 | 0 | 0 | Abela |
See also
- Tropical cyclone
- Atlantic hurricane season
- Pacific hurricane season
- Pacific typhoon season
- North Indian Ocean tropical cyclone season
- Australian region tropical cyclone season
- South Pacific tropical cyclone season
Notes
References
- 1 2 3 "Cyclone Season 2001–2002". RSMC La Reunion. Meteo-France. Retrieved April 28, 2013.
- 1 2 Philippe Caroff; et al. (June 2011). Operational procedures of TC satellite analysis at RSMC La Reunion (PDF) (Report). World Meteorological Organization. Archived from the original (PDF) on 2014-10-06. Retrieved 2014-01-11.
- ↑ Annual Tropical Cyclone Report (PDF) (Report). Joint Typhoon Warning Center. p. iii, 218, 240. Retrieved 2014-01-11.
- ↑ Chris Landsea (2006-04-21). "Subject: D4) What does "maximum sustained wind" mean? How does it relate to gusts in tropical cyclones?". Frequently Asked Questions. Hurricane Research Division. Retrieved 2013-07-30.
- ↑ Chris Landsea (2001-07-15). "Subject: A1) What is a hurricane, typhoon, or tropical cyclone?". Frequently Asked Questions. Hurricane Research Division. Retrieved 2015-02-20.
- 1 2 3 Philippe Caroff (October 23, 2015). Review of recent (2012-2015) main activities and achievements at RSMC La Reunion (docx). Eighth tropical cyclone technical coordination meeting (TCM-8). World Meteorological Organization. Retrieved November 1, 2015.
- ↑ Chris Landsea; Sandy Delgado (2014-05-01). "Subject: E10) What are the average, most, and least tropical cyclones occurring in each basin?". Frequently Asked Questions. Hurricane Research Division. Retrieved 2014-10-13.
- ↑ Corene J. Matyas (2014-04-07). "Tropical cyclone formation and motion in the Mozambique Channel". International Journal of Climatology. Bibcode:2015IJCli..35..375M. doi:10.1002/joc.3985. Retrieved 2015-02-20.
- ↑ "June 2004 Monthly Global Tropical Cyclone Summary". Gary Padgett. Retrieved 2015-02-20.
- ↑ Cyclone Rehabilitation Project (PDF) (Report). World Bank. 1992-05-11. Retrieved 2015-02-20.
- ↑ A. Mhizha; M. Musariri; E. Madamombe; Tererai (2012-01-23). Preliminary Water Resources Assessment for the Limpopo River Basin (PDF) (Report). University of Zimbabwe. Retrieved 2015-03-05.
- ↑ RSMC La Reunion Tropical Cyclone Centre. Cyclone Season 1992–1993 (Report). Meteo-France. Retrieved December 20, 2012.
- ↑ RSMC La Reunion Tropical Cyclone Centre. Cyclone Season 1994–1995 (Report). Meteo-France. Retrieved December 20, 2012.
- ↑ RSMC La Reunion Tropical Cyclone Centre. Cyclone Season 1995–1996 (Report). Meteo-France. Retrieved December 20, 2012.
- ↑ RSMC La Reunion Tropical Cyclone Centre. Cyclone Season 1999–2000 (Report). Meteo-France. Retrieved December 20, 2012.
- ↑ RSMC La Reunion Tropical Cyclone Centre. Cyclone Season 2000–2001 (Report). Meteo-France. Retrieved November 26, 2012.
- ↑ RSMC La Reunion Tropical Cyclone Centre. Cyclone Season 2001–2002 (Report). Meteo-France. Retrieved November 26, 2012.
- ↑ RSMC La Reunion Tropical Cyclone Centre. Cyclone Season 2003–2004 (Report). Meteo-France. Retrieved December 20, 2012.
- 1 2 RA I Tropical Cyclone Committee for the South-West Indian Ocean (2006-06-16). RA I Tropical Cyclone Committee for the South-West Indian Ocean Seventeenth Session (PDF) (Final Report). World Meteorological Organisation. pp. 30–32. Retrieved December 20, 2012.
- ↑ RSMC La Reunion Tropical Cyclone Centre. Cyclone Season 2005–2006 (Report). Meteo-France. Retrieved December 20, 2012.
- 1 2 3 RA I Tropical Cyclone Committee for the South-West Indian Ocean (2010-09-15). RA I Tropical Cyclone Committee for the South-West Indian Ocean Eighteenth Session (PDF) (Final Report). World Meteorological Organisation. p. 31. Retrieved December 20, 2012.
- 1 2 RA I Tropical Cyclone Committee for the South-West Indian Ocean (August 3, 2011). RA I Tropical Cyclone Committee for the South-West Indian Ocean Nineteenth Session (PDF) (Final Report). World Meteorological Organisation. pp. 5–8. Retrieved December 20, 2012.
- ↑ Padgett, Gary (1997–2011). "Monthly Global Tropical Cyclone Summaries". Archived from the original on 2011. Retrieved July 25, 2012.
- 1 2 RA I Tropical Cyclone Committee for the South-West Indian Ocean (December 3, 2012). RA I Tropical Cyclone Committee for the South-West Indian Ocean Twentieth Session (PDF) (Final Report). World Meteorological Organisation. pp. 2, 7, 8. Archived from the original on December 20, 2012. Retrieved December 20, 2012.
- ↑ $4.5 million in damages from cyclone that hit remote Seychellois island, World Bank says (Seychelles News Agency, May 17, 2016)