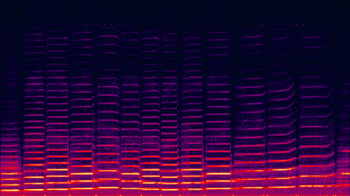
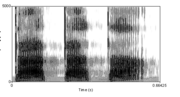
Spectrogram

A spectrogram is a visual representation of the spectrum of frequencies in a sound or other signal as they vary with time or some other variable. Spectrograms are sometimes called spectral waterfalls, voiceprints, or voicegrams.
Spectrograms can be used to identify spoken words phonetically, and to analyse the various calls of animals. They are used extensively in the development of the fields of music, sonar, radar, and speech processing,[1] seismology, etc.
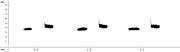
The sample outputs on the right show a select block of frequencies going up the vertical axis, and time on the horizontal axis.
Format
A common format is a graph with two geometric dimensions: the horizontal axis represents time or rpm, the vertical axis is frequency; a third dimension indicating the amplitude of a particular frequency at a particular time is represented by the intensity or color of each point in the image.
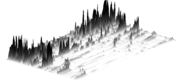
There are many variations of format: sometimes the vertical and horizontal axes are switched, so time runs up and down; sometimes the amplitude is represented as the height of a 3D surface instead of color or intensity. The frequency and amplitude axes can be either linear or logarithmic, depending on what the graph is being used for. Audio would usually be represented with a logarithmic amplitude axis (probably in decibels, or dB), and frequency would be linear to emphasize harmonic relationships, or logarithmic to emphasize musical, tonal relationships.
|


Generation
Spectrograms are usually created in one of two ways: approximated as a filterbank that results from a series of band-pass filters (this was the only way before the advent of modern digital signal processing), or calculated from the time signal using the Fourier transform. These two methods actually form two different time–frequency representations, but are equivalent under some conditions.
The bandpass filters method usually uses analog processing to divide the input signal into frequency bands; the magnitude of each filter's output controls a transducer that records the spectrogram as an image on paper.[2]
Creating a spectrogram using the FFT is a digital process. Digitally sampled data, in the time domain, is broken up into chunks, which usually overlap, and Fourier transformed to calculate the magnitude of the frequency spectrum for each chunk. Each chunk then corresponds to a vertical line in the image; a measurement of magnitude versus frequency for a specific moment in time (the midpoint of the chunk). These spectrums or time plots are then "laid side by side" to form the image or a three-dimensional surface,[3] or slightly overlapped in various ways, i.e. windowing. This process essentially corresponds to computing the squared magnitude of the short-time Fourier transform (STFT) of the signal — that is, for a window width , .[4]


Applications
- Early analog spectrograms were applied to a wide range of areas including the study of bird calls (such as that of the great tit), with current research continuing using modern digital equipment[5] and applied to all animal sounds. Contemporary use of the digital spectrogram is especially useful for studying frequency modulation (FM) in animal calls. Specifically, the distinguishing characteristics of FM chirps, broadband clicks, and social harmonizing are most easily visualized with the spectrogram.
- Spectrograms are useful in assisting in overcoming speech defects and in speech training for the portion of the population that is profoundly deaf[6]
- The studies of phonetics and speech synthesis are often facilitated through the use of spectrograms.[7][8]
- By reversing the process of producing a spectrogram, it is possible to create a signal whose spectrogram is an arbitrary image. This technique can be used to hide a picture in a piece of audio and has been employed by several electronic music artists.[9] See also steganography.
- Some modern music is created using spectrograms as an intermediate medium; changing the intensity of different frequencies over time, or even creating new ones, by drawing them and then inverse transforming. See Audio timescale-pitch modification and Phase vocoder.
- Spectrograms can be used to analyze the results of passing a test signal through a signal processor such as a filter in order to check its performance.[10]
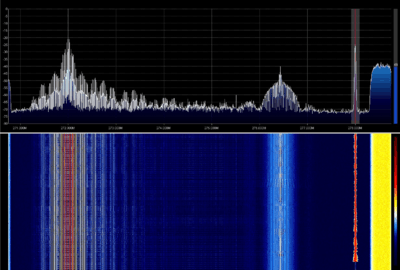
- High definition spectrograms are used in the development of RF and microwave systems[11]
- Spectrograms are now used to display S-parameters measured with vector network analyzers[12]
- The US Geological Survey now provides real-time spectrogram displays from seismic stations[13]
Limitations and resynthesis
From the formula above, it appears that a spectrogram contains no information about the exact, or even approximate, phase of the signal that it represents. For this reason, it is not possible to reverse the process and generate a copy of the original signal from a spectrogram, though in situations where the exact initial phase is unimportant it may be possible to generate a useful approximation of the original signal. The Analysis & Resynthesis Sound Spectrograph is an example of a computer program that attempts to do this. The Pattern Playback was an early speech synthesizer, designed at Haskins Laboratories in the late 1940s, that converted pictures of the acoustic patterns of speech (spectrograms) back into sound.
In fact, there is some phase information in the spectrogram, but it appears in another form, as time delay (or group delay) which is the dual of the Instantaneous Frequency .
The size and shape of the analysis window can be varied. A smaller (shorter) window will produce more accurate results in timing, at the expense of precision of frequency representation. A larger (longer) window will provide a more precise frequency representation, at the expense of precision in timing representation.
See also
- Acoustic signature
- Chromagram
- Generalized spectrogram
- List of unexplained sounds
- Reassignment method
- Scaleogram
- Short-time Fourier transform
- Spectral music
- Spectrometer
- Spectrum
- Strobe tuner
- Time-frequency representation
- Waterfall plot
- Wavelet transform
References
- ↑ JL Flanagan, Speech Analysis, Synthesis and Perception, Springer- Verlag, New York, 1972
- ↑ Illustration of an electro-mechanical spectrograph
- ↑ Spectrogram definition
- ↑ STFT spectrogram details
- ↑ Bird Songs and Spectrograms of Southern Tuscany
- ↑ A wearable tactile sensory aid for profoundly deaf children
- ↑ Spectrogram Reading
- ↑ Praat - doing phonetics by computer
- ↑ Several sound spectrogram examples, including the one by Aphex Twin
- ↑ Example of using spectrograms to check filter responses
- ↑ High definition spectrograms of common RF signals
- ↑ Spectrograms for vector network analyzers
- ↑ Real-time spectrogram displays from seismic stations
External links
| Wikimedia Commons has media related to Spectrogram. |
| Look up spectrogram in Wiktionary, the free dictionary. |
- See an online spectrogram of speech or other sounds captured by your computer's microphone.
- Generating a tone sequence whose spectrogram matches an arbitrary text, online
- Further information on creating a signal whose spectrogram is an arbitrary image
- Article describing the development of a software spectrogram
- History of spectrograms & development of instrumentation
- How to identify the words in a spectrogram from a linguistic professor's Monthly Mystery Spectrogram publication.