Solar maximum

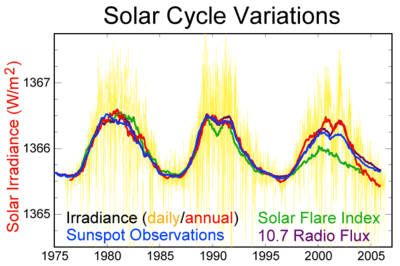
Solar maximum or solar max is a normal period of greatest solar activity in the 11 year solar cycle of the Sun. During solar maximum, large numbers of sunspots appear and the sun's irradiance output grows by about 0.07%.[1] The increased energy output of solar maxima can impact Earth's global climate and recent studies have shown some correlation with regional weather patterns.
At solar maximum, the Sun's magnetic field lines are the most distorted due to the magnetic field on the solar equator rotating at a slightly faster pace than at the solar poles. The solar cycle takes an average of about 11 years to go from one solar maximum to the next, with duration observed varying from 9 to 14 years.
Large solar flares often occur during a maximum. For example, the solar storm of 1859 struck the Earth with such intensity that the northern lights were visible as far from the poles as Cuba and Hawaii.[2]
Predictions
Predictions of a future maximum's timing and strength are very difficult; predictions vary widely. There was a solar maximum in 2000. In 2006 NASA initially expected a solar maximum in 2010 or 2011, and thought that it could be the strongest since 1958.[3] However, the solar maximum was not declared to have occurred until 2014, and even then was ranked among the weakest on record.[4]
Film
IMAX documentary about solar maximum called Solarmax.[5]
NASA CME documentary X class Corona Mass Ejection 2012-07-14 documentary
Grand solar minima and maxima
Grand solar maxima occur when several solar cycles exhibit greater than average activity for decades or centuries. Solar cycles still occur during these grand solar maximum periods but the intensity of those cycles are greater. Grand solar maxima have shown some correlation with global and regional climate changes.
| Event | Start | End |
|---|---|---|
| Homeric minimum [6] | 950BC | 800BC |
| Oort minimum (see Medieval Warm Period) | 1040 | 1080 |
| Medieval maximum (see Medieval Warm Period) | 1100 | 1250 |
| Wolf minimum | 1280 | 1350 |
| Spörer Minimum | 1450 | 1550 |
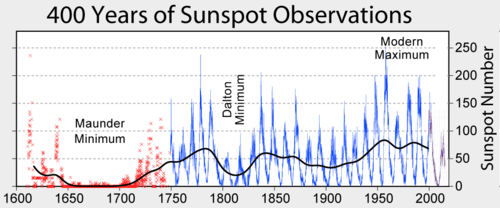
| Maunder Minimum | 1645 | 1715 |
| Dalton Minimum | 1790 | 1820 |
| Modern Maximum | 1900 | present |
The idea of a Modern Maximum has now been thrown into question with the release of a paper at the International Astronomical Union General Assembly in August 2015.[7]
A list of historical Grand minima of solar activity[8] includes also Grand minima ca. 690 AD, 360 BC, 770 BC, 1390 BC, 2860 BC, 3340 BC, 3500 BC, 3630 BC, 3940 BC, 4230 BC, 4330 BC, 5260 BC, 5460 BC, 5620 BC, 5710 BC, 5990 BC, 6220 BC, 6400 BC, 7040 BC, 7310 BC, 7520 BC, 8220 BC, 9170 BC.
See also
- Solar wind
- Solar variation
- Solar minimum
- List of solar cycles – table of solar cycles
- Solar Maximum Mission
References
- ↑ C. D. Camp & K. K. Tung (2007). "Surface warming by the solar cycle as revealed by the composite mean difference projection" (PDF). Geophysical Research Letters. 34: L14703. Bibcode:2007GeoRL..3414703C. doi:10.1029/2007GL030207. Retrieved 20 January 2012.
- ↑ "Monster radiation burst from Sun". BBC News. 14 May 2013. Retrieved 2015-01-06.
- ↑ "Solar Storm Warning", Science@NASA, 10 March 2006, Accessed 26 Mar. 2010
- ↑ "Solar Mini-Max". NASA. Retrieved 2014-12-24.
- ↑ "Solarmax (2000)". IMDB. Seattle, WA, USA: Amazon.com, Inc. Retrieved August 6, 2012.
- ↑ Celia Martin-Puertas; Katja Matthes; Achim Brauer; Raimund Muscheler; et al. (April 2, 2012). "Regional atmospheric circulation shifts induced by a grand solar minimum". Nature Geoscience. 5 (6): 397–401. Bibcode:2012NatGe...5..397M. doi:10.1038/ngeo1460.
- ↑ "Corrected Sunspot History Suggests Climate Change since the Industrial Revolution not due to Natural Solar Trends". Press release. IAU. 7 Aug 2015. 1508.
- ↑ Usoskin, Ilya G.; Solanki, Sami K.; Kovaltsov, Gennady A. (2007). "Grand minima and maxima of solar activity: new observational constraints" (PDF). Astron. Astrophys. 471 (1): 301–9. arXiv:0706.0385
 . Bibcode:2007A&A...471..301U. doi:10.1051/0004-6361:20077704.
| Internal structure |  | ||||||||||
|---|---|---|---|---|---|---|---|---|---|---|---|
| Atmosphere | |||||||||||
| Variation | |||||||||||
| Heliosphere | |||||||||||
| Related topics | |||||||||||