Solar cycle 24
| Solar cycle 24 | |
|---|---|
 ISES Solar Cycle 24 Sunspot Number Progression | |
| Sunspot Data | |
| Start date | January 4, 2008 |
| Cycle chronology | |
| Previous cycle | Solar cycle 23 (1996-2008) |

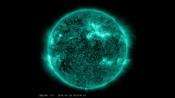
Solar Cycle 24 is the 24th solar cycle since 1755, when extensive recording of solar sunspot activity began.[1][2] It is the current solar cycle which began on January 4, 2008, but there was minimal activity until early 2010.[3][4] It is proving to be the least active sunspot cycle in over a century.[5]
Predictions
Prior to the minima between the end of Solar Cycle 23 and the beginning of Solar Cycle 24, there were essentially two competing theories about how strong Solar Cycle 24 would be. The two camps could be distinguished by those postulating the Sun retained a long memory (Solar Cycle 24 would be active) or whether it had a short memory (Solar Cycle 24 would be quiet). Prior to 2006, the difference was very drastic with a minority set of researchers predicting "the smallest solar cycle in 100 years."[6] Another group of researchers, including one at NASA, were predicting that it "looks like its going to be one of the most intense cycles since record-keeping began almost 400 years ago."[7]
The delayed onset of high latitude spots indicating the start of Solar Cycle 24 led the "active cycle" researchers to revise their predictions downward and the consensus by 2007 was split 5-4 in favor of a smaller cycle.[8] By 2012, consensus was a small cycle, as solar cycles are much more predictable 3 years after minima.
In May 2009 the NOAA/Space Weather Prediction Center's Solar Cycle 24 Prediction Panel predicted the cycle to peak at 90 sunspots in May 2013.[9] In May 2012 NASA's expert David Hathaway predicted that current solar cycle would peak by the Spring of 2013 with about 60 sunspots.[10]
NASA also directly funded and used Ken Schatten's physics-based models,[11] which utilized a solar Dynamo model to accurately predict the low sunspot count in cycle 24. This method has used the correlation between solar magnetic field strength at solar minimum to sun spot number at solar maximum to accurately predict the peak solar flux of each of the last three solar cycles. Careful comparison of Schatten's predictions with those of Hathaway will demonstrate the superiority of Schatten's predictions: they are accurate as soon as solar minima 5–6 years before solar max.
Results
In early 2013, after several months of calm, it was obvious that the active 2011 was not a prelude to a widely predicted late 2012-early 2013 peak in solar flares, sunspots and other activity. This unexpected stage prompted some scientists to propose a "double-peaked" solar maximum, which then occurred. The first peak reached 99 in 2011 and the second peak came in early 2014 at 101.[12]
Speculation

According to NASA, the intensity of geomagnetic storms during Solar Cycle 24 may be elevated in some areas where the Earth's magnetic field is weaker than expected. This fact was discovered by the THEMIS spacecraft in 2008.[13][14] A 20-fold increase in particle counts that penetrate the Earth's magnetic field may be expected.[15] Solar Cycle 24 has been the subject of various hypotheses and commentary pertaining to its potential effects on Earth.
While acknowledging that the next solar maximum will not necessarily produce unusual geomagnetic activity, astrophysicist Michio Kaku has taken advantage of the media focus on the 2012 phenomenon to draw attention to the need to develop strategies for coping with the terrestrial damage that such an event could inflict. He asserts that governments should ensure the integrity of electrical infrastructures, so as to prevent a recurrence of disruption akin to that caused by the solar storm of 1859.[16]
The current solar cycle is currently the subject of research, as it is not generating sunspots in the manner which would be expected. Sunspots did not begin to appear immediately after the last minimum (in 2008) and although they started to reappear in late 2009, they were at significantly lower rates than anticipated.[17]
On April 19, 2012, the National Astronomical Observatory of Japan predicted that the Sun's magnetic field will assume a quadrupole configuration in Solar Cycle 24.[18]
Throughout 2012, NASA posted several news releases discrediting the 2012 phenomenon and the so-called Mayan prophecy, and unlinking them with solar activity and space weather.[19][20]
Events
| Class | Year | Date | Sunspot region | Radio B. | SR Storm | CME | GM Storm | ||
|---|---|---|---|---|---|---|---|---|---|
| X6.9 | 2011 | Aug 9 | 1263 | R3 | S1 | Yes | - | ||
| X5.4 | 2012 | Mar 7 | 1429 | R3 | S3 | Yes | G3 | ||
| X4.9 | 2014 | Feb 25 | 1990 | R3 | S1 | Yes | G2 | ||
| X3.3 | 2013 | Nov 5 | 1890 | R3 | - | Yes | - | ||
| X3.2 | 2013 | May 14 | 1748 | R3 | - | Yes | - | ||
| X3.1 | 2014 | October 24 | 2192 | R3 | - | No | - | ||
| X2.8 | 2013 | May 13 | 1748 | R3 | - | Yes | - | ||
| X2.7 | 2015 | May 5 | 2339 | R3 | - | Yes | - | ||
| X2.3 | 2013 | Oct 29 | 1875 | R3 | - | Yes | - | ||
| X2.2 | 2015 | Mar 11 | 2297 | R3 | - | Yes | - | ||
| X2.2 | 2011 | Feb 15 | 1158 | R3 | - | Yes | G1 | ||
| X2.1 | 2013 | Oct 25 | 1882 | R3 | - | Yes | - | ||
| X2.1 | 2011 | Sep 6 | 1283 | R3 | S1 | Yes | G3 | ||
| X1.9 | 2011 | Nov 3 | 1339 | R3 | - | Yes | - | ||
| X1.9 | 2011 | Sep 24 | 1302 | R3 | S1 | Yes | G4 | ||
| X1.8 | 2011 | Sep 7 | 1283 | R3 | S1 | Yes | G1 | ||
| X1.8 | 2012 | Oct 23 | 1598 | R3 | - | No | - | ||
| X1.7 | 2013 | Oct 25 | 1882 | R3 | - | Yes | - | ||
| X1.7 | 2012 | Jan 27 | 1402 | R3 | S2 | Yes | - | ||
| X1.7 | 2013 | May 13 | 1748 | R3 | - | Yes | - | ||
| X1.6 | 2014 | Sep 10 | 2158 | R3 | S2 | Yes | G3 | ||
| X1.5 | 2011 | Mar 9 | 1166 | R3 | - | Yes | G2 | ||
| X1.4 | 2011 | Sep 22 | 1302 | R3 | - | Yes | - | ||
| X1.4 | 2012 | Jul 12 | 1520 | R3 | S1 | Yes | G2 | ||
| X1.3 | 2012 | Mar 7 | 1430 | R3 | S3 | No | - | ||
| X1.2 | 2014 | Jan 7 | 1944 | R3 | S2 | Yes | - | ||
| X1.2 | 2013 | May 15 | 1748 | R3 | S1 | Yes | G1 | ||
| X1.1 | 2013 | Nov 10 | 1890 | R3 | - | Yes | - | ||
| X1.1 | 2013 | Nov 8 | 1890 | R3 | - | Yes | - | ||
| X1.1 | 2012 | Mar 5 | 1429 | R3 | - | Yes | G2 | ||
| X1.1 | 2012 | Jul 6 | 1515 | R3 | S1 | Yes | G1 | ||
| X1.0 | 2013 | Nov 19 | 1893 | R3 | S1 | Yes | - | ||
| X1.0 | 2013 | Oct 28 | 1875 | R3 | S1 | Yes | - | ||
| M9.9 | 2014 | Jan 1 | 1936 | R2 | - | Yes | - | ||
| M9.3 | 2013 | Oct 24 | 1877 | R2 | - | Yes | - | ||
| M9.3 | 2011 | Aug 4 | 1261 | R2 | S1 | Yes | G4 | ||
| M9.3 | 2011 | Jul 30 | 1260 | R2 | - | No | - | ||
| M9.2 | 2015 | Mar 7 | 2339 | R2 | - | Yes | - | ||
| M9.0 | 2012 | Oct 20 | 1598 | R2 | - | Yes | - | ||
| M8.7 | 2012 | Jan 23 | 1402 | R2 | S3 | Yes | G1 | ||
| M8.4 | 2012 | Mar 10 | 1429 | R2 | - | Yes | - | ||
| M8.3 | 2010 | Feb 12 | 1046 | R2 | - | Yes | - | ||
| M7.9 | 2012 | Mar 13 | 1429 | R2 | S2 | Yes | G2 | ||
| M7.7 | 2012 | Jul 19 | 1520 | R2 | - | Yes | - | ||
| M7.4 | 2011 | Sep 25 | 1302 | R2 | - | Yes | G1 | ||
| M7.2 | 2014 | Jan 7 | 1944 | R2 | - | No | - | ||
| M7.1 | 2011 | Sep 24 | 1302 | R2 | - | Yes | G4 | ||
| M6.9 | 2012 | Jul 8 | 1515 | R2 | S1 | Yes | - | ||
| M6.7 | 2016 | Apr 18 | 2529 | R2 | - | Yes | - | ||
| M6.7 | 2011 | Sep 8 | 1283 | R2 | - | Yes | G1 | ||
| M6.6 | 2014 | Jan 30 | 1967 | R2 | - | Yes | - | ||
| M6.6 | 2011 | Feb 13 | 1158 | R2 | - | Yes | - | ||
| M6.6 | 2011 | Feb 18 | 1158 | R2 | - | No | - | ||
| M6.5 | 2013 | Apr 11 | 1719 | R2 | S2 | Yes | - | ||
| M6.4 | 2010 | Feb 7 | 1045 | R2 | - | Yes | - | ||
| M6.4 | 2013 | Dec 31 | 1936 | R2 | - | Yes | - | ||
| M6.3 | 2013 | Nov 1 | 1884 | R2 | - | Yes | - | ||
| M6.3 | 2012 | Mar 9 | 1429 | R2 | - | Yes | G2 | ||
| M6.1 | 2012 | Jul 5 | 1515 | R2 | - | No | - | ||
| M6.1 | 2012 | Jul 28 | 1532 | R2 | - | Yes | - | ||
| M6.0 | 2012 | Nov 13 | 1613 | R2 | - | Yes | - | ||
| M6.0 | 2011 | Aug 3 | 1261 | R2 | - | Yes | G4 | ||
| M5.9 | 2013 | Jun 7 | 1762 | R2 | - | Yes | - | ||
| M5.8 | 2011 | Sep 24 | 1302 | R2 | - | ? | - | ||
| M5.7 | 2012 | May 10 | 1476 | R2 | - | Yes | - | ||
| M5.7 | 2013 | May 3 | 1739 | R2 | - | Yes | - | ||
| M5.6 | 2012 | Jul 2 | 1515 | R2 | - | Yes | - | ||
| M5.5 | 2012 | Aug 18 | 1548 | R2 | - | No | - | ||
| M5.4 | 2010 | Nov 6 | 1121 | R2 | - | ? | - | ||
| M5.3 | 2011 | Sep 6 | 1283 | R2 | - | Yes | G3 | ||
| M5.3 | 2011 | Mar 8 | 1165 | R2 | - | Yes | G1 | ||
| M5.3 | 2012 | Jul 4 | 1515 | R2 | - | Yes | - | ||
| M5.1 | 2012 | May 17 | 1476 | R2 | S2 | Yes | - | ||
| M5.1 | 2013 | Oct 28 | 1875 | R2 | - | Yes | - | ||
| Source: Solarham.com[21] and NOAA's SWPC.[22] The CME field indicates whether the solar flare hurled a CME (oriented or not to Earth). The Radio B./SR Storm/GM Storm fields indicate the NOAA scales of radio blackouts/solar radiation storms/geomagnetic storms, being G1 (minor), G2 (moderate), G3 (strong), G4 (severe) and G5 (extreme). | |||||||||
2008
On January 4, 2008, a reversed-polarity sunspot appeared, and this signaled the start of Solar Cycle 24. It was high latitude (30° N) and magnetically reversed. NOAA named the spot AR10981, or sunspot 981 for short.[3]
Sunspot 1007 produced the first solar flare above the B-class on November 2, 2008.
Sunspot 1009 produced the first solar flare above the C-class, a C1.4, on December 11, 2008.
Only a few sunspots were observed in the surface of the Sun throughout 2008.
2009
Solar activity remained extremely low throughout 2009. Only in December the observed monthly sunspots exceeded number 10.
2010
January
Sunspot 1041 produced the first solar flare above the M-class, a M2.3 (followed by a M1.7 one just seven hours after and by four consecutive M flares, the strongest reaching M3.4, the next day) on January 19, 2010.
February
Sunspot 1046 produced a M8.3-class flare on February 12, 2010. 9 M-class flares were unleashed by active regions 1045 and 1046 this month.
April
On April 5, 2010 the first CME of Solar Cycle 24 produced by a sunspot (but unrelated to flares; in fact, a single C-class X-ray flux event was registered this month) and causing a true geomagnetic storm was registered. Kp index, which quantifies disturbances in the horizontal component of Earth's magnetic field, was 7 by then, so the geomagnetic storm reached a G3 (strong level) in NOAA G-scale.
August
Multiple coronal mass ejections
On August 1–2, 2010, scientists at the Harvard-Smithsonian Center for Astrophysics (CfA) observed a series of four large Coronal mass ejections (CME) emanating from the Earth-facing hemisphere by analyzing images recorded at NASA's Solar Dynamics Observatory. They were expected to reach the Earth's geomagnetic field sometime between August 4 and early August 5. As of 05:00 UTC August 4, the estimated time of arrival of the series was as follows:
 Video captured by NASA's Solar Dynamics Observatory of the initial ejection taken August 1, 2010.
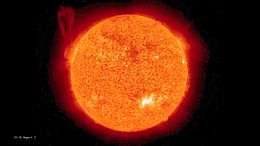 The coronal mass ejection starts at 2:36 UTC and ends at 3:56 UTC on August 1, 2010 in this animation on STEREO Ahead images.
All four ejections were described as large and, according to scientists, possessed enough energy to cause aurorae to be observed by naked eye in non-polar regions.[24] According to reports, aurorae would be visible at night toward the poleward horizon in temperate latitudes between 45° to 50°, and near overhead in regions closer to the poles.[25] The initial coronal mass ejection of August 1 originated from a sunspot designated Sunspot 1092, which was large enough to be seen without the aid of a solar telescope.[26] Aside from the visual effects of this CME series, scientists warned that electric impulses caused by disruptions in the magnetic field due to the ionized particles may damage infrastructure such as power grids and telephone lines not adequately protected against induced magnetic current. It has also been reported that several Earth-orbiting satellites may be in similar danger.[24] According to Leon Golub, an astronomer at CfA:
This eruption is directed right at us and is expected to get here early in the day on August 4. It's the first major Earth-directed eruption in quite some time. When such an expulsion reaches Earth, it interacts with the planet's magnetic field and can create a geomagnetic storm. Solar particles stream down the field lines toward Earth's poles. Those particles crash with atoms of nitrogen and oxygen in the atmosphere, which then glow like little neon signs. Sky watchers in the northern U.S. and other countries should look toward the north late Tuesday or early Wednesday for rippling "curtains" of green and red light.[27]
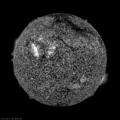
 Solar northern hemisphere during the first eruption as seen in extreme ultraviolet by the Solar Dynamics Observatory.
 SDO multi-wavelength image of the August 1, 2010 event.
Solar flare
According to the Solar Dynamics Observatory, these CMEs were probably connected to a C3.2-class solar flare that peaked on August 1 at 08:26 UT. The origin of this blast was sunspot 1092. Connection between both events was established despite the ~400,000 km distance between them.[28]
Aurorae observations
In the early morning hours of August 4, 2010 aurorae occurred in the northern hemisphere that were visible at latitudes as far south as Michigan and Wisconsin in the United States, and Ontario, Canada near latitude 45° North. European observers reported sightings as far south as Denmark near latitude 56° North. The aurorae were reportedly green in color due to the interaction of the solar particles with oxygen atoms in the relatively denser atmosphere of southern latitudes.[29] This, however, was only the first wave of solar wind; the third and last was expected for the evening of August 5,[30] but missed Earth entirely. Geomagnetic storm reached a G2 (moderate) level in NOAA scale.
Solar radiation storm
Unrelated to the multiple coronal mass ejections, some days after, on August 14, a C4.4-class flare produced the first solar radiation storm of Solar Cycle 24. The proton storm event was minor, S1 level, and was easily absorbed by the ionosphere.
November
Active region 1121 emitted a M5.4 flare on November 6.[31]
December
The year 2010 ended up with 21 M-class solar flares.
2011
February
'Valentine’s Day' 2011 flare
Peaked at 01:56 UT on February 15, 2011 sunspot group 1158 produced an X2.2-class solar flare. Dubbed the Valentine's Day solar event by the scientific community, it was the first Solar Cycle 24 flare reaching X class level. In fact, it was the first of its class since December 2006. NOAA issued a R3 (strong) radio blackout alert pertaining this prominent x-ray flux event. In addition to flashing Earth with X and UV radiation, the explosion also hurled a CME in Earth's direction. The magnetosphere was impacted on February 18. The CME struck a minor G1-level geomagnetic storm.[32][33]
Shortly before, on February 13, sunspot 1158 had unleashed an M6.6-class solar flare. On February 18, the same active region produced another x-ray burst with identical class, M6.6.[34] 13 M-class bursts were registered in February 2011.
March
A CME exploded from the vicinity of sunspot 1164 during the late hours of March 7, 2011. It leapt away from the Sun traveling ~2200 km/s, making it the fastest CME since September 2005.
On March 9, active region 1166 erupted in an X1.5 flare. A R3-level radio blackout was reported. The related CME caused a G2 geomagnetic storm two days later.[35] 21 M-class flares were registered this month.
July
Sunspot 1260 produced an M9.3-class solar flare on July 30, 2011. Because of its brevity, the eruption did not hurl a substantial cloud of ionized material or coronal mass ejection (CME) toward Earth, so it was not geoeffective.[36]
August
On August 5, 2011, the combined cloud of three consecutive CMEs produced brilliant auroras, reported as far south as Oklahoma and Alabama. The geomagnetic storm reached a G4 (severe) level, enough to make power outages. It was one of the strongest geomagnetic storms in years. In the southern hemisphere, auroras could have been seen as far north as South Africa, Southern Chile and Southern Australia. The CMEs were hurled by three M-class flares erupted in active sunspot 1261: M1.4 on August 2, M6.0 on August 3 and M9.3 on August 4.[37][38][39]
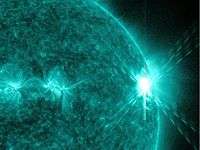
X6.9-class flare
On August 9 at 0805 UT, sunspot 1263 produced a massive X6.9-class solar flare, the third X-flare of Solar Cycle 24 and the most powerful so far (as of May 2013). There was also a CME associated with this burst. Although the flare was not Earth-directed, radiation created waves of ionization in Earth's upper atmosphere, briefly disrupting communications at some VLF and HF radio frequencies. A R3-level (strong) radio blackout alert was issued. A proton event greater than 10 MeV (=million electron volts) ions and exceeding 10 pfu (=proton flux units) was also reported, so a S1-level solar radiation storm was also issued.[40]
September
Sunspot 1283 erupted with an M5.3-class solar flare on September 6 at 01:50 UT. A R2 (moderate) blackout radio alert was issued. The burst was Earth-directed. Just 21 hours later, an X2.1-class flare – some four times stronger than the earlier flare – erupted from the same sunspot region. NOAA detected a R3 (strong) radio blackout and a S1 (minor) solar radiation storm. The combined CMEs of these bursts arrived the Earth on September 9, provoking a G3 (strong) geomagnetic storm.
The next day, September 7, an X1.8-class solar flare erupted from sunspot 1283, producing a S1 solar radiation storm. A fourth flare, an M6-class, was ejected by the same sunspot on September 8.[41][42][43]
This sequence of flares produced waves of ionization in Earth's upper atmosphere, briefly altering the propagation of low-frequency radio signals around our planet. Moreover, the eruptions hurled clouds of plasma in our direction. CME impacts, strong geomagnetic storms and auroras were registered from September 9 onwards.
Then, on September 22, an X1.4-class solar flare erupted out of sunspot 1302. A R3-level radio blackout was registered. The blast produced a significant CME, but was not Earth directed. Two days later, an X1.9-class flare followed in the next 31 hours by a spectacular string of 14 M-class flares, being the biggest two M7 flares, were mostly unleashed out of the same sunspot. The first two explosions, X1.9 and M7.1, propelled a pair of closely spaced CMEs. A G4 (severe) geomagnetic storm was reported on September 26.[44][45]
In total, the Sun produced four X flares and 31 M flares in September 2011, one of the most active months of Solar Cycle 24 so far.
October
The Sun unleashed eight M-class flares this month, being the strongest the M3.9 event, followed by an Earth-directed CME, produced by sunspot 1305 on October 2. Just in the eve, sunspots 1302 and 1305 had emitted flares almost at the same time; the first event was a C-class and the second one reached a M1.2 category. This double eruption, which hurled a double CME as well, were particularly interesting as coincided with the arrival of a comet, discovered by amateur astronomers the previous day, that disintegrated in spectacular fashion when it plunged into the Sun. A very similar scenario happened on May 10–11, 2011.[46]
November
On November 3, 2011, active region 1339, one of the largest sunspots in years -40,000 km wide and at least twice that in length-, unleashed an X1.9-class solar flare. Waves of ionization in the upper atmosphere created a R3 (strong) radio blackout. The related CME was not headed for Earth.[47] 13 bursts of M category were registered this month. November 2011 may be considered the most active month of the current Cycle 24 so far, as monthly sunspot count was nearly 100 (96.7) and the same went for the F 10.7 Solar Flux (the radio emission from the Sun at a wavelength of 10.7 cm), that racked up a value of 153.1. However, these numbers are well below those of Cycle 23 at its peak. Cycle 23 peak sunspot count was 170 and its F10.7 was about 235.[48]
December
Solar activity increased again in late-December, with the Sun unleashing eight M-flares. The most intense flare, produced by sunspot 1385, was an M4.0 event on December 25.[49] The year 2011 ended up with 111 M-class and 8 X-class solar flares.[50]
2012
January
Active sunspot 1401 erupted an M3.2-class solar flare and a full-halo CME on January 19, 2012. The CME hit the Earth's magnetic field in early hours of January 22, with minor geomagnetic disturbances reported.[51]
Sunspot 1402 erupted a long-duration M8.7-class flare, followed by a CME, on January 23, 2012 at 03:59 UTC. According to NOAA, the flare's radiation storm was ranked as S3 (strong level), the strongest since May 2005.[52] The very fast-moving CME arrived at the Earth on January 24 at approximately 15:00 UTC. Geomagnetic storm reached a G1 level (minor), the same level recorded by the previous M3-class flare.[53]

On January 27, at 18:37 UT, sunspot region 1402 unleashed a X1.7-class flare, prompting NOAA's Space Weather Prediction Center to issue a R3 (strong) Radio Blackout warning and a S2 (moderate) Solar Radiation Storm warning. Sunspot 1402 was rotating onto the far side of the Sun, so the blast site was not facing Earth. The explosion also produced a huge CME, but not Earth-oriented, so no geomagnetic storm was expected.[54][55]
March
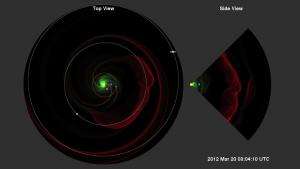
Following several minor C-class flares, M-class flares and CMEs registered in previous weeks and days, active region 1429 erupted an X1.1-class flare on March 5 at 0413 GMT. The wave of high energy electromagnetic rays, reaching Earth in minutes, caused an R3 (strong) radio blackout over China, India and Australia, according to NOAA. Sunspot region 1429, whose size was the half of that of Jupiter and was rotating toward Earth, was being particularly active since it materialized on March 2. The CME -the wave of plasma- that followed arrived at the Earth on March 7 and caused a G2 (moderate) geomagnetic storm. Just hours after ejecting the X1.1-class flare, AR1429 produced several minor C and M-class flares in chain.[56][57]
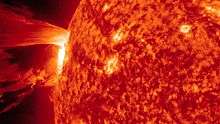
X5.4-class flare
After releasing up to nine M-class flares in only one day, the active region 1429 erupted a powerful X5.4-class flare at 00:24 UTC the March 7. The related CME impacted the Earth on March 8, causing a G3 (strong) geomagnetic storm. This event marked the second strongest solar flare of Cycle 24 in terms of X-ray flux. NOAA launched a R3 (strong) radio blackout and a S3 (strong) solar radiation storm alerts.[58] Just one hour after that first flare, nearby sunspot 1430 released a less powerful X1.3-class one. No coronal mass ejection (CME) associated to this event was reported.[59] Months later, in June, NASA reported that its Fermi Gamma-ray Space Telescope detected in this powerful flare the highest flux of gamma rays—greater than 100 MeV—ever associated with an eruption on the Sun.[60]
AR1429, rotating toward the other side of the Sun, still generated a M6.3-class flare on March 9, a M8.5 flare one day later and a M7.9 flare on March 13. These eruptions hurled CMEs, all Earth-oriented. The first wave of plasma impacted the magnetosphere on March 12, causing a G2 (moderate) geomagnetic storm. The second CME was not geoeffective. The third wave of ionized gas reached our planet on March 15, causing another G2 storm.
In late March, the US Air Force Space Command reported that the solar storms of March 7–10 could have temporarily knocked American military satellites offline.[61] NASA also reported that these powerful flares heated the Earth's upper atmosphere with the biggest dose of infrared radiation since 2005. From March 8 to March 10, the thermosphere absorbed 26 billion kWh of energy. Infrared radiation from carbon dioxide and nitric oxide, the two most efficient coolants in the thermosphere, re-radiated 95% of that total back into space.[62]
March 2012, one of the most active months of Solar Cycle 24, ended up with 19 M-class and three X-class flares.
April
A prominence eruption producing a CME shot off the east limb (left side) of the Sun on April 16, 2012.[63] Such eruptions are often associated with solar flares, and in this case an M1.7 class (medium-sized) flare occurred at the same time, peaking at 1:45 PM EDT and 17.45 UTC.[63] The CME was not aimed toward Earth.[63] Nevertheless, this month was very quiet in comparison to the previous one, as only two M-class flares were recorded.
May
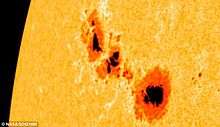
Solar activity increased again this month, with 12 M-class flares ejected, being the strongest the M5.7 flare produced by active region 1476 on May 10. This so-called "monster" sunspot complex, the largest active region of the cycle to the date, was about the size of Jupiter, or eleven times the diameter of Earth.[64]
June
11 M-class solar flares were observed this month, being the largest a M3.3 flare.
July
An X1.1-class flare erupted from sunspot 1515 on July 6, generating a R3 (strong) radio blackout and a S1 (minor) solar storm; its related CME caused a G1 (minor) geomagnetic storm. Six days after, sunspot 1520, the largest active region of Solar Cycle 24 to the moment, unleashed an X1.4-class flare, peaking at 12:52 PM EDT. This huge group of sunspots, which rotated into view on July 6, was located in the center of the Sun at the time of this event. The related CME caused a G2 (moderate) geomagnetic storm, following a R3 radio blackout and a S1 solar storm.[65]


The Sun emitted a moderate solar flare on July 19, 2012, beginning at 1:13 AM EDT and peaking at 1:58 AM. The flare was classified as an M7.7 flare. It was emitted from sunspot 1520 too.[66] Other M-class flares registered this month was a M6.9 (July 8, sunspot 1515), a M6.1 (July 5, sunspot 1515), a M6.1 (July 28, sunspot 1532), M5.6 (July 2, sunspot 1515) and a M5.3 (July 4, sunspot 1515). The month ended up with 45 M-class flare and 2 X-class flare, which is the highest record of this kind of events within the current solar cycle to the moment. Nevertheless, July 2012 was not the most active month in solar radio flux (the radio emission from the Sun at a wavelength of 10.7 cm) and number of sunspots.
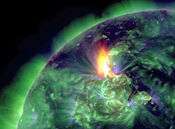
Solar storm of 2012
August
On August 31, 2012 a long filament of solar material that had been hovering in the Sun's atmosphere (the corona), erupted out into space at 4:36 p.m. EDT.[67] The coronal mass ejection, or CME, traveled at over 900 miles per second. The CME did not travel directly toward Earth, but did connect with Earth's magnetic environment, or magnetosphere, with a glancing blow. causing aurorae to appear on the night of Monday, September 3.[67] A G2 (moderate) geomagnetic storm was registered on September 3 and September 5.[68] The Sun erupted 10 M-class flares this month, the largest being a M5.5 burst ejected on August 18.
September
A filament eruption occurred in late hours of September 27 resulted in a brief S1 (minor) radiation storm, alerted by NOAA in early hours of next day. The Earth-directed CME associated with this event affected our planet on September 30. Geomagnetic storm levels reached the G3 on October 1. The filament eruption was connected to a C3.7 flare occurred in the vicinity of sunspot 1577.[69] Solar activity decreased remarkably this month. 4 minor solar flares, below M2 levels, were registered in September 2012.

October
On October 8 and 9, the arrival of a CME unrelated to solar flares and emitted on October 5 caused disturbances in the horizontal component of the Earth's magnetic field. The planetary Kp-index reached level 6, so a G2 (moderate) geomagnetic storm was reported.[70] The Sun released a M9.0 flare on October 20. This was followed three days after on October 23, by a very impulsive flare, peaking as an X1.8 class event at 3:17 a.m. UTC.[71][72] Both flares came from active region 1598 located on the left side (east) of the sun, which had previously been the source of a number of weaker flares. The M9.0 burst occurred when the sunspot was not yet rotated onto the Earth-facing side of the solar disk.[71] The NOAA categorized the radio blackout associated with the X1.8 event as an R3, on a scale from R1 to R5.[71] This was the 7th and last X-class flare in 2012.[71] There was no associated Earth-directed coronal mass ejection (CME).[71]
November
14 M-class flares were registered this month, being the strongest a M6.0 flare erupted on November 13 by AR1613.[73]
December
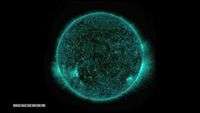
Solar activity decreased significantly this month. For first time in two years (since December 2010), no X or M-class flares were emitted by the Sun's Earth-facing side (the strongest flare was merely a C4.1). The observed sunspots were 40.8 and the 10.7 cm radio flux values (sfu) were 108.4, the lowest in ten months.[74]
The year 2012 ended up with 129 M-class and 7 X-class solar flares.[50]
2013
April

.gif)
The unexpectedly low solar activity continued in April 2013, although showing a tendence to increase. Only 13 M-class flares were reported since December 2012 to April 2013, being the strongest a M6.5 unleashed by active region 1719 the 11th day of this month. This event generated a R2 radio blackout and a R2 radiation storm. The observed sunspots this month were 72.4 and the 10.7 cm radio flux values (sfu) marked 125.0.[74][75]
May
String of X-class flares
Solar activity increased rapidly in mid-May 2013 with four consecutive strong flares in two days. These powerful bursts all surged from the just-numbered sunspot AR1748, located in the eastern limb of Sun and barely rotating around the front of the solar disk. AR1748 emitted the first flare, an X1.7-class, on May 13, peaking at 02:17 UTC. This event was quickly followed the same day at 16:09 UTC by a X2.8-class flare. On May 14 at 01:17 UTC the same sunspot emitted a X3.2-class flare, the third strongest of current solar cycle so far. This was followed by an X1.2-class flare at 01:52 UTC on May 15. The four X-ray bursts generated a R3 (strong) radio blackout in upper atmosphere.
Every X-rays event was followed by a massive coronal mass ejection (CME). The first three CMEs were not geoeffective at all as they were not directed toward Earth; the fourth CME was partially geoeffective, so a G1 (minor) geomagnetic storm was expected to occur on May 18. A S1 (minor) proton storm event was also detected in connection with the May 15 X1.2 flare.[76]
2014
February
On February 24, 2014 the sun erupted with a X4.9-class solar flare, the strongest of that year.[77]
October
Four solar flares occurred within 5 days from sunspot AR 12192, which is both the largest sunspot of solar cycle 24 and the largest since 1990. On October 19 there was a major X1.1-class solar flare. October 22 an M8.7-class flare was followed the same day by an X1.6 event. The October 24 X3.1-class solar flare was strong enough to trigger a radio blackout. Larger than the planet Jupiter, the AR 12192 sunspot was visible during a partial solar eclipse seen in North America.[77]
2015
June

The sun emitted a mid-level solar flare, an M7.9-class, peaking at 4:16 a.m. EDT on June 25, 2015.[78]
November
In early November 2015, solar flares disrupted the air traffic control system in central and southern Sweden, causing heavy delays for passengers.[79]
2016
June
As of June 29 there had been 10 days during 2016 on which there were no sunspots.[80]
July
As of July 31 there had been 18 days during 2016 on which there were no sunspots.[81]
August
As of August 31 there had been 20 days during 2016 on which there were no sunspots.[82]
See also
References
- ↑ Kane, R.P. (2002). "Some Implications Using the Group Sunspot Number Reconstruction". Solar Physics 205(2), 383-401.
- ↑ "The Sun: Did You Say the Sun Has Spots?". Space Today Online. Retrieved 12 August 2010.
- 1 2 Dr. Tony Phillips (2008-01-10). "Solar Cycle 24 Begins". NASA. Retrieved 2010-05-29.
- ↑ Dr. Tony Phillips (2010-06-04). "As the Sun Awakens, NASA Keeps a Wary Eye on Space Weather". NASA. Retrieved 2013-05-18.
- ↑ Dr. David H. Hathaway, Solar Cycle Prediction
- ↑ Svalgaard, Leif. "Sunspot cycle 24: Smallest cycle in 100 years?" (PDF). GEOPHYSICAL RESEARCH LETTERS, VOL. 32, L01104, doi:10.1029/2004GL021664, 2005.
- ↑ Hathaway, David (December 21, 2006). "Scientists Predict Big Solar Cycle". NASA.
- ↑ "Consensus Statement of the Solar Cycle 24 Prediction Panel". NOAA. Archived from the original on January 30, 2012.
- ↑ "Solar Cycle Progression". NOAA. 8 May 2009.
- ↑ "Climate Change Sanity". 9 January 2013.
- ↑ "Fair space weather for solar cycle 24" (PDF). GEOPHYSICAL RESEARCH LETTERS, VOL. 32, L21106, doi:10.1029/2005GL024363. 2005.
- ↑ "Solar Cycle Progression | NOAA / NWS Space Weather Prediction Center". www.swpc.noaa.gov. Retrieved 2015-07-06.
- ↑ "Giant Breach in Earth's Magnetic Field Discovered". NASA. 2008-12-16. Retrieved 2010-05-29.
- ↑ Phillips, Tony (2010-06-14). "As the Sun Awakens, NASA Keeps a Wary Eye on Space Weather". Science@NASA. Retrieved 2010-06-15.
- ↑ Thompson, Andrea (2008-12-16). "Leaks Found in Earth's Protective Magnetic Field". SPACE.com. Retrieved 2010-06-02.
As it orbited Earth, THEMIS's five spacecraft were able to estimate the thickness of the band of solar particles coming when the fields were aligned — it turned out to be about 20 times the number that got in when the fields were anti-aligned.
- ↑ Kaku, Michio (2010-03-31). "A Possible Solar Storm in 2012?". Dr. Kaku's Universe. Big Think. Retrieved 2010-06-04.
Communication systems and power systems worldwide could be wiped out for months at a time. Something this large would cause not just a localized but rather a continent-wide power outage.
- ↑ Clark, Stuart (2010-03-31). "What's wrong with the Sun?". New Scientist (2764).
- ↑ "Polar Field Reversal as observed with Hinode". NAOJ. 2012-04-19. Retrieved 2012-06-21.
- ↑ "12-21-2012 Just Another Day". NASA. 2012-07-03. Retrieved 2013-05-18.
- ↑ "Beyond 2012: Why the World Didn't End". NASA. 2012-12-22. Retrieved 2013-05-18.
- ↑ Archived January 16, 2012, at the Wayback Machine.
- ↑ "Homepage - NOAA / NWS Space Weather Prediction Center". noaa.gov.
- ↑ "Aurora Update". Harvard-Smithsonian Center for Astrophysics. 2010-08-03.
- 1 2 "Solar Tsunami to Strike Earth Tonight". FoxNews.com. 2010-08-03.
- ↑ "Alerte aux aurores boréales pour le 3 et le 4 août ! | Ciel et Espace" (in French). Cieletespace.fr. Retrieved 2010-08-03.
- ↑ "News and information about meteor showers, solar flares, auroras, and near-Earth asteroids". SpaceWeather.com. Retrieved 2010-08-03.
- ↑ "Northern lights could illuminate the sky late Tuesday night". CNN.com. 2010-08-03.
- ↑ "Time Machine". Spaceweather.com. Retrieved 2012-01-24.
- ↑ Jones, Meg. "Northern lights produce great show Tuesday night; encore expected Wednesday". Milwaukee-Wisconsin Journal Sentinel. Retrieved 2010-08-04.
- ↑ Kaplan, Jeremy (2010-08-04). "Solar Storm Causes Fantastic Light Show". Foxnews.com. Retrieved 2010-08-04.
- ↑ "M5 solar flare". SpaceWeather.com.
- ↑ Valentine’s Day Solar Flare, NASA, February 17, 2011.
- ↑ "Time Machine". Spaceweather.com. Retrieved 2012-01-24.
- ↑ "Time Machine". Spaceweather.com. Retrieved 2012-01-24.
- ↑ "Spaceweather.com Time Machine". spaceweather.com.
- ↑ "Spaceweather.com Time Machine". spaceweather.com.
- ↑ Sun packs a double punch, NASA website, August 4, 2011.
- ↑ Strong geomagnetic storm in progress now as solar storm nails earth, WeatherSpace.com, August 5, 2011.
- ↑ What's Up in Space, SpaceWeather.com, August 4, 2011.
- ↑ "Time Machine". Spaceweather.com. Retrieved 2012-01-24.
- ↑ "Time Machine". Spaceweather.com. Retrieved 2012-01-24.
- ↑ "Time Machine". Spaceweather.com. Retrieved 2012-01-24.
- ↑ "Spaceweather.com Time Machine". spaceweather.com.
- ↑ "Strong solar activity continues". Southgate Amateur Radio News. 25 September 2011. Retrieved 25 September 2011.
- ↑ "Time Machine". Spaceweather.com. Retrieved 2012-01-24.
- ↑ "Spectacular Sun Diving Comet and M3.9 Class Flare – Oct 1, 2011". The Truth Behind the Scenes. Retrieved 2012-03-10.
- ↑ "Spaceweather.com Time Machine". spaceweather.com.
- ↑ "Solar Flux - Climate Change Sanity". wordpress.com.
- ↑ "SOLAR ACTIVITY PICKS UP". SpaceWeather. Retrieved 29 December 2011.
- 1 2 "Cycle 24 averages, by Solarham". Archived from the original on May 13, 2012. Retrieved 11 March 2012.
- ↑ "Time Machine". Spaceweather.com. Retrieved 2012-01-24.
- ↑ "NOAA GOES satellite image of largest solar radiation storm since 2005". Under the Mountain Bunker. Archived from the original on November 9, 2013. Retrieved 2012-01-24.
- ↑ "Time Machine". Spaceweather.com. Retrieved 2012-01-24.
- ↑ "Space Weather Alerts". Space Weather Prediction Center. NOAA. Archived from the original on January 27, 2012. Retrieved 27 January 2012.
- ↑ "Spaceweather.com". Retrieved 27 January 2012.
- ↑ "Space.com". Retrieved 5 March 2012.
- ↑ "The Watchers". Retrieved 5 March 2012.
- ↑ "Universe Today". Retrieved 7 March 2012.
- ↑ "Space Weather Prediction Center's March 7th Report of Solar-Geophysical Activity". Retrieved 7 March 2012.
- ↑ "MASA". Retrieved 11 June 2012.
- ↑ "This Months Solar Flare 'Likely Knocked' Military Satellites Offline". Retrieved 23 March 2012.
- ↑ "Solar Storm Dumps Gigawatts into Earth's Upper Atmosphere". Retrieved 22 March 2012.
- 1 2 3 "Big Blast--April 16th Flare and CME". NASA. Retrieved 2012-04-18.
- ↑ "Huge Sunspot Aimed at Earth -- Eruption Imminent?: Big Pic". Discovery News. Retrieved 2012-05-11.
- ↑ "Big Sunspot 1520 Releases X1.4 Class Flare". NASA. Retrieved 2012-07-14.
- ↑ "AR1520's Parting Shot: July 19, 2012 M7.7 Flare". NASA. Retrieved 2012-07-21.
- 1 2 "August 31, 2012 Magnificent CME". NASA/Goddard Space Flight Center.
- ↑ "Magnetic storms online, September 5, 2012". TESIS.
- ↑ "The Sun Unleashes a Wide, but Benign, CME". NASA. September 30, 2012.
- ↑ "G2 geomagnetic storm (Kp=6) again in progress". The Watchers.
- 1 2 3 4 5 "Active Region on the Sun Emits Another Flare". NASA/Goddard Space Flight Center.
- ↑ "Major eruption - Active region around east limb produced powerful X1.7 solar flare". The Watchers.
- ↑ "M6.0 Flare". NASA Goddard Space Flight Center.
- 1 2 "Monthly Solar Flux and Sunspot Averages + Trend Charts". SolarHam.
- ↑ "Space Weather Alerts and Warnings Timeline, 1-15th April 2013". NOAA/Space Weather Prediction Center.
- ↑ "First X-Class Solar Flares of 2013". NASA/Goddard Space Flight Center.
- 1 2 Tariq Malik, Monster solar flare: Why is the sun acting up now?, Christian Science Monitor, October 27, 2014.
- ↑ "Solar Dynamics Observatory Sees M7.9-Class Solar Flare". NASA/SDO.
- ↑ "'Solar storm' grounds Swedish air traffic". The Local. 4 November 2015. Retrieved 4 November 2015.
- ↑
- ↑
- ↑
External links
| Wikimedia Commons has media related to Solar Cycle 24. |
| Wikinews has related news: Sun begins Solar Cycle 24 |
- Solar Cycle 24 Prediction at NASA
- Solar Cycle Prediction at NOAA
- Solar Cycle 24 Progression at NOAA
- NOAA's Space Weather Prediction Center (SWPC)
- NASA/GSFC's Solar Dynamics Observatory (SDO)
- Radio and Space Weather Services (Australian Government Bureau of Meteorology)
- SolarCycle24.com (space weather site)
- SpaceWeather (space weather site)
- SolarMonitor (space weather site)
- The Watchers (space weather microsite)
- NOAA Space Weather Scales
| 18th century |
|  |
|---|---|---|
| 19th century |
| |
| 20th century |
| |
| 21st century |
| |