Sidoarjo Regency
| Sidoarjo Regency (Kabupaten Sidoarjo) | ||
|---|---|---|
| Regency | ||
| ||
| Motto: Sidoarjo Bersih Hatinya | ||

| ||
| Coordinates: 7°27′S 112°42′E / 7.450°S 112.700°ECoordinates: 7°27′S 112°42′E / 7.450°S 112.700°E | ||
| Country |
| |
| Province | East Java | |
| Area | ||
| • Total | 634.38 km2 (244.94 sq mi) | |
| Population (2014) | ||
| • Total | 1,996,034 | |
| • Density | 3,100/km2 (8,100/sq mi) | |
| Time zone | WIB (UTC+7) | |
| Website |
www | |

Sidoarjo Regency is a regency (kabupaten) of East Java, Indonesia.
Sidoarjo Regency is bordered by Surabaya city and Gresik Regency to the north, by Pasuruan Regency to the south, by Mojokerto Regency to the west and by the Madura Strait to the east. It has an area of 634.89 km², making it the smallest regency in East Java.[1] As at the 2010 Census, Sidoarjo Regency had a population of 1,941,497;[2] the latest official estimate (as at 2014) is 1,996,034. The regency is part of the urban region surrounding Surabaya, known as 'Gerbangkertosusila' area.[3]
Administration
The Sidoarjo Regency was divided at 2010 into eighteen districts (kecamatan), tabulated below with their 2010 Census population.[4]
- Tarik (61,032)
- Prambon (68,576)
- Krembung (58,336)
- Porong (64,390)
- Jabon (49,567)
- Tanggulangin (83,304)
- Candi (145,155)
- Tulangan (84,582)
- Wonoayu (71,822)
- Sukodono (110,596)
- Sidoarjo (193,469)
- Buduran (91,931)
- Sedati (92,786)
- Waru (231,309)
- Gedangan (132,971)
- Taman (213,224)
- Krian (131,281)
- Balang Bendo (66,841)
Economy
As a satellite region and part of Greater Surabaya, Sidoarjo hosts number of manufacturing plants and factories. Among others are Maspion factories that produces household goods. Sidoarjo is also a fishing town, there are around 15,000 small and medium enterprises established in Sidoarjo, most of them are belongs to krupuk (traditional cracker) industry.[5] Sidoarjo is also famous for its processed fisheries products, such as prawn cracker, fish cracker, shrimp paste and petis.
Mud flow 2006
Since May 2006, more than 10,000 people in the Porong District have been displaced by the hot mud flowing from a natural gas well being drilled by Lapindo Brantas, an oil well company that is part of a conglomerate owned by Coordinating Minister for the People's Welfare Aburizal Bakrie.[6] Gas and hot mud started spewing from the well on May 28, when the drill penetrated a layer of liquid sediment. Attempts to pump concrete down the well did not stop the flow. While some scientists have speculated that the earthquake that struck Yogyakarta on May 27, the day before the well erupted, may have cracked the ground, creating potential pathways for the mud to reach the surface, others have suggested that the drilling procedure was faulty by not using a casing. This is likely to be incorrect as technical papers on the subject showed that there were up to four sets of casing installed and cemented in the well. Some 50,000 cubic metres of hot mud were erupting every day as of August; in September, the amount increased to some 125,000 cubic metres daily.[7] On September 26 barriers built to hold back the mud failed, resulting in the flooding of more villages. Gus Maksum, one of the thousands of Sidoarjo villagers displaced by the mud flow gives a detailed first-hand account of the first year of the disaster in his memoir Titanic Made By Lapindo.[8] As of late September 2006 scientists are saying that the eruption may be a mud volcano forming, and may be impossible to stop.[9][10][11]
Climate
This section describes the historical weather record at the Juanda International Airport during 2015. This station has records back to March 2005.
Sidoarjo has a tropical savanna climate with dry winters. The area within 40 km of this station is covered by croplands (41%), oceans and seas (39%), forests (17%), and lakes and rivers(2%).[12]
| Daily Climate Data (Juanda Weather Station - 96935, 2015)[13] | ||||||||||||
|---|---|---|---|---|---|---|---|---|---|---|---|---|
| Month | January | February | March | April | May | June | July | August | September | October | November | December |
| Average High Temperature (oC) | 32.40 | 32.53 | 31.71 | 31.97 | 31.38 | 31.45 | 31.01 | 30.96 | 31.78 | 32.91 | 34.64 | 33.14 |
| Average Low Temperature (oC) | 24.64 | 24.41 | 24.38 | 25.21 | 24.86 | 23.69 | 23.08 | 23.03 | 22.68 | 24.06 | 26.48 | 25.31 |
| Average Mean Temperature (oC) | 27.61 | 27.95 | 27.83 | 28.00 | 28.12 | 27.34 | 26.97 | 26.94 | 27.53 | 28.60 | 30.48 | 28.48 |
| Rainfall Rate (mm) | 15.82 | 5.54 | 16.10 | 7.52 | 4.88 | 0 | 0 | 0.72 | 0 | 0 | 0 | 3.14 |
| Highest Humidity (%) | 92 | 81 | 88 | 93 | 90 | 80 | 78 | 83 | 74 | 76 | 72 | 86 |
| Lowest Humidity (%) | 66 | 79 | 75 | 74 | 69 | 70 | 73 | 70 | 63 | 63 | 66 | 73 |
| Average Mean Humidity (%) | 81.12 | 79.75 | 82.18 | 82.69 | 78.12 | 74.88 | 75.71 | 74.08 | 69.2 | 68.19 | 68.57 | 79.2 |
Temperature
The hottest day of 2015 was October 16, with a high temperature of 35 °C. For reference, on that day the average high temperature is 33 °C and the high temperature exceeds 34 °C only one day in ten. The hottest month of 2015 was November with an average daily high temperature of 34 °C.
Relative to the average, the hottest day was December 26. The high temperature that day was 35 °C, compared to the average of 31 °C, a difference of 4 °C. In relative terms the warmest month wasNovember, with an average high temperature of 34 °C, compared to a typical value of 33 °C.
The longest warm spell was from November 7 to December 6, constituting 30 consecutive days with warmer than average high temperatures. The month of November had the largest fraction of warmer than average days with 93% days with higher than average high temperatures.
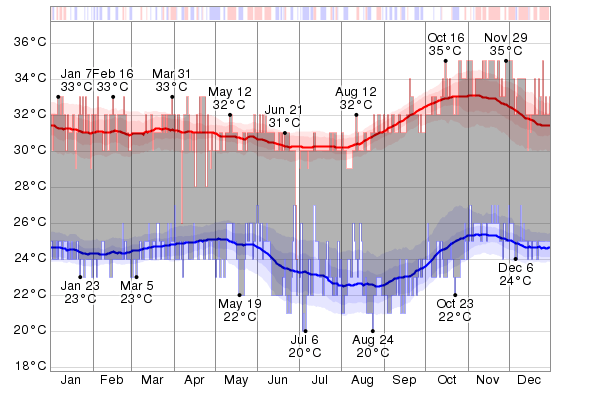
The coldest day of 2015 was July 4, with a low temperature of 20 °C. For reference, on that day the average low temperature is 23 °C and the low temperature drops below 21 °C only one day in ten. Thecoldest month of 2015 was September with an average daily low temperature of 22 °C.
Relative to the average, the coldest day was July 6. The low temperature that day was 20 °C, compared to the average of 23 °C, a difference of 3 °C. In relative terms the coldest month wasOctober, with an average low temperature of 24 °C, compared to a typical value of 25 °C.
The longest cold spell was from January 22 to February 8, constituting 18 consecutive days with cooler than average low temperatures. The month of February had the largest fraction of cooler than average days with 86% days with lower than average low temperatures.
Humidity
Humidity is an important factor in determining how weather conditions feel to a person experiencing them. Hot and humid days feel even hotter than hot and dry days because the high level of water content in humid air discourages the evaporation of sweat from a person's skin.
When reading the graph below, keep in mind that the hottest part of the day tends to be the least humid, so the daily low (brown) traces are more relevant for understanding daytime comfort than the daily high (blue) traces, which typically occur during the night. Applying that observation, the least humid month of 2015 was October with an average daily low humidity of 40%, and the most humid month was April with an average daily low humidity of 64%.
But it is important to keep in mind that humidity does not tell the whole picture and the dew point is often a better measure of how comfortable a person will find a given set of weather conditions. Please see the next section for continued discussion of this point.

Wind
The highest sustained wind speed was 13 m/s, occurring on July 13; the highest daily mean wind speed was 9 m/s (July 13); and the highest wind gust speed was 19 m/s (February 4).
The windiest month was October, with an average wind speed of 5 m/s. The least windy month wasApril, with an average wind speed of 3 m/s.

References
- ↑ East Java - Sidoarjo
- ↑ Biro Pusat Statistik, Jakarta, 2011.
- ↑ Mega Urbanization
- ↑ Biro Pusat Statistik, Jakarta, 2011.
- ↑ "Sidoarjo Cracker Industry". EastJava.com. 4 November 2010. Retrieved 3 November 2014.
- ↑ The Jakarta Post: Bakrie name at stake - URL retrieved October 13, 2006
- ↑ Katastrophen: Sintflut aus Matsch (Spiegel Online, in German) - URL retrieved October 13, 2006
- ↑ Gus Maksum's Titanic Made By Lapindo spotlights Sidoarjo - URL retrieved September 15, 2010
- ↑ Mud volcano floods Java - URL retrieved September 28, 2006
- ↑ Indonesia mudflow breaks barriers, injures six - URL retrieved September 28, 2006
- ↑ New Indonesia Calamity: A Man-Made Mud Bath - URL retrieved October 6, 2006
- ↑ "Historical Weather For 2015 in Sidoarjo (near Surabaya), Indonesia - WeatherSpark". weatherspark.com. Retrieved 2016-04-11.
- ↑ "DATA ONLINE - PUSAT DATABASE - BMKG". dataonline.bmkg.go.id. Retrieved 2016-04-11.