Sheffield City Council elections
Sheffield City Council elections usually take place by thirds, three years out of every four. Each of Sheffield's 28 wards is represented by three positions on the council, meaning there are usually 28 seats contested in each local election. 2004 saw new ward boundaries and therefore all seats were contested.
Political control

| Party in control | Years |
|---|---|
| Labour | 1973–1999 |
| Liberal Democrats | 1999–2002 |
| No overall control | 2002–2003 |
| Labour | 2003–2007 |
| No overall control | 2007–2008 |
| Liberal Democrats | 2008–2010 |
| No overall control | 2010–2011 |
| Labour | 2011–present |
Council elections
Before 1974, elections were by thirds annually for a three-year term, with Aldermen elected from the body of councillors every three years. In 1974, Aldermen were abolished, and elections to Sheffield City Council are by thirds, in three years of every four, for a four-year term.
For twenty years from 1846, Isaac Ironside's Central Democratic Association was a force on the council. It then returned to typical Conservative–Liberal rivalry. Labour made little impact in its early years; by 1918, there were only three Labour councillors (and two Liberal-Labour, plus one Lib-Lab alderman). That all changed in 1919; Labour won almost all the seats up for election that year, giving them 12 and their coalition partners the Co-operative Party two. In response to their losses, the Conservative and Liberal groups merged to form the Citizens Association, retaining control with 32 councillors and 15 aldermen. The Lib-Labs remained unchanged in numbers and politically between the two groups.[1]
| Year | Conservative | Liberal | Liberal Unionist | Lib-Lab | Labour | Others[2] |
|---|---|---|---|---|---|---|
| 1881 | 34 | 30 | - | - | - | - |
| 1882 | 34 | 30 | - | - | - | - |
| 1883 | 36 | 28 | - | - | - | - |
| 1884 | 34 | 30 | - | - | - | - |
| 1885 | 33 | 31 | - | - | - | - |
| 1886 | 31 | 29 | 4 | - | - | - |
| 1887 | 30 | 30 | 4 | - | - | - |
| 1888 | 29 | 30 | 5 | - | - | - |
| 1889 | 30 | 30 | 5 | - | - | - |
| 1890 | 29 | 31 | 4 | - | - | - |
| 1891 | 30 | 31 | 3 | - | - | - |
| 1892 | 31 | 30 | 3 | - | - | - |
| 1893 | 36 | 25 | - | 3 | - | - |
| 1894 | 37 | 24 | - | 3 | - | - |
| 1895 | 39 | 22 | - | 3 | - | - |
| 1896 | 38 | 22 | - | 4 | - | - |
| 1897 | 36 | 23 | - | 6 | - | - |
| 1898[3] | 32 | 25 | - | 5 | - | - |
| 1899 | 34 | 25 | - | 5 | - | - |
| 1900 | 35 | 23 | - | 6 | - | - |
| 1901 | 29 | 29 | - | 6 | - | - |
| 1902 | 32 | 26 | - | 6 | - | - |
| 1903[3] | 32 | 26 | - | 5 | - | - |
| 1904 | 34 | 24 | - | 6 | - | - |
| 1905 | 30 | 26 | - | 7 | 1 | - |
| 1906 | 30 | 25 | - | 6 | 3 | - |
| 1907 | 31 | 24 | - | 5 | 4 | - |
| 1908 | 35 | 22 | - | 4 | 3 | - |
| 1909 | 35 | 22 | - | 4 | 3 | - |
| 1910[3] | 33 | 23 | - | 5 | 2 | - |
| 1911 | 29 | 30 | - | 4 | 1 | - |
| 1912 | 31 | 30 | - | 3 | - | - |
| 1913 | 32 | 27 | - | 3 | 2 | - |
| 1919 | 26 | 22 | - | - | 13 | 3 |
| 1920 | 24 | 21 | - | - | 13 | 6 |
Labour continued to advance at the expense of the Citizens Association. By 1922, there were 18 Labour councillors and one alderman; by 1925, 22 councillors and one alderman. At the 1926 elections, Labour rose to 29 councillors. A majority on the council and a large number of retiring aldermen finally enabled them to take 8 positions on the aldermanic bench.[1]
The seats were redistributed into 24 wards in 1930, and the Citizens Association renamed itself the Progressive Party, and a further seat was added for Norton in 1934, taking the total number of positions to 75 councillors and 25 aldermen. That year, Labour briefly lost control, but regained it in 1934, with an increased majority of 12. This rose to 14 the following year. In 1945, Labour had 59 total seats to the Progressive's 39, one independent and one Communist. Labour continued to build its majority, to 34 in 1952 and 42 by 1958.[1] However, it lost control to the Conservative Party, again standing on its own, in 1968-9.
| Year | Labour | Citizens' Association / Municipal Progressive | Ind. Conservative | Ind. Liberal | Ind. Labour Party | Communist | Others[4] |
|---|---|---|---|---|---|---|---|
| 1921 | 19 | 38 | 1 | 2 | - | - | 8 |
| 1922 | 20 | 40 | - | 2 | - | - | 6 |
| 1923 | 22 | 40 | 1 | 3 | - | - | 2 |
| 1924 | 24 | 38 | 3 | 3 | - | - | - |
| 1925 | 24 | 39 | 3 | 2 | - | - | - |
| 1926 | 38 | 25 | 3 | 1 | - | - | 1 |
| 1927 | 39 | 24 | 3 | 1 | - | - | 1 |
| 1928 | 41 | 23 | ? | - | - | - | 1 |
| 1929 | 63 | 22 | 9 | ? | - | - | ? |
| 1930 | 57 | ? | ? | ? | - | - | ? |
| 1931 | 49 | ? | ? | ? | 1 | - | ? |
| 1932 | 41 | ? | ? | ? | 1 | - | ? |
| 1933 | 50 | ? | ? | ? | - | - | ? |
| 1934 | 56 | ? | ? | ? | - | - | ? |
| 1935 | 57 | ? | ? | ? | - | - | ? |
| 1936 | ? | ? | ? | ? | - | - | ? |
| 1937 | ? | ? | ? | ? | - | - | ? |
| 1938 | 53 | ? | ? | ? | - | - | ? |
| 1945 | 59 | 39 | - | - | - | 1 | 1 |
| 1946 | 63 | 36 | - | - | - | - | 1 |
| 1947 | 68 | ? | ? | ? | - | - | ? |
| 1949 | 64 | 36 | ? | ? | - | - | ? |
| Year | Labour | Liberal | Conservative | Independent | Ratepayers |
|---|---|---|---|---|---|
| 1950 | 64 | 0 | 36 | 0 | 0 |
| 1951 | 63 | 0 | 37 | 0 | 0 |
| 1952 | 67 | 0 | 33 | 0 | 0 |
| 1953 | 68 | 0 | 32 | 0 | 0 |
| 1954 | 70 | 0 | 30 | 0 | 0 |
| 1955 | 72 | 0 | 28 | 0 | 0 |
| 1956 | 72 | 0 | 28 | 0 | 0 |
| 1957 | 72 | 0 | 28 | 0 | 0 |
| 1958 | 72 | 0 | 28 | 0 | 0 |
| 1959 | 72 | 0 | 28 | 0 | 0 |
| 1960 | 67 | 0 | 32 | 0 | 1 |
| 1961 | 67 | 0 | 32 | 0 | 1 |
| 1962 | 67 | 0 | 32 | 0 | 1 |
| 1963 | 73 | 0 | 27 | 0 | 0 |
| 1964 | 73 | 0 | 27 | 0 | 0 |
| 1965 | 72 | 0 | 28 | 0 | 0 |
| 1966 | 72 | 0 | 28 | 0 | 0 |
| 1967 | 59 | 0 | 48 | 1 | 0 |
| 1968 | 52 | 0 | 56 | 0 | 0 |
| 1969 | 57 | 0 | 51 | 0 | 0 |
| 1970 | 63 | 1 | 44 | 0 | 0 |
| 1971 | 80 | 1 | 27 | 0 | 0 |
| 1972 | 84 | 1 | 23 | 0 | 0 |
Boundary changes took place for the 2004 election which reduced the number of seats by 3, leading to the whole council being elected in that year.


| Year | Labour | Conservative | Liberal and SDP (before 1990) Liberal Democrat (after 1990) |
Greens | Independent | UKIP | ||||||
| 1973 | 69 | 18 | 3 | 0 | 0 | 0 | ||||||
| 1975 | 66 | 20 | 4 | 0 | 0 | 0 | ||||||
| 1976 | 63 | 22 | 5 | 0 | 0 | 0 | ||||||
| 1978 | 60 | 24 | 6 | 0 | 0 | 0 | ||||||
| 1979 | 62 | 22 | 6 | 0 | 0 | 0 | ||||||
| 1980 | 60 | 18 | 9 | 0 | 0 | 0 | ||||||
| 1982 | 60 | 18 | 9 | 0 | 0 | 0 | ||||||
| 1983 | 60 | 18 | 9 | 0 | 0 | 0 | ||||||
| 1984 | 61 | 17 | 9 | 0 | 0 | 0 | ||||||
| 1986 | 63 | 15 | 9 | 0 | 0 | 0 | ||||||
| 1987 | 65 | 13 | 9 | 0 | 0 | 0 | ||||||
| 1988 | 66 | 12 | 9 | 0 | 0 | 0 | ||||||
| 1990 | 69 | 10 | 7 | 0 | 0 | 0 | ||||||
| 1991 | 70 | 11 | 6 | 0 | 0 | 0 | ||||||
| 1992 | 67 | 11 | 9 | 0 | 0 | 0 | ||||||
| 1994 | 56 | 8 | 22 | 0 | 0 | 0 | ||||||
| 1995 | 58 | 4 | 25 | 0 | 0 | 0 | ||||||
| 1996 | 55 | 1 | 31 | 0 | 0 | 0 | ||||||
| 1998 | 50 | 1 | 36 | 0 | 0 | 0 | ||||||
| 1999 | 39 | 1 | 47 | 0 | 0 | 0 | ||||||
| 2000 | 37 | 1 | 49 | 0 | 1 (Liberal) | 0 | ||||||
| 2002 | 43 | 2 | 42 | 0 | 0 | 0 | ||||||
| 2003 | 49 | 1 | 37 | 0 | 0 | 0 | ||||||
| 2004 | 44 | 2 | 37 | 1 | 0 | 0 | ||||||
| 2006 | 44 | 2 | 36 | 2 | 0 | 0 | ||||||
| 2007 | 41 | 1 | 39 | 2 | 1 | 0 | ||||||
| 2008 | 36 | 0 | 45 | 3 | 0 | 0 | ||||||
| 2010 | 39 | 0 | 42 | 2 | 1 | 0 | ||||||
| 2011 | 50 | 0 | 32 | 2 | 0 | 0 | ||||||
| 2012 | 60 | 0 | 22 | 2 | 0 | 0 | ||||||
| 2014 | 59 | 0 | 18 | 4 | 0 | 3 | ||||||
| 2015 | 59 | 0 | 17 | 4 | 0 | 4 | ||||||
| 2016 | 57 | 0 | 19 | 4 | 0 | 4 | ||||||
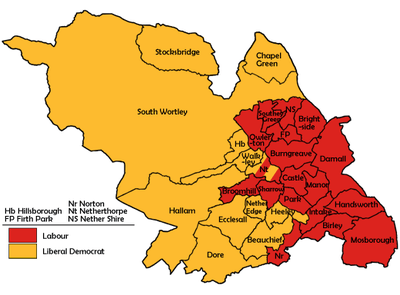
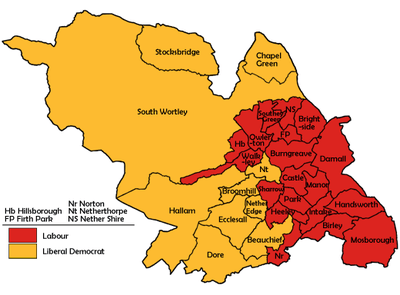
Borough result maps
-

1980 results map
-

1982 results map
-

1983 results map
-

1984 results map
-

1986 results map
-

1987 results map
-

1988 results map
-

1990 results map
-

1991 results map
-

1992 results map
-
1994 results map
-

1995 results map
-

1996 results map
-

1998 results map
-

1999 results map
-

2000 results map
-
2002 results map
-

2003 results map
-

2004 results map
-

2006 results map
-

2007 results map
-

2008 results map
-

2010 results map
-

2011 results map
By-election results
By-elections occur when seats become vacant between council elections. Below is a summary of recent by-elections; full by-election results can be found by clicking on the by-election name.
See also
References
- 1 2 3 J. Mendelson, W. Owen, S. Pollard and V. M. Thornes, The Sheffield Trades and Labour Council 1858 - 1958
- ↑ Discharged Soldiers and Sailors Association, Middle Classes Union, National Democratic and Labour Party and one candidate elected in 1920 after the formation of the Citizen's Association.
- 1 2 3 Some seats were vacant during this session.
- ↑ Discharged Soldiers and Sailors Association, Middle Classes Union and National Democratic and Labour Party in the 1920s and some independents later.
External links
| Barnsley Metropolitan Borough Council | |
|---|---|
| Doncaster Metropolitan Borough Council | |
| Rotherham Metropolitan Borough Council | |
| Sheffield City Council |
|
| South Yorkshire County Council |
|
| West Riding County Council | |
| |