Sea level rise


Sea level rise has been estimated to be on average between +2.6 millimetres (0.10 in) and 2.9 millimetres (0.11 in) per year ± 0.4 millimetres (0.016 in) since 1993[3] and has accelerated in recent years.[4] For the period between 1870 and 2004, global average sea levels are estimated to have risen a total of 195 millimetres (7.7 in), and 1.7 millimetres (0.067 in) ± 0.3 millimetres (0.012 in) per year, with a significant acceleration of sea-level rise of 0.013 millimetres (0.00051 in) ± 0.006 millimetres (0.00024 in) per year.
According to one study of measurements available from 1950 to 2009, these measurements show an average annual rise in sea level of 1.7 millimetres (0.067 in) ± 0.3 millimetres (0.012 in) per year during this period, with satellite data showing a rise of 3.3 millimetres (0.13 in) ± 0.4 millimetres (0.016 in) per year from 1993 to 2009.[5] Sea level rise is one of several lines of evidence that support the view that the global climate has recently warmed.[6] In 2014 the USGCRP National Climate Assessment projected that by the year 2100, the average sea level rise will have been between one and four feet (300mm-1200mm) since the date of the 2014 assessment. Current rates of sea level rise have roughly doubled since the pre 1992 rates of sea level rise of the 20th century.[7]
In 2007, the Intergovernmental Panel on Climate Change (IPCC) stated that it is most likely human-induced (anthropogenic) warming contributed to the sea level rise observed in the latter half of the 20th century.[8] The 2013 IPCC report (AR5) concluded, "there is high confidence that the rate of sea level rise has increased during the last two centuries, and it is likely that GMSL (Global Mean Sea Level) has accelerated since the early 1900’s.[9]
Sea level rises can considerably influence human populations in coastal and island regions and natural environments like marine ecosystems.[10][11] Sea level rise is expected to continue for centuries.[12] Because of the slow inertia, long response time for parts of the climate system, it has been estimated that we are already committed to a sea-level rise of approximately 2.3 metres (7.5 ft) for each degree Celsius of temperature rise within the next 2,000 years.[13] It has been suggested that besides CO2 emissions reductions, a short term action to reduce sea level rise is to cut emissions of heat trapping gases such as methane and particulates such as soot.[14][15] Elevation on Earth is referenced to mean sea level. Mean sea level is a value based on average tidal levels recorded hourly at a given site over many years. (living landscapes, Stephen McCarron and Mary Gimartin, p139)
Mechanism
.png)
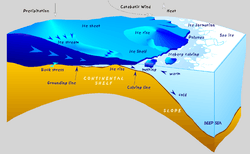
There are two main mechanisms that contribute to observed sea level rise:[16] (1) thermal expansion: because of the increase in ocean heat content (ocean water expands as it warms);[17] and (2) the melting of major stores of land ice like ice sheets and glaciers.
On the timescale of centuries to millennia, the melting of ice sheets could result in even higher sea level rise. Partial deglaciation of the Greenland ice sheet, and possibly the West Antarctic ice sheet, could contribute 4 to 6 m (13 to 20 ft) or more to sea level rise.[18]
Past changes in sea level
Various factors affect the volume or mass of the ocean, leading to long-term changes in eustatic sea level. The two primary influences are temperature (because the density of water depends on temperature), and the mass of water locked up on land and sea as fresh water in rivers, lakes, glaciers and polar ice caps. Over much longer geological timescales, changes in the shape of oceanic basins and in land–sea distribution affect sea level. Since the Last Glacial Maximum about 20,000 years ago, sea level has risen by more than 125 m, with rates varying from tenths of a mm/yr to 10+mm/year, as a result of melting of major ice sheets.[19]
During deglaciation between about 19,000 and 8,000 calendar years ago, sea level rose at extremely high rates as the result of the rapid melting of the British-Irish Sea, Fennoscandian, Laurentide, Barents-Kara, Patagonian, Innuitian ice sheets and parts of the Antarctic ice sheet. At the onset of deglaciation about 19,000 calendar years ago, a brief, at most 500-year long, glacio-eustatic event may have contributed as much as 10 m to sea level with an average rate of about 20 mm/yr. During the rest of the early Holocene, the rate of sea level rise varied from a low of about 6.0 - 9.9 mm/yr to as high as 30 - 60 mm/yr during brief periods of accelerated sea level rise.[20][21]
Solid geological evidence, based largely upon analysis of deep cores of coral reefs, exists only for 3 major periods of accelerated sea level rise, called meltwater pulses, during the last deglaciation. They are Meltwater pulse 1A between circa 14,600 and 14,300 calendar years ago; Meltwater pulse 1B between circa 11,400 and 11,100 calendar years ago; and Meltwater pulse 1C between 8,200 and 7,600 calendar years ago. Meltwater pulse 1A was a 13.5 m rise over about 290 years centered at 14,200 calendar years ago and Meltwater pulse 1B was a 7.5 m rise over about 160 years centered at 11,000 years calendar years ago. In sharp contrast, the period between 14,300 and 11,100 calendar years ago, which includes the Younger Dryas interval, was an interval of reduced sea level rise at about 6.0 - 9.9 mm/yr. Meltwater pulse 1C was centered at 8,000 calendar years and produced a rise of 6.5 m in less than 140 year.[21][22][23] Such rapid rates of sea level rising during meltwater events clearly implicate major ice-loss events related to ice sheet collapse. The primary source may have been meltwater from the Antarctic ice sheet. Other studies suggest a Northern Hemisphere source for the meltwater in the Laurentide ice sheet.[23]
Recently, it has become widely accepted that late Holocene, 3,000 calendar years ago to present, sea level was nearly stable prior to an acceleration of rate of rise that is variously dated between 1850 and 1900 AD. Late Holocene rates of sea level rise have been estimated using evidence from archaeological sites and late Holocene tidal marsh sediments, combined with tide gauge and satellite records and geophysical modeling. For example, this research included studies of Roman wells in Caesarea and of Roman piscinae in Italy. These methods in combination suggest a mean eustatic component of 0.07 mm/yr for the last 2000 years.[20]
Since 1880, as the Industrial Revolution took center stage, the ocean began to rise briskly, climbing a total of 210 mm (8.3 in) through 2009 causing extensive erosion worldwide and costing billions.[24]
Sea level rose by 6 cm during the 19th century and 19 cm in the 20th century.[25] Evidence for this includes geological observations, the longest instrumental records and the observed rate of 20th century sea level rise. For example, geological observations indicate that during the last 2,000 years, sea level change was small, with an average rate of only 0.0–0.2 mm per year. This compares to an average rate of 1.7 ± 0.5 mm per year for the 20th century.[26] Baart et al. (2012) show that it is important to account for the effect of the 18.6-year lunar nodal cycle before acceleration in sea level rise should be concluded.[27] Based on tide gauge data, the rate of global average sea level rise during the 20th century lies in the range 0.8 to 3.3 mm/yr, with an average rate of 1.8 mm/yr.[28]
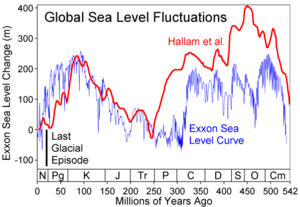
A two degrees Celsius of warming would warm the Earth above Eemian levels, move conditions closer to the Pliocene climate, a time when sea level was in the range of 25 meters higher than today.[29] However, one study argues that sea level during the Pliocene might have only risen by 9 to 13.5 meters, due to more resilient ice sheets.[30] Warren Cornwall, in: 'Ghosts of Ocean Past', published in an 'Science' monographic issue, 13 November 2015: 'Sea changes', pgs 752-755, presented a chart showing the current warming respect to preindustrial era of 1 °C, that goes along with the current CO2 in atmosphere of 400 ppm. With the same 400 ppm CO2, 3 million years ago, with an increased average temperature of 2 to 3 °C above our preindustrial levels, Sea level was between 6 meters and a not defined enough upper range. The issue may be not if Sea Level will rise, but how much, and at what rate.
Projections
.png)
21st century
The 2007 Fourth Assessment Report (IPCC 4) projected century-end sea levels using the Special Report on Emissions Scenarios (SRES). SRES developed emissions scenarios to project climate-change impacts.[32] The projections based on these scenarios are not predictions,[33] but reflect plausible estimates of future social and economic development (e.g., economic growth, population level).[34] The six SRES "marker" scenarios projected sea level to rise by 18 to 59 centimetres (7.1 to 23.2 in).[35] Their projections were for the time period 2090–99, with the increase in level relative to average sea level over the 1980–99 period. This estimate did not include all of the possible contributions of ice sheets.
Hansen (2007), assumed an ice sheet contribution of 1 cm for the decade 2005–15, with a potential ten year doubling time for sea-level rise, based on a nonlinear ice sheet response, which would yield 5 m this century.[36]
Research from 2008 observed rapid declines in ice-mass balance from both Greenland and Antarctica, and concluded that sea-level rise by 2100 is likely to be at least twice as large as that presented by IPCC AR4, with an upper limit of about two meters.[37]
Projections assessed by the US National Research Council (2010)[38] suggest possible sea level rise over the 21st century of between 56 and 200 cm (22 and 79 in). The NRC describes the IPCC projections as "conservative".[38]
In 2011, Rignot and others projected a rise of 32 centimetres (13 in) by 2050. Their projection included increased contributions from the Antarctic and Greenland ice sheets. Use of two completely different approaches reinforced the Rignot projection.[39][40]
In its Fifth Assessment Report (2013), The IPCC found that recent observations of global average sea level rise at a rate of 3.2 [2.8 to 3.6] mm per year is consistent with the sum of contributions from observed thermal ocean expansion due to rising temperatures (1.1 [0.8 to 1.4] mm per year), glacier melt (0.76 [0.39 to 1.13] mm per year), Greenland ice sheet melt (0.33 [0.25 to 0.41] mm per year), Antarctic ice sheet melt (0.27 [0.16 to 0.38] mm per year), and changes to land water storage (0.38 [0.26 to 0.49] mm per year). The report had also concluded that if emissions continue to keep up with the worst case IPCC scenarios, global average sea level could rise by nearly 1m by 2100 (0.52−0.98 m from a 1986-2005 baseline). If emissions follow the lowest emissions scenario, then global average sea level is projected to rise by between 0.28−0.6 m by 2100 (compared to a 1986−2005 baseline).[41]
The Third National Climate Assessment (NCA), released May 6, 2014, projected a sea level rise of 1 to 4 feet (30–120 cm) by 2100. Decision makers who are particularly susceptible to risk may wish to use a wider range of scenarios from 8 inches to 6.6 feet (20–200 cm) by 2100.[42]
A 2015 study by sea level rise experts concluded that based on MIS 5e data, sea level rise could rise faster in the coming decades, with a doubling time of 10, 20 or 40 years. The study abstract explains: We argue that ice sheets in contact with the ocean are vulnerable to non-linear disintegration in response to ocean warming, and we posit that ice sheet mass loss can be approximated by a doubling time up to sea level rise of at least several meters. Doubling times of 10, 20 or 40 years yield sea level rise of several meters in 50, 100 or 200 years. Paleoclimate data reveal that subsurface ocean warming causes ice shelf melt and ice sheet discharge.
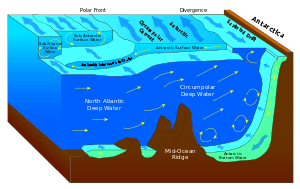
Our climate model exposes amplifying feedbacks in the Southern Ocean that slow Antarctic bottom water formation and increase ocean temperature near ice shelf grounding lines, while cooling the surface ocean and increasing sea ice cover and water column stability. Ocean surface cooling, in the North Atlantic as well as the Southern Ocean, increases tropospheric horizontal temperature gradients, eddy kinetic energy and baroclinicity, which drive more powerful storms.[43] However, Greg Holland from the National Center for Atmospheric Research, who reviewed the study, noted “There is no doubt that the sea level rise, within the IPCC, is a very conservative number, so the truth lies somewhere between IPCC and Jim.”[44]
After 2100
There is a widespread consensus that substantial long-term sea-level rise will continue for centuries to come.[12] IPCC AR4 estimated that at least a partial deglaciation of the Greenland ice sheet, and possibly the West Antarctic ice sheet, would occur given a global average temperature increase of 1–4 °C (relative to temperatures over the years 1990–2000).[45] This estimate was given about a 50% chance of being correct.[46] The estimated timescale was centuries to millennia, and would contribute 4 to 6 metres (13 to 20 ft) or more to sea levels over this period.
Rising sea levels will cause flooding and will have the ability to wipe out entire cities. In a study done by Nature, by 2500 the entire state of Delaware could be completely wiped out. [47]
Models
There is the possibility of a rapid change in glaciers, ice sheets, and hence sea level.[48] Predictions of such a change are highly uncertain due to a lack of scientific understanding. Modeling of the processes associated with a rapid ice-sheet and glacier change could potentially increase future projections of sea-level rise.
Hansen (2007), concluded that paleoclimate ice sheet models generally do not include physics of ice streams, effects of surface melt descending through crevasses and lubricating basal flow, or realistic interactions with the ocean. The calibration of projected modelling for future sea-level rise is generally done with a linear projection of future sea level. Thus, does not include potential nonlinear collapse of an ice sheet.[36]
Contribution
Each year about 8 mm of precipitation (liquid equivalent) falls on the ice sheets in Antarctica and Greenland, mostly as snow, which accumulates and over time forms glacial ice. Much of this precipitation began as water vapor evaporated from the ocean surface. To a first approximation, the same amount of water appeared to return to the ocean in icebergs and from ice melting at the edges. Scientists previously had estimated which is greater, ice going in or coming out, called the mass balance, important because a nonzero balance causes changes in global sea level. High-precision gravimetry from satellites determined that Greenland was losing more than 200 billion tons of ice per year, in accord with loss estimates from ground measurement.[49] The rate of ice loss was accelerating,[50] having grown from 137 gigatons in 2002–2003.[51]
- The total global ice mass lost from Greenland, Antarctica and Earth's glaciers and ice caps during 2003–2010 was about 4.3 trillion tons (1,000 cubic miles), adding about 12 mm (0.5 in) to global sea level, enough ice to cover an area comparable to the United States 50 cm (1.5 ft) deep.[52]
- The melting of small glaciers on the margins of Greenland and the Antarctic Peninsula would increase sea level around 0.5 meter. At the extreme potential, according to the Third Assessment Report of the International Panel on Climate Change, the ice contained within the Greenland ice sheet entirely melted increases sea level by 7.2 meters (24 feet). The ice contained within the Antarctic ice sheet entirely melted would produce 61.1 meters (200 feet) of sea-level change, both totaling a sea-level rise of 68.3 meters (224 feet).[53]
It is estimated that Antarctica, if fully melted, would contribute more than 60 metres of sea level rise, and Greenland would contribute more than 7 metres. Small glaciers and ice caps on the margins of Greenland and the Antarctic Peninsula might contribute about 0.5 metres. While the latter figure is much smaller than for Antarctica or Greenland it could occur relatively quickly (within the coming century) whereas melting of Greenland would be slow (perhaps 1,500 years to fully deglaciate at the fastest likely rate) and Antarctica even slower.[54] However, this calculation does not account for the possibility that as meltwater flows under and lubricates the larger ice sheets, they could begin to move much more rapidly towards the sea.[55][56]
In 2002, Rignot and Thomas found that the West Antarctic and Greenland ice sheets were losing mass, while the East Antarctic ice sheet was probably in balance (although they could not determine the sign of the mass balance for The East Antarctic ice sheet).[57] Kwok and Comiso (J. Climate, v15, 487–501, 2002) also discovered that temperature and pressure anomalies around West Antarctica and on the other side of the Antarctic Peninsula correlate with recent Southern Oscillation events.
In 2005 it was reported that during 1992–2003, East Antarctica thickened at an average rate of about 18 mm/yr while West Antarctica showed an overall thinning of 9 mm/yr. associated with increased precipitation. A gain of this magnitude is enough to slow sea-level rise by 0.12 ± 0.02 mm/yr.[58]
Antarctica
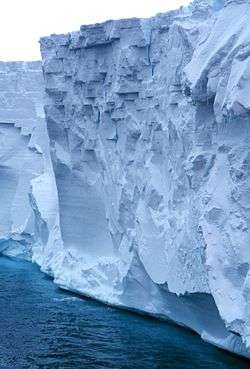
On the Antarctic continent itself, the large volume of ice present stores around 70% of the world's fresh water.[59] This ice sheet is constantly gaining ice from snowfall and losing ice through outflow to the sea.
Sheperd et al. 2012, found that different satellite methods were in good agreement and combing methods leads to more certainty with East Antarctica, West Antarctica, and the Antarctic Peninsula changing in mass by +14 ± 43, –65 ± 26, and –20 ± 14 gigatonnes per year.[60]
East Antarctic ice sheet (EAIS)
East Antarctica is a cold region with a ground-base above sea level and occupies most of the continent. This area is dominated by small accumulations of snowfall which becomes ice and thus eventually seaward glacial flows. The mass balance of the East Antarctic Ice Sheet as a whole over the period 1980-2004 is thought to be slightly positive (lowering sea level) or near to balance, with a large degree of uncertainty.[61][62] However, increased ice outflow has been suggested in some regions.[62][63]
West Antarctic ice sheet (WAIS)
West Antarctica is currently experiencing a net outflow of glacial ice, which will increase global sea level over time. A review of the scientific studies looking at data from 1992 to 2006 suggested a net loss of around 50 gigatons of ice per year was a reasonable estimate (around 0.14 mm of sea-level rise),[61] although significant acceleration of outflow glaciers in the Amundsen Sea Embayment could have more than doubled this figure for the year 2006.[62]
Thomas et al. found evidence of an accelerated contribution to sea level rise from West Antarctica.[64] The data showed that the Amundsen Sea sector of the West Antarctic Ice Sheet was discharging 250 cubic kilometres of ice every year, which was 60% more than precipitation accumulation in the catchment areas. This alone was sufficient to raise sea level at 0.24 mm/yr. Further, thinning rates for the glaciers studied in 2002–03 had increased over the values measured in the early 1990s. The bedrock underlying the glaciers was found to be hundreds of metres deeper than previously known, indicating exit routes for ice from further inland in the Byrd Subpolar Basin. Thus the West Antarctic ice sheet may not be as stable as has been supposed.
A 2009 study found that the rapid collapse of West Antarctic Ice Sheet would raise sea level by 3.3 metres (11 ft).[65]
Glaciers
Observational and modelling studies of mass loss from glaciers and ice caps indicate a contribution to sea-level rise of 0.2–0.4 mm/yr, averaged over the 20th century. The results from Dyurgerov show a sharp increase in the contribution of mountain and subpolar glaciers to sea-level rise since 1996 (0.5 mm/yr) to 1998 (2 mm/yr) with an average of about 0.35 mm/yr since 1960.[66] Of interest also is Arendt et al., who estimate the contribution of Alaskan glaciers of 0.14±0.04 mm/yr between the mid-1950s to the mid-1990s, increasing to 0.27 mm/yr in the middle and late 1990s.[67]
Greenland
In 2004 Rignot et al. estimated a contribution of 0.04 ± 0.01 mm/yr to sea level rise from South East Greenland.[69] In the same year, Krabill et al. estimate a net contribution from Greenland to be at least 0.13 mm/yr in the 1990s.[70] Joughin et al. have measured a doubling of the speed of Jakobshavn Isbræ between 1997 and 2003.[71] This is Greenland's largest outlet glacier; it drains 6.5% of the ice sheet, and is thought to be responsible for increasing the rate of sea-level rise by about 0.06 millimetres per year, or roughly 4% of the 20th-century rate of sea-level increase.[72] In 2004, Rignot et al. estimated a contribution of 0.04±0.01 mm/yr to sea-level rise from southeast Greenland.[69]
Rignot and Kanagaratnam produced a comprehensive study and map of the outlet glaciers and basins of Greenland.[73] They found widespread glacial acceleration below 66 N in 1996 which spread to 70 N by 2005; and that the ice sheet loss rate in that decade increased from 90 to 200 cubic km/yr; this corresponds to an extra 0.25–0.55 mm/yr of sea level rise.
In July 2005 it was reported that the Kangerlussuaq Glacier, on Greenland's east coast, was moving towards the sea three times faster than a decade earlier. Kangerdlugssuaq is around 1,000 m thick, 7.2 km (4.5 miles) wide, and drains about 4% of the ice from the Greenland ice sheet.[74] Measurements of Kangerdlugssuaq in 1988 and 1996 showed it moving at between 5 and 6 km/yr (3.1–3.7 miles/yr), while in 2005 that speed had increased to 14 km/yr (8.7 miles/yr).
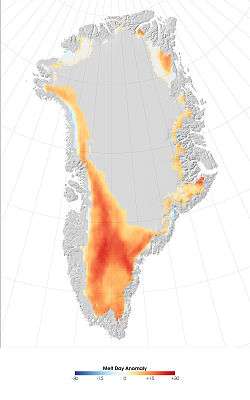
According to the 2004 Arctic Climate Impact Assessment, climate models project that local warming in Greenland will exceed 3 °C during this century. Also, ice-sheet models project that such a warming would initiate the long-term melting of the ice sheet, leading to a complete melting of the Greenland ice sheet over several millennia, resulting in a global sea level rise of about seven metres.[75]
Subsidence and effective sea level rise
Many ports, urban conglomerations, and agricultural regions are built on river deltas, where subsidence contributes to a substantial increase in effective sea level rise. This is caused by both unsustainable extraction of groundwater (in some place also by extraction of oil and gas), and by levees and other flood management practices that prevent accumulation of sediments to compensate for the natural settling of deltaic soils.[76] In many deltas this results in subsidence ranging from several millimeters per year up to possibly 25 centimeters per year in parts of the Ciliwung delta (Jakarta).[77] Total anthropogenic-caused subsidence in the Rhine-Meuse-Scheldt delta (Netherlands) is estimated at 3 to 4 meters, over nine meters in the Sacramento-San Joaquin River Delta, and over ten feet in urban areas of the Mississippi River Delta (New Orleans).[78]
Effects


The IPCC TAR WGII report (Impacts, Adaptation Vulnerability) notes that current and future climate change would be expected to have a number of impacts, particularly on coastal systems.[79] Such impacts may include increased coastal erosion, higher storm-surge flooding, inhibition of primary production processes, more extensive coastal inundation, changes in surface water quality and groundwater characteristics, increased loss of property and coastal habitats, increased flood risk and potential loss of life, loss of non-monetary cultural resources and values, impacts on agriculture and aquaculture through decline in soil and water quality, and loss of tourism, recreation, and transportation functions.
There is an implication that many of these impacts will be detrimental—especially for the three-quarters of the world's poor who depend on agriculture systems.[80] The report does, however, note that owing to the great diversity of coastal environments; regional and local differences in projected relative sea level and climate changes; and differences in the resilience and adaptive capacity of ecosystems, sectors, and countries, the impacts will be highly variable in time and space.
The IPCC report of 2007 estimated that accelerated melting of the Himalayan ice caps and the resulting rise in sea levels would likely increase the severity of flooding in the short term during the rainy season and greatly magnify the impact of tidal storm surges during the cyclone season. A sea-level rise of just 400 mm in the Bay of Bengal would put 11 percent of the Bangladesh's coastal land underwater, creating 7–10 million climate refugees.
Sea level rise could also displace many shore-based populations: for example it is estimated that a sea level rise of just 200 mm could make 740,000 people in Nigeria homeless.[81]
Future sea-level rise, like the recent rise, is not expected to be globally uniform. Some regions show a sea-level rise substantially more than the global average (in many cases of more than twice the average), and others a sea level fall.[82] However, models disagree as to the likely pattern of sea level change.[83]
Island nations
IPCC assessments suggest that deltas and small island states are particularly vulnerable to sea-level rise caused by both thermal expansion and increased ocean water. Sea level changes have not yet been conclusively proven to have directly resulted in environmental, humanitarian, or economic losses to small island states, but the IPCC and other bodies have found this a serious risk scenario in coming decades.[84]
Maldives, Tuvalu, and other low-lying countries are among the areas that are at the highest level of risk. The UN's environmental panel has warned that, at current rates, sea level would be high enough to make the Maldives uninhabitable by 2100.[85][86]
Many media reports have focused on the island nations of the Pacific, notably the Polynesian islands of Tuvalu, which based on more severe flooding events in recent years, were thought to be "sinking" due to sea level rise.[87] A scientific review in 2000 reported that based on University of Hawaii gauge data, Tuvalu had experienced a negligible increase in sea level of 0.07 mm a year over the past two decades, and that the El Niño Southern Oscillation (ENSO) had been a larger factor in Tuvalu's higher tides in recent years.[88] A subsequent study by John Hunter from the University of Tasmania, however, adjusted for ENSO effects and the movement of the gauge (which was thought to be sinking). Hunter concluded that Tuvalu had been experiencing sea-level rise of about 1.2 mm per year.[88][89] The recent more frequent flooding in Tuvalu may also be due to an erosional loss of land during and following the actions of 1997 cyclones Gavin, Hina, and Keli.[90]
In 2016 it was reported that five of the Solomon Islands had disappeared due to the combined effects of sea level rise and stronger trade winds that were pushing water into the Western Pacific.[91]
Besides the issues that flooding brings, such as soil salinisation, the island states themselves would also become dissolved over time, as the islands become uninhabitable or completely submerged by the sea. Once this happens, all rights on the surrounding area (sea) are removed. This area can be huge as rights extend to a radius of 224 nautical miles (414 km) around the entire island state. Any resources, such as fossil oil, minerals and metals, within this area can be freely dug up by anyone and sold without needing to pay any commission to the (now dissolved) island state.[92]
Options that have been proposed to assist island nations to adapt to rising sea level include abandoning islands, building dikes, and building upwards.[93]
Cities
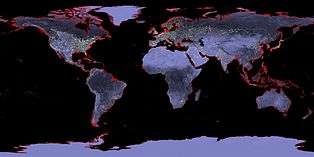
A study in the April, 2007 issue of Environment and Urbanization reports that 634 million people live in coastal areas within 30 feet (9.1 m) of sea level. The study also reported that about two thirds of the world's cities with over five million people are located in these low-lying coastal areas. Future sea level rise could lead to potentially catastrophic difficulties for shore-based communities in the next centuries: for example, many major cities such as Venice, London, New Orleans, and New York City already need storm-surge defenses, and would need more if the sea level rose, though they also face issues such as subsidence.[94][95] However, modest increases in sea level are likely to be offset when cities adapt by constructing sea walls or through relocating.[96]
Re-insurance company Swiss Re estimates an economic loss for southeast Florida in 2030, of $33 billion from climate-related damages.[97][98] Miami has been listed as "the number-one most vulnerable city worldwide" in terms of potential damage to property from storm-related flooding and sea-level rise.[99]
Habitats
Coastal and Polar habitats are facing drastic changes as consequence of rising sea levels. Loss of ice in the Arctic may force local species to migrate in search of a new home. If seawater continues to approach inland, problems related to contaminated soils and flooded wetlands may occur. Also, fish, birds, and coastal plants could lose parts of their habitat.[100] In 2016 it was reported that the Bramble Cay melomys, which lived on a Great Barrier Reef island, had probably become extinct because of sea level rises.[101]
Extreme sea level rise events
Downturn of Atlantic meridional overturning circulation (AMOC), has been tied to extreme regional sea level rise (1-in-850 year event). Between 2009–2010, coastal sea levels north of New York City increased by 128 mm within two years. This jump is unprecedented in the tide gauge records, which collects data since a couple of centuries.[102][103]
Sea level measurement
Satellites


In 1992 the TOPEX/Poseidon satellite was launched to record the change in sea level.[104] Current rates of sea level rise from satellite altimetry have been estimated in the range of 2.9–3.4 ± 0.4–0.6 mm per year for 1993–2010.[105][106][107][108][109][109] This exceeds those from tide gauges. It is unclear whether this represents an increase over the last decades; variability; true differences between satellites and tide gauges; or problems with satellite calibration.[110] Due to calibration errors of the first satellite – Topex/Poseidon, sea levels have been slightly overestimated until 2015, which resulted in masking of ongoing sea level rise acceleration.[111]
Tide gauge
Amsterdam
The longest running sea-level measurements, NAP or Amsterdam Ordnance Datum established in 1675, are recorded in Amsterdam, the Netherlands. About 25 percent of the Netherlands lies beneath sea level, while more than 50 percent of this nation's area would be inundated by temporary floods if it did not have an extensive levee system, see Flood control in the Netherlands.[112]
Australia
In Australia, data collected by the Commonwealth Scientific and Industrial Research Organisation (CSIRO) show the current global mean sea level trend to be 3.2 mm/yr.,[113] a doubling of the rate of the total increase of about 210mm that was measured from 1880 to 2009, which reflected an average annual rise over the entire 129-year period of about 1.6 mm/year.[114]
Australian record collection has a long time horizon, including measurements by an amateur meteorologist beginning in 1837 and measurements taken from a sea-level benchmark struck on a small cliff on the Isle of the Dead[115] near the Port Arthur convict settlement on 1 July 1841. These records, when compared with data recorded by modern tide gauges, reinforce the recent comparisons of the historic sea level rise of about 1.6 mm/year, with the sharp acceleration in recent decades.[116]
Continuing extensive sea level data collection by Australia's (CSIRO) is summarized in in its finding of mean sea level trend to be 3.2 mm/yr. As of 2003 the National Tidal Centre of the Bureau of Meteorology managed 32 tide gauges covering the entire Australian coastline, with some measurements available starting in 1880.[117]
United States

Tide gauges in the United States reveal considerable variation because some land areas are rising and some are sinking. For example, over the past 100 years, the rate of sea level rise varied from about an increase of 0.36 inches (9.1 mm) per year along the Louisiana Coast (due to land sinking), to a drop of a few inches per decade in parts of Alaska (due to post-glacial rebound). The rate of sea level rise increased during the 1993–2003 period compared with the longer-term average (1961–2003), although it is unclear whether the faster rate reflected a short-term variation or an increase in the long-term trend.[118]
One study showed no acceleration in sea level rise in US tide gauge records during the 20th century.[119] However, another study found that the rate of rise for the US Atlantic coast during the 20th century was far higher than during the previous two thousand years.[120]
Adaptation
In 2008, the Dutch Delta Commission (Deltacommissie), advised in a report that the Netherlands would need a massive new building program to strengthen the country's water defenses against the anticipated effects of global warming for the next 190 years. This commission was created in September 2007, after the damage caused by Hurricane Katrina prompted reflection and preparations. Those included drawing up worst-case plans for evacuations. The plan included more than €100 billion (US$144 bn), in new spending through the year 2100 to take measures, such as broadening coastal dunes and strengthening sea and river dikes. The commission said the country must plan for a rise in the North Sea up to 1.3 metres (4 ft 3 in) by 2100, rather than the previously projected 0.80 metres (2 ft 7 in), and plan for a 2–4 metre (6.5–13 feet) rise by 2200.[121]
The New York City Panel on Climate Change (NPCC), is an effort to prepare the New York City area for climate change.
Miami Beach is spending $500 million in the next years to address sea-level rise. Actions include a pump drainage system, and to raise roadways and sidewalks.[122]
See also
- Carbon cycle
- Coastal development
- Coastal sediment supply
- Cold blob (North Atlantic)
- Effects of global warming on oceans
- Effects of climate change on island nations
- Hydrosphere
- Islands First
- Marine transgression
- Standard sea level
Notes
- ↑ "Climate Change Indicators in the United States: Sea level". United States Environmental Protection Agency. May 2014.
- ↑ "Why the U.S. East Coast could be a major 'hotspot' for rising seas". The Washington Post. 2016.
- ↑ http://ngm.nationalgeographic.com/2013/09/rising-seas/if-ice-melted-map
- ↑ Christopher S. Watson, Neil J. White, John A. Church, Matt A. King, Reed J. Burgette & Benoit Legresy (11 May 2015). "Unabated global mean sea-level rise over the satellite altimeter era". Nature Climate Change. 5: 565–568. doi:10.1038/nclimate2635.
- ↑ Nicholls, Robert J.; Cazenave, Anny (18 June 2010). "Sea-Level Sea-Level Rise and Its Impact on Coastal Zones". Science Magazine. 328 (5985): 1517–1520. Bibcode:2010Sci...328.1517N. doi:10.1126/science.1185782.
- ↑ Solomon et al., Technical Summary, Section 3.4 Consistency Among Observations, in IPCC AR4 WG1 2007; Hegerl et al., Executive summary, Section 1.3: Consistency of changes in physical and biological systems with warming, in IPCC AR4 SYR 2007.
- ↑ USGCRP, Inter-agency Collaboration (2014). "Climate Change Impacts in the United States: The Third National Climate Assessment" (PDF). National Climate Assessment. 3rd Assessment: pg. 45. Retrieved 12 December 2015.
- ↑ Hegerl et al., Chapter 9: Understanding and Attributing Climate Change, in IPCC AR4 WG1 2007.
- ↑ "Sea Level Change - Chapter 13" (pdf). IPCC. 2013.
- ↑ Bindoff, N.L., J. Willebrand, V. Artale, A, Cazenave, J. Gregory, S. Gulev, K. Hanawa, C. Le Quéré, S. Levitus, Y. Nojiri, C.K. Shum, L.D. Talley and A. Unnikrishnan (2007), "Section 5.5.1: Introductory Remarks", in IPCC AR4 WG1 2007, Chapter 5: Observations: Ocean Climate Change and Sea Level, ISBN 978-0-521-88009-1
- ↑ Fischlin; et al., "Section 4.4.9: Oceans and shallow seas – Impacts", in IPCC AR4 WG2 2007, Chapter 4: Ecosystems, their Properties, Goods and Services, p. 234
- 1 2 America's Climate Choices: Panel on Advancing the Science of Climate Change, Board on Atmospheric Sciences and Climate, Division on Earth and Life Studies, NATIONAL RESEARCH COUNCIL OF THE NATIONAL ACADEMIES (2010). "7 Sea Level Rise and the Coastal Environment". Advancing the Science of Climate Change. Washington, D.C.: The National Academies Press. p. 245. ISBN 978-0-309-14588-6. Retrieved 2011-06-17. External link in
|publisher=(help) - ↑ Anders Levermann, Peter U. Clark, Ben Marzeion, Glenn A. Milne, David Pollard, Valentina Radic, and Alexander Robinson (13 June 2013). "The multimillennial sea-level commitment of global warming". PNAS. 110: 13745–13750. doi:10.1073/pnas.1219414110.
- ↑ Cuts in some greenhouse gases could slow sea level rise; "Methane, ozone and other short-lived pollutants have a big impact on ocean heights" April 12, 2013 Vol.183 #9 Science News
- ↑ doi:10.1038/nclimate1869
- ↑ IPCC, FAQ 5.1: Is Sea Level Rising?, in IPCC AR4 WG1 2007.
- ↑ Albritton et al., Technical Summary, Box 2: What causes sea level to change?, in IPCC TAR WG1 2001.
- ↑ IPCC, Summary for Policymakers, Section C. Current knowledge about future impacts – Magnitudes of impact in IPCC AR4 WG2 2007.
- ↑ Gornitz, Vivien (January 2007). "Sea Level Rise, After the Ice Melted and Today". Goddard Institute for Space Studies. Retrieved 10 September 2015.
- 1 2 Cronin, T. M. (2012) Invited review: Rapid sea-level rise. Quaternary Science Reviews. 56:11-30.
- 1 2 Blanchon, P. (2011a) Meltwater Pulses. In: Hopley, D. (Ed), Encyclopedia of Modern Coral Reefs: Structure, form and process. Springer-Verlag Earth Science Series, p. 683-690. ISBN 978-90-481-2638-5
- ↑ Blanchon, P. (2011b) Backstepping. In: Hopley, D. (Ed), Encyclopedia of Modern Coral Reefs: Structure, form and process. Springer-Verlag Earth Science Series, p. 77-84. ISBN 978-90-481-2638-5
- 1 2 Blanchon, P., and Shaw, J. (1995) Reef drowning during the last deglaciation: evidence for catastrophic sea-level rise and icesheet collapse. Geology, 23:4–8.
- ↑ GILLIS, JUSTIN (22 February 2016). "Seas Are Rising at Fastest Rate in Last 28 Centuries". New York Times. Retrieved 29 February 2016.
- ↑ Jevrejeva, Svetlana; J. C. Moore; A. Grinsted; P. L. Woodworth (April 2008). "Recent global sea level acceleration started over 200 years ago?". Geophysical Research Letters. 35 (8). Bibcode:2008GeoRL..35.8715J. doi:10.1029/2008GL033611.
- ↑ Bindoff et al., Chapter 5: Observations: Oceanic Climate Change and Sea Level, Executive summary, in IPCC AR4 WG1 2007.
- ↑ BAART, F.; VAN GELDER, P.H.A.J.M.; DE RONDE, J.; VAN KONINGSVELD, M., & WOUTERS, B. (September 20, 2011). "The effect of the 18.6-year lunar nodal cycle on regional sea-level rise estimates".
- ↑ Anisimov et al., Chapter 11: Changes in Sea Level, Table 11.9, in IPCC TAR WG1 2001.
- ↑ NASA (8 December 2011). "Paleoclimate Record Points Toward Potential Rapid Climate Changes".
- ↑ "Ice sheets may be more resilient than thought, say Stanford scientists". Stanford University. 2015.
- 1 2
 This article incorporates public domain material from the NOAA document: NOAA GFDL, Geophysical Fluid Dynamics Laboratory - Climate Impact of Quadrupling CO2, Princeton, NJ, USA: NOAA GFDL
 - ↑ Karl, TR; et al., eds. (2009). Global Climate Change Impacts in the United States. 32 Avenue of the Americas, New York, NY 10013-2473, USA: Cambridge University Press. pp. 22–24. ISBN 978-0-521-14407-0. Retrieved 2011-04-28.
- ↑ IPCC AR4, Glossary P-Z: "Projection", in IPCC AR4 WG1 2007.
- ↑ Morita et al., Chap. 2: Greenhouse Gas Emission Mitigation Scenarios and Implications, Section 2.2.1: Introduction to Scenarios, in IPCC TAR WG3 2001.
- ↑ IPCC, Topic 3, Section 3.2.1: 21st century global changes, p. 45, in IPCC AR4 SYR 2007.
- 1 2 J E Hansen (2007). "Scientific reticence and sea level rise". Environmental Research Letters. IOPScience. 2: 024002. doi:10.1088/1748-9326/2/2/024002.
- ↑ Allison; et al. (2009). "The Copenhagen Diagnosis, 2009: Updating the World on the Latest Climate Science".
- 1 2 America's Climate Choices: Panel on Advancing the Science of Climate Change, Board on Atmospheric Sciences and Climate, Division on Earth and Life Studies, NATIONAL RESEARCH COUNCIL OF THE NATIONAL ACADEMIES (2010). "7 Sea Level Rise and the Coastal Environment". Advancing the Science of Climate Change. Washington, D.C.: The National Academies Press. pp. 243–250. ISBN 978-0-309-14588-6. Retrieved 2011-06-17.
(From pg 250) Even if sea-level rise were to remain in the conservative range projected by the IPCC (0.6–1.9 feet [0.18–0.59 m])—not considering potentially much larger increases due to rapid decay of the Greenland or West Antarctic ice sheets—tens of millions of people worldwide would become vulnerable to flooding due to sea-level rise over the next 50 years (Nicholls, 2004; Nicholls and Tol, 2006). This is especially true in densely populated, low-lying areas with limited ability to erect or establish protective measures. In the United States, the high end of the conservative IPCC estimate would result in the loss of a large portion of the nation's remaining coastal wetlands. The impact on the east and Gulf coasts of the United States of 3.3 feet (1 m) of sea-level rise, which is well within the range of more recent projections for the 21st century (e.g., Pfeffer et al., 2008; Vermeer and Rahmstorf, 2009), is shown in pink in Figure 7.7. Also shown, in red, is the effect of 19.8 feet (6 m) of sea-level rise, which could occur over the next several centuries if warming were to continue unabated.
External link in|publisher=(help) - ↑ Rignot E.; I. Velicogna, M. R. van den Broeke, A. Monaghan, and J. Lenaerts (2011). "Acceleration of the contribution of the Greenland and Antarctic ice sheets to sea level rise". Geophysical Research Letters. 38 (5). Bibcode:2011GeoRL..3805503R. doi:10.1029/2011GL046583.
Considerable disparity remains between these estimates due to the inherent uncertainties of each method, the lack of detailed comparison between independent estimates, and the effect of temporal modulations in ice sheet surface mass balance. Here, we present a consistent record of mass balance for the Greenland and Antarctic ice sheets over the past two decades, validated by the comparison of two independent techniques over the past eight years: one differencing perimeter loss from net accumulation, and one using a dense time series of timevariable gravity. We find excellent agreement between the two techniques for absolute mass loss and acceleration of mass loss.
Cite uses deprecated parameter|coauthors=(help) - ↑ Romm, Joe (10 Mar 2011). "JPL bombshell: Polar ice sheet mass loss is speeding up, on pace for 1 foot sea level rise by 2050". Climate Progress. Center for American Progress Action Fund. Retrieved 16 April 2012.
- ↑ Churchs, John; Clark, Peter. "Chapter 13: Sea Level Change - Final Draft Underlying Scientific-Technical Assessment" (PDF). http://www.climatechange2013.org/. IPCC Working Group I. Retrieved January 21, 2015. External link in
|website=(help) - ↑ "Sea Level Rise Key Message Third National Climate Assessment". National Climate Assessment. Retrieved 25 June 2014.
- ↑ J. Hansen, M. Sato, P. Hearty, R. Ruedy, M. Kelley, V. Masson-Delmotte, G. Russell, G. Tselioudis, J. Cao, E. Rignot, I. Velicogna, E. Kandiano, K. von Schuckmann, P. Kharecha, A. N. Legrande , M. Bauer, and K.-W. Lo (2015). "Ice melt, sea level rise and superstorms: evidence from paleoclimate data, climate modeling, and modern observations that 2◦C global warming is highly dangerous" (PDF). Atmospheric Chemistry and Physics (ACP). 15: 20059–20179. doi:10.5194/acpd-15-20059-2015.
- ↑ "James Hansen's controversial sea level rise paper has now been published online". Washington Post. 2015.
- ↑ IPCC AR4, Summary for Policymakers, Section C. Current knowledge about future impacts – Magnitudes of impact in IPCC AR4 WG2 2007
- ↑ IPCC AR4, Summary for Policymakers, Endbox 2. Communication of Uncertainty, in IPCC AR4 WG2 2007
- ↑ "Scientists say Antarctic melting could double sea level rise. Here's what that looks like.".
- ↑ U.S. Climate Change Science Program: Synthesis and Assessment Report 3.4: Abrupt Climate Change: Summary and Findings (PDF). Reston, VA: US Geological Survey. 2008. p. 2. Retrieved 2010-08-20.
- ↑ Skeptical Science: Is Greenland gaining or losing ice?
- ↑ Sea level rise overflowing estimates; Feedback mechanisms are speeding up ice melt November 8, 2012 Science News
- ↑ Velicogna, I. (2009). "Increasing rates of ice mass loss from the Greenland and Antarctic ice sheets revealed by GRACE". Geophysical Research Letters. 36 (19). Bibcode:2009GeoRL..3619503V. doi:10.1029/2009GL040222.
- ↑ "NASA Mission Takes Stock of Earth's Melting Land Ice". NASA/JPL-Caltech/University of Colorado. NASA. February 2012. Retrieved 25 April 2013.
- ↑ Anisimov et al., Section 11.2.1.2: Models of thermal expansion, Table 1.3, in IPCC TAR WG1 2001.
- ↑ Anisimov et al., Chapter 11. Changes in Sea Level, Section 11.2.1.2: Models of thermal expansion, Table 1.3, in IPCC TAR WG1 2001.
- ↑ Zwally H.J.; et al. (2002). "Surface Melt-Induced Acceleration of Greenland Ice-Sheet Flow". Science. 297 (5579): 218–222. Bibcode:2002Sci...297..218Z. doi:10.1126/science.1072708. PMID 12052902.
- ↑ "Greenland Ice Sheet flows faster during summer melting". Goddard Space Flight Center (press release). 2006-06-02.
- ↑ Rignot, E; Thomas (2002). "Mass Balance of Polar Ice Sheets". Science. 297 (5586): 1502–1506. Bibcode:2002Sci...297.1502R. doi:10.1126/science.1073888. PMID 12202817. Cite uses deprecated parameter
|coauthors=(help) - ↑ Davis, Curt H.; Yonghong Li, Joseph R. McConnell, Markus M. Frey, Edward Hanna (24 June 2005). "Snowfall-Driven Growth in East Antarctic Ice Sheet Mitigates Recent Sea-Level Rise". Science. 308 (5730): 1898–1901. Bibcode:2005Sci...308.1898D. doi:10.1126/science.1110662. PMID 15905362. Cite uses deprecated parameter
|coauthors=(help) - ↑ "How Stuff Works: polar ice caps". howstuffworks.com. Retrieved 2006-02-12.
- ↑ Sheperd et al 2012 A Reconciled Estimate of Ice-Sheet Mass Balance
- 1 2 Shepherd, A.; Wingham, D. (2007). "Recent Sea-Level Contributions of the Antarctic and Greenland Ice Sheets". Science. 315 (5818): 1529–1532. doi:10.1126/science.1136776. PMID 17363663.
- 1 2 3 Rignot, E.; Bamber, J. L.; Van Den Broeke, M. R.; Davis, C.; Li, Y.; Van De Berg, W. J.; Van Meijgaard, E. (2008). "Recent Antarctic ice mass loss from radar interferometry and regional climate modelling". Nature Geoscience. 1 (2): 106–110. Bibcode:2008NatGe...1..106R. doi:10.1038/ngeo102.
- ↑ Chen, J. L.; Wilson, C. R.; Tapley, B. D.; Blankenship, D.; Young, D. (2008). "Antarctic regional ice loss rates from GRACE". Earth and Planetary Science Letters. 266 (1–2): 140–148. Bibcode:2008E&PSL.266..140C. doi:10.1016/j.epsl.2007.10.057.
- ↑ Thomas, R; et al. (2004). "Accelerated Sea-Level Rise from West Antarctica". Science. 306 (5694): 255–258. Bibcode:2004Sci...306..255T. doi:10.1126/science.1099650. PMID 15388895.
- ↑ Bamber J.L.; Riva R.E.M.; Vermeersen B.L.A.; LeBroq A.M. (2009). "Reassessment of the potential sea-level rise from a collapse of the West Antarctic Ice Sheet". Science. 324 (5929): 901–3. Bibcode:2009Sci...324..901B. doi:10.1126/science.1169335. PMID 19443778.
- ↑ Dyurgerov, Mark. 2002. Glacier Mass Balance and Regime: Data of Measurements and Analysis. INSTAAR Occasional Paper No. 55, ed. M. Meier and R. Armstrong. Boulder, CO: Institute of Arctic and Alpine Research, University of Colorado. Distributed by National Snow and Ice Data Center, Boulder, CO. A shorter discussion is at
- ↑ Arendt, AA; et al. (July 2002). "Rapid Wastage of Alaska Glaciers and Their Contribution to Rising Sea Level". Science. 297 (5580): 382–386. Bibcode:2002Sci...297..382A. doi:10.1126/science.1072497. PMID 12130781.
- ↑ Earth Observatory (2009) Melting Anomalies in Greenland in 2007
- 1 2 Rignot, E.; et al. (2004). "Rapid ice discharge from southeast Greenland glaciers". Geophysical Research Letters. 31 (10): L10401. Bibcode:2004GeoRL..3110401R. doi:10.1029/2004GL019474.
- ↑ Krabill, W; et al. (21 July 2000). "Greenland Ice Sheet: High-Elevation Balance and Peripheral Thinning". Science. 289 (5478): 428–430. Bibcode:2000Sci...289..428K. doi:10.1126/science.289.5478.428. PMID 10903198.
- ↑ Joughin, I; et al. (December 2004). "Large fluctuations in speed on Greenland's Jakobshavn Isbræ glacier". Nature. 432 (7017): 608–610. Bibcode:2004Natur.432..608J. doi:10.1038/nature03130. PMID 15577906.
- ↑ Report shows movement of glacier has doubled speed | SpaceRef – Your Space Reference
- ↑ Rignot, E; Kanagaratnam (2006). "Changes in the Velocity Structure of the Greenland Ice Sheet". Science. 311 (5763): 986–90. Bibcode:2006Sci...311..986R. doi:10.1126/science.1121381. PMID 16484490. Cite uses deprecated parameter
|coauthors=(help) - ↑ Connor, Steve (2005-07-25). "Melting Greenland glacier may hasten rise in sea level". The Independent. London. Retrieved 2010-04-30.
- ↑ http://umcca.um.edu.my/glex2308/micellaneous/The%20Role%20Sea%20Ice%20in%20Dangerous%20Climate%20Change.pdf
- ↑ Bucx et al. 2010, p. 88;Tessler et al. 2015, p. 638
- ↑ Bucx et al. 2010, p. 81
- ↑ Bucx et al. 2010, pp. 81, 88,90
- ↑ IPCC TAR WG1 2001.
- ↑ "Climate Shocks: Risk and Vulnerability in an Unequal World." Human Development report 2007/2008. hdr.undp.org/media/hdr_20072008_summary_english.pdf
- ↑ Klaus Paehler. "Nigeria in the Dilemma of Climate Change". Retrieved 2008-11-04.
- ↑ ??, in IPCC TAR WG1 2001.
- ↑ Fig. 11?, in IPCC TAR WG1 2001.
- ↑ The Future Oceans – Warming Up, Rising High, Turning Sour
- ↑ Megan Angelo (1 May 2009). "Honey, I Sunk the Maldives: Environmental changes could wipe out some of the world's most well-known travel destinations".
- ↑ Kristina Stefanova (19 April 2009). "Climate refugees in Pacific flee rising sea".
- ↑ Levine, Mark (December 2002). "Tuvalu Toodle-oo". Outside Magazine. Retrieved 2005-12-19.
- 1 2 Patel, Samir S. (April 5, 2006). "A Sinking Feeling". Nature. Retrieved 2007-11-15.
- ↑ Hunter, J.A. (August 12, 2002). "A Note on Relative Sea Level Rise at Funafuti, Tuvalu" (PDF).
- ↑ Field, Michael J. (December 2001). "Sea Levels Are Rising". Pacific Magazine. Archived from the original on 2005-12-18. Retrieved 2005-12-19.
- ↑ Klein, Alice. "Five Pacific islands vanish from sight as sea levels rise". New Scientist. Retrieved 2016-05-09.
- ↑ Alfred Henry Adriaan Soons (1989). Zeegrenzen en zeespiegelrijzing : volkenrechtelijke beschouwingen over de effecten van het stijgen van de zeespiegel op grenzen in zee : rede, uitgesproken bij de aanvaarding van het ambt van hoogleraar in het volkenrecht aan de Rijksuniversiteit te Utrecht op donderdag 13 april 1989 [Sea borders and rising sea levels: international law considerations about the effects of rising sea levels on borders at sea: speech, pronounced with the acceptance of the post of professor in international law at the University of Utrecht on 13 April 1989] (in Dutch). Kluwers. ISBN 978-90-268-1925-4.
- ↑ "Policy Implications of Sea Level Rise: The Case of the Maldives". Proceedings of the Small Island States Conference on Sea Level Rise. November 14–18, 1989. Malé, Republic of Maldives. Edited by Hussein Shihab. Retrieved 2007-01-12.
- ↑ Jacobson, Rebecca. "Engineers Consider Barriers to Protect New York From Another Sandy". PBS. Retrieved 26 November 2012.
- ↑ ??, in IPCC TAR WG1 2001.
- ↑ "IPCC's New Estimates for Increased Sea-Level Rise". Yale. 2013.
- ↑ "Sea rise threatens Florida coast, but no statewide plan". Yahoo. 10 May 2015.
- ↑ "Climate Change and resilience building: a reinsurer's perspective" (pdf). Miamidade.gov. 2014.
- ↑ Jeff Goodell (June 20, 2013). "Goodbye, Miami". Rolling Stone. Retrieved June 21, 2013.
The Organization for Economic Co-operation and Development lists Miami as the number-one most vulnerable city worldwide in terms of property damage, with more than $416 billion in assets at risk to storm-related flooding and sea-level rise.
- ↑ "Sea Level Rise" National Geographic.
- ↑ Smith, Lauren (2016-06-15). "Extinct: Bramble Cay melomys". Australian Geographic. Retrieved 2016-06-17.
- ↑ Jianjun Yin & Stephen Griffies (March 25, 2015). "Extreme sea level rise event linked to AMOC downturn". CLIVAR.
- ↑ Paul B. Goddard, Jianjun Yin, Stephen M. Griffies & Shaoqing Zhang (24 February 2015). "An extreme event of sea-level rise along the Northeast coast of North America in 2009–2010". Nature. 6: 6346. doi:10.1038/ncomms7346.
- ↑ "Ocean Surface Topography from Space". NASA/JPL.
- ↑ Nerem; R. S.; et al. (2010). "Estimating Mean Sea Level Change from the TOPEX and Jason Altimeter Missions". Marine Geodesy. 33: 435–446. doi:10.1080/01490419.2010.491031.
- ↑ CUSLRG (2011-07-19). "2011_rel2: Global Mean Sea Level Time Series (seasonal signals removed)". CU Sea Level Research Group (CUSLRG). Colorado Center for Astrodynamics Research at the University of Colorado at Boulder. Retrieved 2011-02-10.
- ↑ CNES/CLS (2011). "AVISO Global Mean Sea Level Estimate". Centre National d'Etudes Spatiales/Collecte Localisation Satellites (CNES/CLS): Archiving, Validation and Interpretation of Satellite Oceanographic data (AVISO). Retrieved 2011-07-29.
- ↑ White, N. (2011-07-29). "CSIRO Global Mean Sea Level Estimate". Commonwealth Scientific and Industrial Research Organisation (CSIRO) / Wealth from Oceans National Research Flagship and the Antarctic Climate and Ecosystems Cooperative Research Centre (ACE CRC). Retrieved 2011-07-29.
- 1 2 LSA (2011-03-16). "Laboratory for Satellite Altimetry / Sea level rise". NOAA: National Environmental Satellite, Data, and Information Service (NESDIS), Satellite Oceanography and Climatology Division, Laboratory for Satellite Altimetry (LSA). Retrieved 2011-07-29.
- ↑ IPCC AR3. "Mean sea level change from satellite altimeter observations".
- ↑ Michael Le Page (11 May 2015). "Apparent slowing of sea level rise is artefact of satellite data".
- ↑ "Other Long Records not in the PSMSL Data Set". PSMSL. Retrieved 11 May 2015.
- ↑ "Historical Sea Level Changes". CSIRO. Retrieved 25 April 2013.
- ↑ Neil, White. "Historical Sea Level Changes". CSIRO. Retrieved 25 April 2013.
- ↑ Hunter, John; R. Coleman; D. Pugh (April 2003). "The Sea Level at Port Arthur, Tasmania, from 1841 to the Present". Geophysical Research Letters. 30 (7). Bibcode:2003GeoRL..30.1401H. doi:10.1029/2002GL016813.
- ↑ "Landmark study confirms rising Australian sea level" (PDF) (Press release). CSIRO Marine and Atmospheric Research. 2003-01-23. Retrieved 2012-07-19.
- ↑ National Tidal Centre (2003). "Australian Mean Sea Level Survey" (PDF). Australian Government Bureau of Meteorology. Retrieved 2010-12-18.
- ↑ "Sea Level Changes". United States Environmental Protection Agency. Retrieved Jan 5, 2012.
- ↑ Houston, J. R.; Dean, R. G. (2011). "Sea-Level Acceleration Based on U.S. Tide Gauges and Extensions of Previous Global-Gauge Analyses". Journal of Coastal Research. 27: 409–417. doi:10.2112/JCOASTRES-D-10-00157.1.
- ↑ Kemp, A. C.; Horton, B. P.; Donnelly, J. P.; Mann, M. E.; Vermeer, M.; Rahmstorf, S. (2011). "Climate related sea-level variations over the past two millennia" (PDF). Proceedings of the National Academy of Sciences. 108 (27): 11017–11022. doi:10.1073/pnas.1015619108.
- ↑ "Dutch draw up drastic measures to defend coast against rising seas"
- ↑ "$500 million, 5-year plan to help Miami Beach withstand sea-level rise". 6 April 2015.
References
- Ipcc ar4 wg1 (2007), Solomon, S.; Qin, D.; Manning, M.; Chen, Z.; Marquis, M.; Averyt, K.B.; Tignor, M.; Miller, H.L., eds., Climate Change 2007: The Physical Science Basis, Contribution of Working Group I to the Fourth Assessment Report of the Intergovernmental Panel on Climate Change, Cambridge University Press, ISBN 978-0-521-88009-1 (pb: 978-0-521-70596-7).
- Ipcc ar4 wg2 (2007), Parry, M.L.; Canziani, O.F.; Palutikof, J.P.; van der Linden, P.J.; Hanson, C.E., eds., Climate Change 2007: Impacts, Adaptation and Vulnerability, Contribution of Working Group II to the Fourth Assessment Report of the Intergovernmental Panel on Climate Change, Cambridge University Press, ISBN 978-0-521-88010-7 (pb: 978-0-521-70597-4).
- Ipcc ar4 wg3 (2007), Metz, B.; Davidson, O.R.; Bosch, P.R.; Dave, R.; Meyer, L.A., eds., Climate Change 2007: Mitigation of Climate Change, Contribution of Working Group III to the Fourth Assessment Report of the Intergovernmental Panel on Climate Change, Cambridge University Press, ISBN 978-0-521-88011-4 (pb: 978-0-521-70598-1).
- Ipcc ar4 syr (2007), Core Writing Team; Pachauri, R.K; and Reisinger, A., eds., Climate Change 2007: Synthesis Report, Contribution of Working Groups I, II and III to the Fourth Assessment Report of the Intergovernmental Panel on Climate Change, IPCC, ISBN 92-9169-122-4.
- Ipcc tar wg1 (2001), Houghton, J.T.; Ding, Y.; Griggs, D.J.; Noguer, M.; van der Linden, P.J.; Dai, X.; Maskell, K.; Johnson, C.A., eds., Climate Change 2001: The Scientific Basis, Contribution of Working Group I to the Third Assessment Report of the Intergovernmental Panel on Climate Change, Cambridge University Press, ISBN 0-521-80767-0 (pb: 0-521-01495-6).
- Ipcc tar wg2 (2001), McCarthy, J. J.; Canziani, O. F.; Leary, N. A.; Dokken, D. J.; White, K. S., eds., Climate Change 2001: Impacts, Adaptation and Vulnerability, Contribution of Working Group II to the Third Assessment Report of the Intergovernmental Panel on Climate Change, Cambridge University Press, ISBN 0-521-80768-9 (pb: 0-521-01500-6).
- Ipcc tar wg3 (2001), Metz, B.; Davidson, O.; Swart, R.; Pan, J., eds., Climate Change 2001: Mitigation, Contribution of Working Group III to the Third Assessment Report of the Intergovernmental Panel on Climate Change, Cambridge University Press, ISBN 0-521-80769-7 (pb: 0-521-01502-2).
- Bucx, T.; Marchand, M.; Makaske, A.; van de Guchte, C. (December 2010), Comparative assessment of the vulnerability and resilience of 10 deltas: synthesis report, Delta Alliance report number 1, Delft-Wageningen, The Netherlands: Delta Alliance International, ISBN 978-94-90070-39-7
- Hanson, S.; Nicholls, R.; Ranger, N.; Hallegatte, S.; Corfee-Morlot, J.; Herweijer, C.; Chateau, J. (2011), "A global ranking of port cities with high exposure to climate extremes", Climatic Change, 104 (1): 89–111, doi:10.1007/s10584-010-9977-4
- Tessler, Z. D.; Vörösmarty, C. J.; Grossberg, M.; Gladkova, I.; Aizenman, H.; Syvitski, J. P. M.; Foufoula-Georgiou, E. (7 August 2015), "Profiling risk and sustainability in coastal deltas of the world.", Science, 349 (6248): 638–43, doi:10.1126/science.aab3574
Further reading
- "Sea Level Rise Key Message". Third National Climate Assessment. Retrieved 25 June 2014.
- Byravan, S.; Rajan, S. C. (2010). "The ethical implications of sea-level rise due to climate change". Ethics and International Affairs. 24 (3): 239–60. doi:10.1111/j.1747-7093.2010.00266.x.
- Cazenave, A.; Nerem, R. S. (2004). "Present-day sea level change: Observations and causes". Rev. Geophys. 42 (3): RG3001. Bibcode:2004RvGeo..42.3001C. doi:10.1029/2003RG000139.
- Emery, K.O. & D. G. Aubrey (1991). Sea levels, land levels, and tide gauges. New York: Springer-Verlag. ISBN 0-387-97449-0.
- "Sea Level Variations of the United States 1854–1999" (PDF). NOAA Technical Report NOS CO-OPS 36. Retrieved 20 February 2005.
- Clark, P. U., Mitrovica, J. X., Milne, G. A. & Tamisiea (2002). "Sea-Level Fingerprinting as a Direct Test for the Source of Global Meltwater Pulse 1A". Science. 295 (5564): 2438–2441. Bibcode:2002Sci...296..553B. doi:10.1126/science.1069017. PMID 11896236.
- Eelco J. Rohling, Robert Marsh, Neil C. Wells, Mark Siddall and Neil R. Edwards (2004). "Similar meltwater contributions to glacial sea level changes from Antarctic and northern ice sheets". Nature. 430 (August 26): 1016–1021. Bibcode:2004Natur.430.1016R. doi:10.1038/nature02859. PMID 15329718.
- Walter Munk (2002). "Twentieth century sea level: An enigma". Proceedings of the National Academy of Sciences. 99 (10): 6550–6555. doi:10.1073/pnas.092704599.
- Menefee, Samuel Pyeatt (1991). "Half Seas Over: The Impact of Sea Level Rise on International Law and Policy". U.C.L.A. Journal of Environmental Law & Policy. 9: 175–218.
- Laury Miller & Bruce C. Douglas (2004). "Mass and volume contributions to twentieth-century global sea level rise". Nature. 428 (6981): 406–409. Bibcode:2004Natur.428..406M. doi:10.1038/nature02309. PMID 15042085.
- Bruce C. Douglas & W. Richard Peltier (2002). "The Puzzle of Global Sea-Level Rise". Physics Today. 55 (3): 35–41. Bibcode:2002PhT....55c..35D. doi:10.1063/1.1472392. Archived from the original on 13 February 2005. Retrieved 24 March 2005.
- B. C. Douglas (1992). "Global sea level acceleration". J. Geophys. Res. 7 (c8): 12699. Bibcode:1992JGR....9712699D. doi:10.1029/92JC01133.
- Warrick, R. A., C. L. Provost, M. F. Meier, J. Oerlemans, and P. L. Woodworth (1996). "Changes in sea level". In Houghton, John Theodore. Climate Change 1995: The Science of Climate Change. Cambridge, UK: Cambridge University Press. pp. 359–405. ISBN 0-521-56436-0.
- R. Kwok; J. C. Comiso (2002). "Southern Ocean Climate and Sea Ice Anomalies Associated with the Southern Oscillation" (PDF). Journal of Climate. 15 (5): 487–501. Bibcode:2002JCli...15..487K. doi:10.1175/1520-0442(2002)015<0487:SOCASI>2.0.CO;2. ISSN 1520-0442.
- Colorado Center for Astrodynamics Research, "Mean Sea Level" Accessed December 19, 2005
- Fahnestock, Mark (December 4, 2004), "Report shows movement of glacier has doubled speed", University of New Hampshire press release. Accessed December 19, 2005
- Leuliette, E.W.; R.S. Nerem; G.T. Mitchum (2004). "Calibration of TOPEX/Poseidon and Jason Altimeter Data to Construct a Continuous Record of Mean Sea Level Change". Marine Geodesy. 27 (1–2): 79–94. doi:10.1080/01490410490465193.
- National Snow and Ice Data Center (March 14, 2005), "Is Global Sea Level Rising?". Accessed December 19, 2005
- INQUA commission on Sea Level Changes and Coastal Evolution. "IPCC again". Archived from the original (PDF) on April 16, 2005. Retrieved 2004-07-25.
- Connor, Steve (2005-07-25). "Independent Online Edition". The Independent. London. Retrieved 2005-12-19.
- Maumoon Abdul Gayoom. "Address by his Excellency Mr. Maumoon Abdul Gahoom, President of the Republic of Maldives, at thenineteenth special session of the United Nations General Assembly for the purpose of an overall review and appraisal of theimplementation of agenda 21 – June 24, 1997". Retrieved 2006-01-06.
- Pilkey, Orrin and Robert Young, The Rising Sea, Shearwater, July 2009 ISBN 978-1-59726-191-3
- Douglas, Bruce C. (1995). "Global sea level change: Determination and interpretation". Reviews of Geophysics. 33: 1425–1432. Bibcode:1995RvGeo..33.1425D. doi:10.1029/95RG00355.
External links
| The Wikibook Historical Geology has a page on the topic of: Sea level variations |
- Third National Climate Assessment Sea Level Rise Key Message
- "University of Colorado at Boulder Sea Level Change".
- Incorporating Sea Level Change Scenarios at the Local Level Outlines eight steps a community can take to develop site-appropriate scenarios
- East Coast faces faster sea level rise; Cities from North Carolina to Massachusetts see waters rising more rapidly July 28, 2012; Vol.182 #2 (p. 17) Science News
- Sea Level Rise:Understanding the past – Improving projections for the future
- Providing new homes for climate exiles Sujatha Byravan and Sudhir Chella Rajan, 2006
- New perspectives for the future of the Maldives Nils-Axel Mörner, Michael Tooley, Göran Possnert, 2004
- "Physical Agents of Land Loss: Relative Sea Level". An Overview of Coastal Land Loss: With Emphasis on the Southeastern United States. US Geological Survey. Retrieved 14 February 2005.
- The Global Sea Level Observing System (GLOSS)
- Surgewatch, database for UK flood events
- The Gravity of Glacial Melt. Jerry Mitrovica explains the uneven rise in sea levels as glaciers melt from Harvard Magazine
- Maps that show a rise in sea levels
- Sea Level Rise and Coastal Flooding Impacts (NOAA)
- "Sea Level Trends (NOAA)". tidesandcurrents.noaa.gov. National Oceanic and Atmospheric Administration.
- YouTube
- Earth Under Water - Worldwide Flooding on YouTube
- Six degrees could change the world on YouTube – National Geographic film based on the 2007 book Six Degrees: Our Future on a Hotter Planet
- HD Earth Under Water - Full Documentary on YouTube – Discovery Channel