Saline County, Missouri
| Saline County, Missouri | |
|---|---|
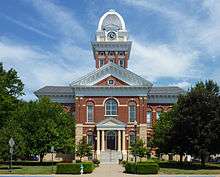 Saline County Courthouse in Marshall | |
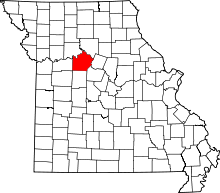 Location in the U.S. state of Missouri | |
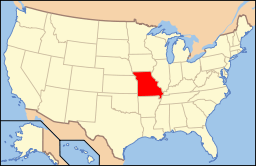 Missouri's location in the U.S. | |
| Founded | November 25, 1820 |
| Named for | The salt springs in the region |
| Seat | Marshall |
| Largest city | Marshall |
| Area | |
| • Total | 767 sq mi (1,987 km2) |
| • Land | 756 sq mi (1,958 km2) |
| • Water | 11 sq mi (28 km2), 1.5% |
| Population (est.) | |
| • (2015) | 23,258 |
| • Density | 31/sq mi (12/km²) |
| Congressional district | 5th |
| Time zone | Central: UTC-6/-5 |
| Website |
www |
Saline County is a county located along the Missouri River in the U.S. state of Missouri. As of the 2010 census, the population was 23,370.[1] Its county seat is Marshall.[2] The county was established November 25, 1820, and named for the region's salt springs.
Settled primarily by migrants from the Upper South during the nineteenth century, this county was in the region bordering the Missouri River known as "Little Dixie". In the antebellum years it had plantations supported by enslaved workers. One-third of the county population was African American at the start of the American Civil War, but their proportion of the residents has declined dramatically to little more than five percent.
Saline County comprises the Marshall, MO Micropolitan Statistical Area.
History
Historically Saline County was occupied for thousands of years by succeeding cultures of Missouri Native Americans. Saline County was organized by European-American settlers on November 25, 1820, and was named from the salinity of the springs found in the region.[3] After periods of conflict as settlers competed for resources and encroached on their territory, the local Native Americans, including the Osage nation, were forced by the US to relocate to reservations in Indian Territory, first in Kansas and then in Oklahoma.
Saline County was among several along the Missouri River that were settled primarily by migrants from the Upper South states of Kentucky, Tennessee and Virginia. The settlers quickly started cultivating crops similar to those in Middle Tennessee and Kentucky: hemp and tobacco; they had brought slave workers with them to central Missouri, or purchased them from slave traders. These counties settled by southerners became known as "Little Dixie." By the time of the Civil War, one-third of the county population was African American; most of them were enslaved laborers on major plantations, particularly for labor-intensive tobacco cultivation. In 1847 the state legislature had prohibited any African Americans from being educated.
After the war, freedmen and other residents had a hunger for education. The state's new constitution established public education for all citizens for the first time.[4] It was segregated, in keeping with local custom. Each township with 20 or more African-American students were supposed to establish a school for them, but rural areas lagged in the number of schools and jurisdictions underfunded those for blacks. By the early 20th century, Saline County had eighteen schools for black students.[5] The remaining black schools from the Jim Crow era have been studied by the State Historic Preservation Office and many are being nominated to the National Register of Historic Places.
Geography
According to the U.S. Census Bureau, the county has a total area of 767 square miles (1,990 km2), of which 756 square miles (1,960 km2) is land and 11 square miles (28 km2) (1.5%) is water.[6] It is located along the Missouri River.
Adjacent counties
- Carroll County (northwest)
- Chariton County (northeast)
- Howard County (east)
- Cooper County (southeast)
- Pettis County (south)
- Lafayette County (west)
Major highways
National protected area
Demographics
The largely rural county reached its peak of population in 1930, and has mostly declined since then. Mechanization of farms meant that fewer workers were needed. African Americans moved to cities for work and better social conditions.
| Historical population | |||
|---|---|---|---|
| Census | Pop. | %± | |
| 1830 | 2,873 | — | |
| 1840 | 5,258 | 83.0% | |
| 1850 | 8,843 | 68.2% | |
| 1860 | 14,699 | 66.2% | |
| 1870 | 21,672 | 47.4% | |
| 1880 | 29,911 | 38.0% | |
| 1890 | 33,762 | 12.9% | |
| 1900 | 33,703 | −0.2% | |
| 1910 | 29,448 | −12.6% | |
| 1920 | 28,817 | −2.1% | |
| 1930 | 30,598 | 6.2% | |
| 1940 | 29,416 | −3.9% | |
| 1950 | 26,694 | −9.3% | |
| 1960 | 25,148 | −5.8% | |
| 1970 | 24,633 | −2.0% | |
| 1980 | 24,919 | 1.2% | |
| 1990 | 23,523 | −5.6% | |
| 2000 | 23,756 | 1.0% | |
| 2010 | 23,370 | −1.6% | |
| Est. 2015 | 23,258 | [7] | −0.5% |
| U.S. Decennial Census[8] 1790-1960[9] 1900-1990[10] 1990-2000[11] 2010-2015[1] | |||
At the 2000 census,[12] there were 23,756 people, 9,015 households and 6,013 families residing in the county. The population density was 31 per square mile (12/km²). There were 10,019 housing units at an average density of 13 per square mile (5/km²). The racial makeup of the county was 90.03% White, 5.39% Black or African American, 0.31% Native American, 0.35% Asian, 0.21% Pacific Islander, 2.09% from other races, and 1.62% from two or more races. Approximately 4.42% of the population were Hispanic or Latino of any race. 28.7% were of German, 18.2% American, 9.8% English and 9.3% Irish ancestry.
There were 9,015 households of which 30.60% had children under the age of 18 living with them, 51.90% were married couples living together, 10.30% had a female householder with no husband present, and 33.30% were non-families. 28.20% of all households were made up of individuals and 14.60% had someone living alone who was 65 years of age or older. The average household size was 2.45 and the average family size was 2.97.
In Age distribution was 24.30% under the age of 18, 12.00% from 18 to 24, 25.20% from 25 to 44, 22.30% from 45 to 64, and 16.30% who were 65 years of age or older. The median age was 37 years. For every 100 females there were 96.10 males. For every 100 females age 18 and over, there were 93.70 males.
The median household income was $32,743, and the median family income was $39,234. Males had a median income of $27,180 versus $19,431 for females. The per capita income for the county was $16,132. About 10.50% of families and 13.20% of the population were below the poverty line, including 18.90% of those under age 18 and 8.60% of those age 65 or over.
Education
Public schools
- Gilliam C-4 School District – Gilliam
- Gilliam Elementary School (K-08)
- Hardeman R-X School District – Marshall
- Hardeman Elementary School (PK-08)
- Malta Bend R-V School District – Malta Bend
- Malta Bend Elementary School (PK-05)
- Malta Bend High School (06-12)
- Marshall School District – Marshall
- Eastwood Elementary School (PK-03)
- Benton Elementary School (K-01)
- Northwest Elementary School (K-04)
- Southeast Elementary School (K-02)
- Bueker Middle School (05-08)
- Marshall High School (09-12)
- Orearville R-IV School District – Slater
- Orearville Elementary School (K-08)
- Slater Public Schools – Slater
- Slater Elementary School (PK-08)
- Slater High School (09-12)
- Sweet Springs R-VII School District – Sweet Springs
- Sweet Springs Elementary School (PK-06)
- Sweet Springs High School (07-12)
Private schools
- Calvary Baptist School – Marshall (PK-10) – Baptist (Alternative School)
- St. Peter Catholic School – Marshall (K-09) – Roman Catholic
Post-secondary
- Missouri Valley College – Marshall – A private, four-year Presbyterian university.
Politics
Local
The Democratic Party predominantly controls politics at the local level in Saline County. Democrats hold all but four of the elected positions in the county.
| Saline County, Missouri | ||||
|---|---|---|---|---|
| Elected countywide officials | ||||
| Assessor | Margaret Pond | Democratic | ||
| Circuit Clerk | Sharon D. Crawford | Democratic | ||
| County Clerk | Debbie Russell | Democratic | ||
| Collector | Cindi A. Sims | Republican | ||
| Commissioner (Presiding) |
Kile Guthrey | Democratic | ||
| Commissioner (District 1) |
Charles Guthrie | Democratic | ||
| Commissioner (District 2) |
Monte Fenner | Democratic | ||
| Coroner | William “Willie” Harlow | Democratic | ||
| Prosecuting Attorney | Donald G. Stouffer | Democratic | ||
| Public Administrator | Paula J. Barr | Democratic | ||
| Recorder | Jamie Nichols | Democratic | ||
| Sheriff | Wally George | Democratic | ||
| Surveyor | Robert Robinson | Independent | ||
| Treasurer | Marty Smith | Republican | ||
State
| Year | Republican | Democratic | Third Parties |
|---|---|---|---|
| 2008 | 32.80% 3,195 | 56.87% 5,540 | 10.34% 1,007 |
| 2004 | 47.46% 4,691 | 51.30% 5,071 | 1.24% 123 |
| 2000 | 42.23% 3,945 | 56.14% 5,245 | 1.63% 152 |
| 1996 | 26.11% 2,315 | 71.45% 6,334 | 2.44% 216 |
Saline County is divided into two legislative districts in the Missouri House of Representatives with split representation.
- District 26 – Joe Aull (D-Marshall). Consists of most of the entire county and included the communities of Arrow Rock, Gilliam, Grand Pass, Malta Bend, Marshall, Miami, Mount Leonard, Nelson, and Slater.
| Party | Candidate | Votes | % | ± | |
|---|---|---|---|---|---|
| Democratic | Joe Aull | 5,326 | 100.00 | ||
- District 118 – Stanley Cox (R-Sedalia). Consists of the communities of Blackburn, Emma, and Sweet Springs.
| Party | Candidate | Votes | % | ± | |
|---|---|---|---|---|---|
| Republican | Stanley Cox | 513 | 60.50 | ||
| Democratic | Raymond F. Kinney | 310 | 36.56 | ||
| Constitution | Curtis Shipman | 25 | 2.95 | ||
All of Saline County is a part of Missouri’s 21st District in the Missouri Senate and is currently represented by Bill Stouffer (R-Napton).
| Party | Candidate | Votes | % | ± | |
|---|---|---|---|---|---|
| Republican | Bill Stouffer | 6,186 | 64.28 | ||
| Democratic | Joe Sadeghi | 3,437 | 35.72 | ||
Federal
All of Saline County is included in Missouri’s 5th Congressional District, which as of 2016 is represented by Emanuel Cleaver (D-Kansas City) in the U.S. House of Representatives. Prior to redistricting following the 2010 United States Census, all of Saline County was included in Missouri's 4th Congressional District.
| Party | Candidate | Votes | % | ± | |
|---|---|---|---|---|---|
| Democratic | Ike Skelton | 4,231 | 60.94 | ||
| Republican | Vicky Hartzler | 2,461 | 35.45 | ||
| Libertarian | Jason Michael Braun | 168 | 2.42 | ||
| Constitution | Greg Cowan | 83 | 1.20 | ||
Political culture
| Year | Republican | Democratic | Third Parties |
|---|---|---|---|
| 2012 | 56.04% 5,104 | 41.61% 3,790 | 2.35% 214 |
| 2008 | 50.39% 4,962 | 47.85% 4,712 | 1.76% 174 |
| 2004 | 54.22% 5,389 | 45.06% 4,479 | 0.71% 71 |
| 2000 | 48.87% 4,572 | 49.01% 4,585 | 2.12% 198 |
| 1996 | 33.10% 2,931 | 53.82% 4,765 | 13.08% 1,158 |
Missouri Presidential Preference Primary (2008)
- Former U.S. Senator Hillary Clinton (D-New York) received more votes, a total of 1,787, than any candidate from either party in Saline County during the 2008 presidential primary. She also received more votes individually than the entire number of votes cast in the Republican Primary in Saline County.
| Saline County, Missouri | ||
|---|---|---|
| 2008 Republican primary in Missouri | ||
| John McCain | 617 (38.30%) | |
| Mike Huckabee | 518 (32.15%) | |
| Mitt Romney | 392 (24.33%) | |
| Ron Paul | 51 (3.17%) | |
| Saline County, Missouri | ||
|---|---|---|
| 2008 Democratic primary in Missouri | ||
| Hillary Clinton | 1,787 (57.46%) | |
| Barack Obama | 1,177 (37.85%) | |
| John Edwards (withdrawn) | 111 (3.57%) | |
Communities
See also
References
- 1 2 "State & County QuickFacts". United States Census Bureau. Retrieved September 14, 2013.
- ↑ "Find a County". National Association of Counties. Retrieved 2011-06-07.
- ↑ Eaton, David Wolfe (1918). How Missouri Counties, Towns and Streams Were Named. The State Historical Society of Missouri. p. 361.
- ↑ Robert Brigham, The Education of the Negro in Missouri, Ph.D. Dissertation, University of Missouri- Columbia, 1946, p. 83
- ↑ Rural and Small Town Schools in Missouri, Dept. of Natural Resources, State Historic Preservation Officer, 2002, p. 10, accessed 15 March 2015
- ↑ "2010 Census Gazetteer Files". United States Census Bureau. August 22, 2012. Retrieved November 20, 2014.
- ↑ "County Totals Dataset: Population, Population Change and Estimated Components of Population Change: April 1, 2010 to July 1, 2015". Retrieved July 2, 2016.
- ↑ "U.S. Decennial Census". United States Census Bureau. Retrieved November 20, 2014.
- ↑ "Historical Census Browser". University of Virginia Library. Retrieved November 20, 2014.
- ↑ "Population of Counties by Decennial Census: 1900 to 1990". United States Census Bureau. Retrieved November 20, 2014.
- ↑ "Census 2000 PHC-T-4. Ranking Tables for Counties: 1990 and 2000" (PDF). United States Census Bureau. Retrieved November 20, 2014.
- ↑ "American FactFinder". United States Census Bureau. Retrieved 2008-01-31.
Further reading
- Napton, William Barclay. Past and Present of Saline County Missouri. (1910) full text
External links
- Digitized 1930 Plat Book of Saline County from University of Missouri Division of Special Collections, Archives, and Rare Books
- Saline County Sheriff's Office
 |
Carroll County | Chariton County | | |
| Lafayette County | |
Howard County | ||
| ||||
| | ||||
| Pettis County | Cooper County |
Municipalities and communities of Saline County, Missouri, United States | ||
|---|---|---|
| Cities | | |
| Villages | ||
| Townships |
| |
| Unincorporated communities | ||
| Footnotes | ‡This populated place also has portions in an adjacent county or counties | |
Coordinates: 39°08′N 93°12′W / 39.14°N 93.20°W